Download presentation
Presentation is loading. Please wait.

1
Making data meaningful through effective visual presentation 5 th - 9 th December 2011, Rome Slides courtesy of: United Nations Economic Commission for Europe Statistical Division

3
Who are you talking to?

4
Tourists Harvesters Miners

5
clear and simple message

12
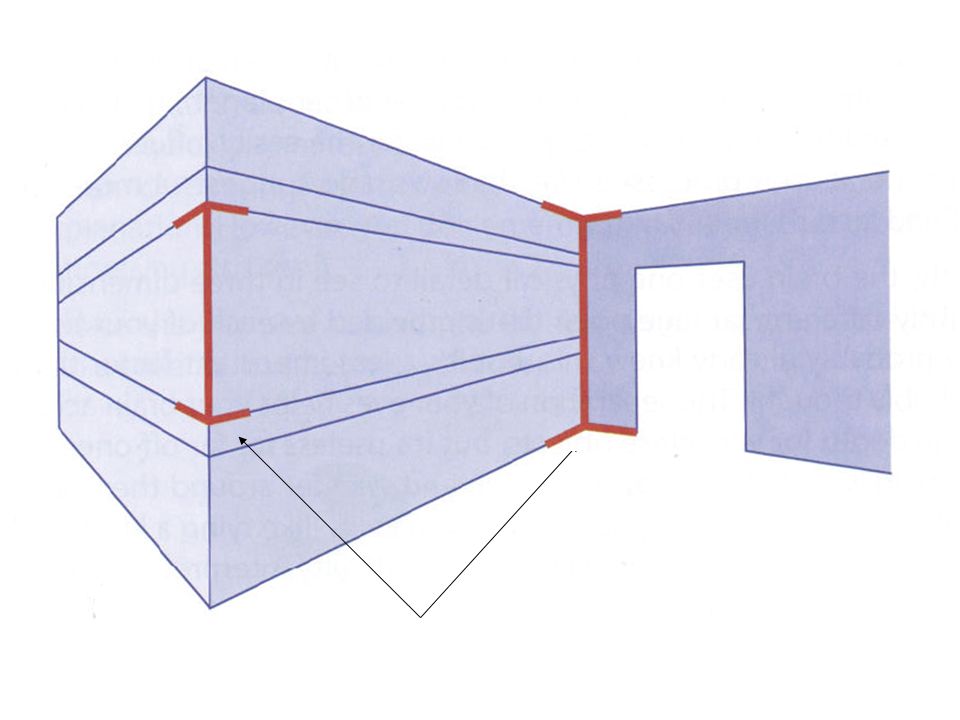
Perception and Symbology – Size/Shape

13
Perception and Symbology - Colour

16
Tables, graphs or maps?

17
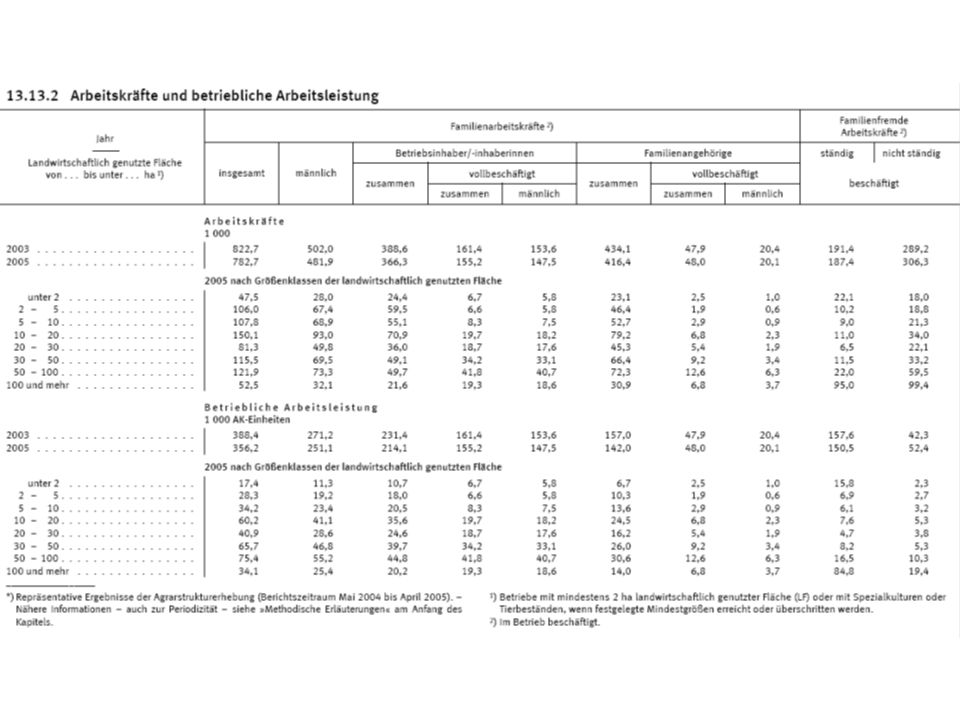
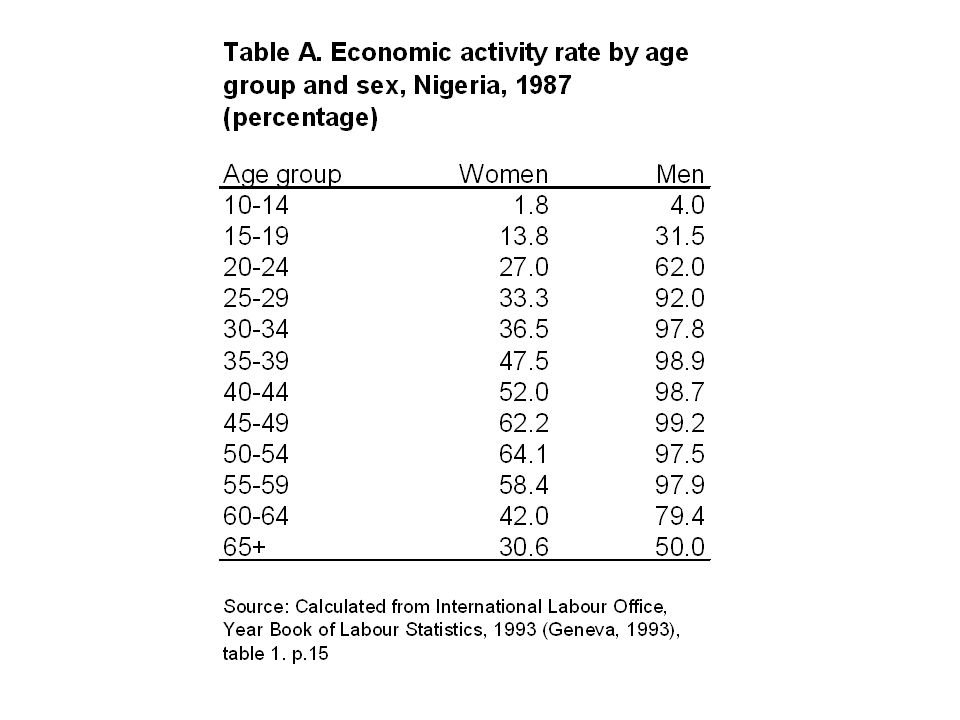
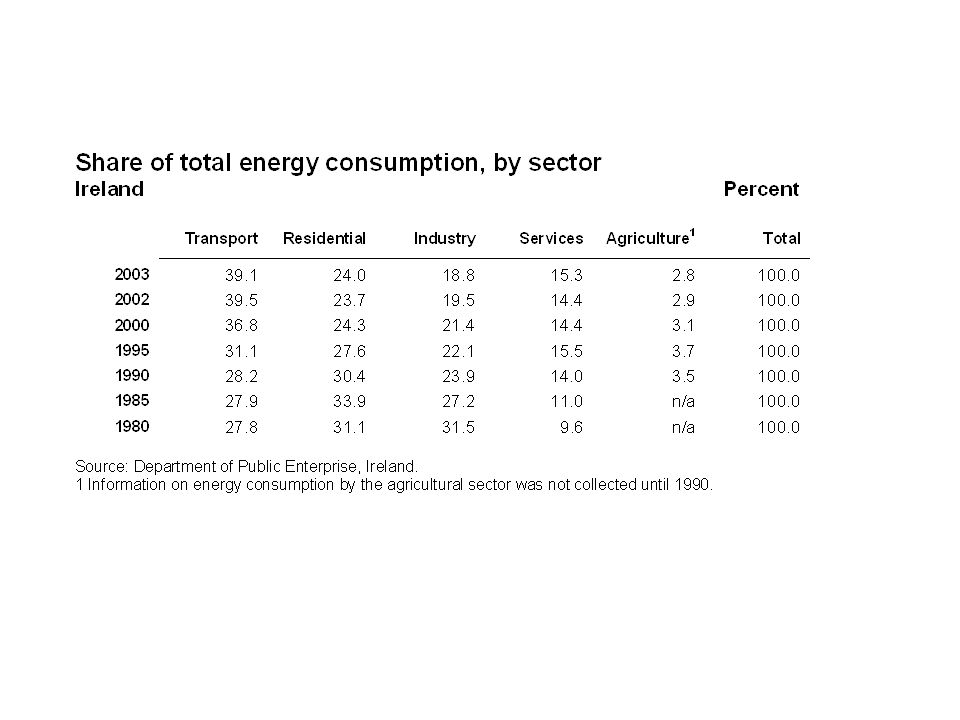
Tables Follow a style guide Title, source, headings, footnotes Clear headings Sort data in appropriate order One decimal place Right-justify numbers

18
Source: Statistics Canada

21
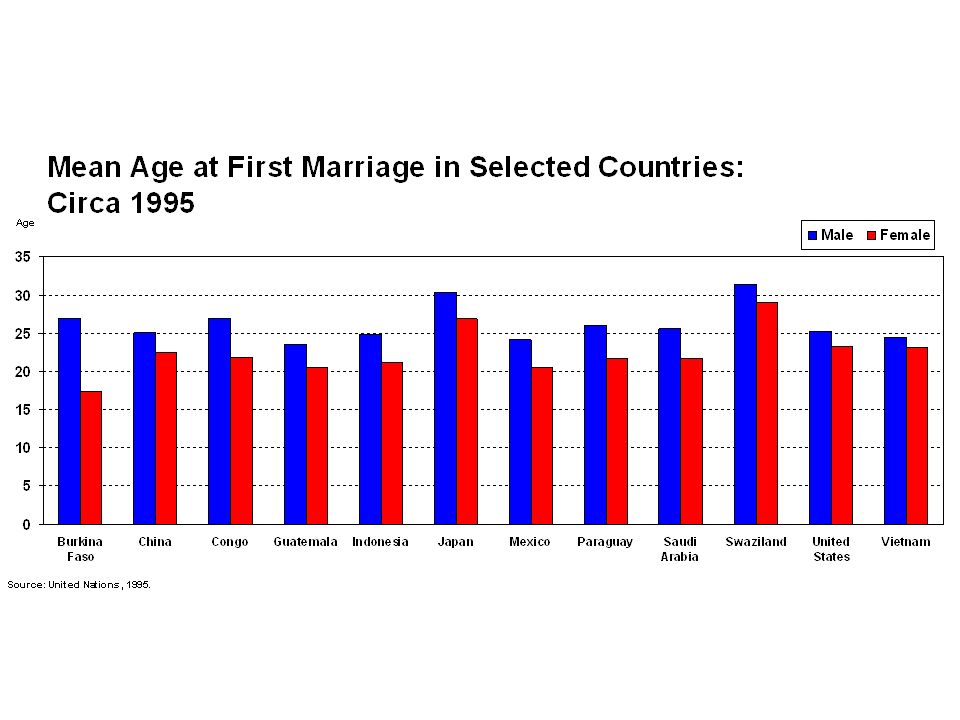
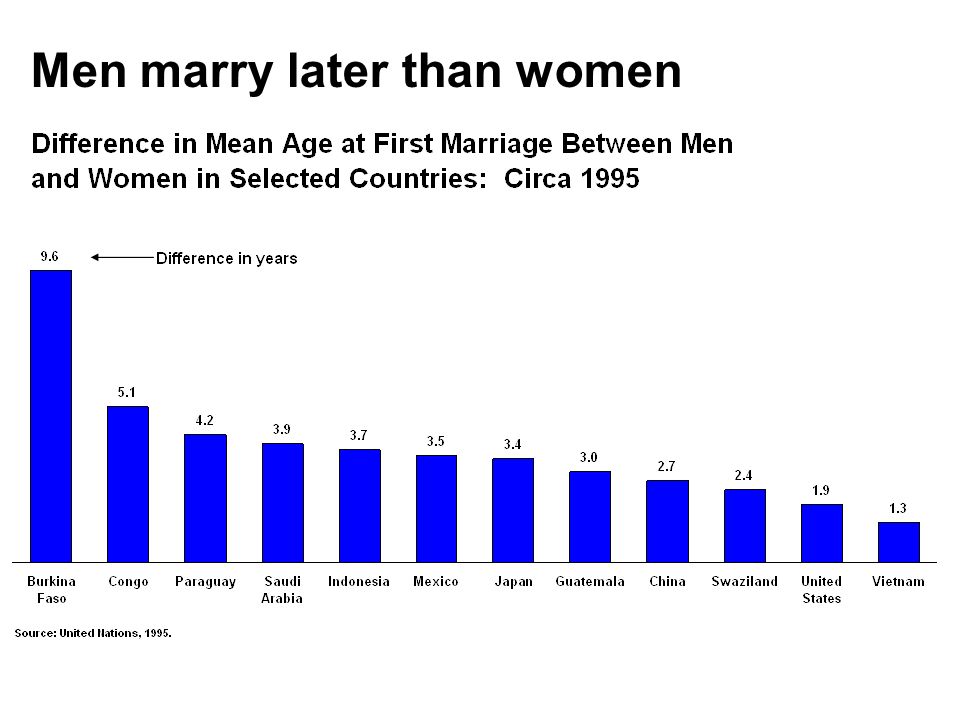
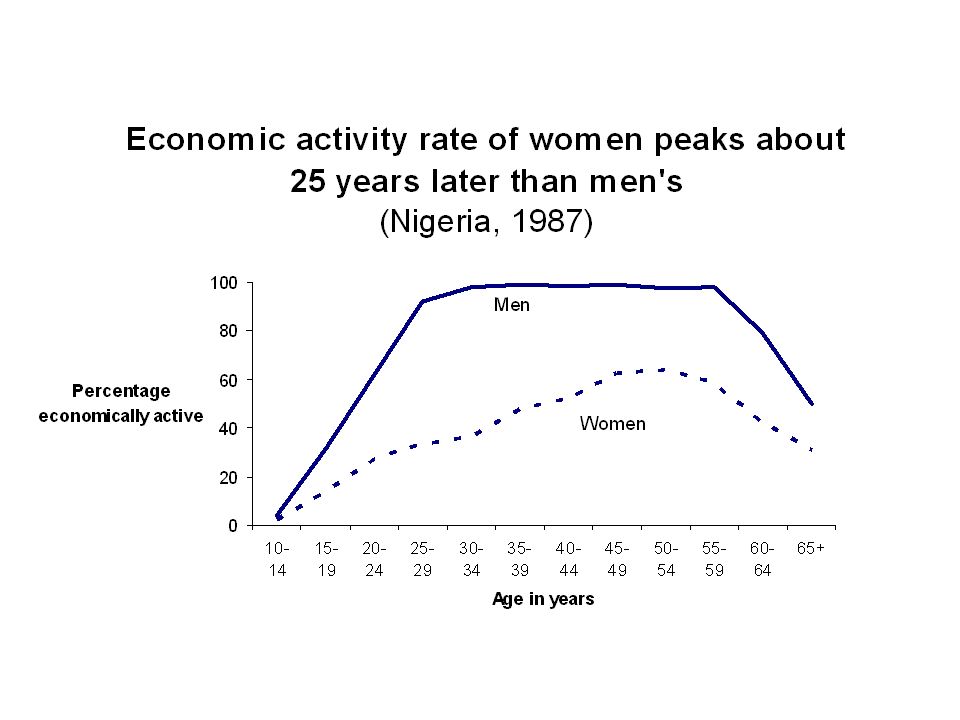
Graphics for showing differences between women and men Box plots Stacked bar graph

24
Men marry later than women

26
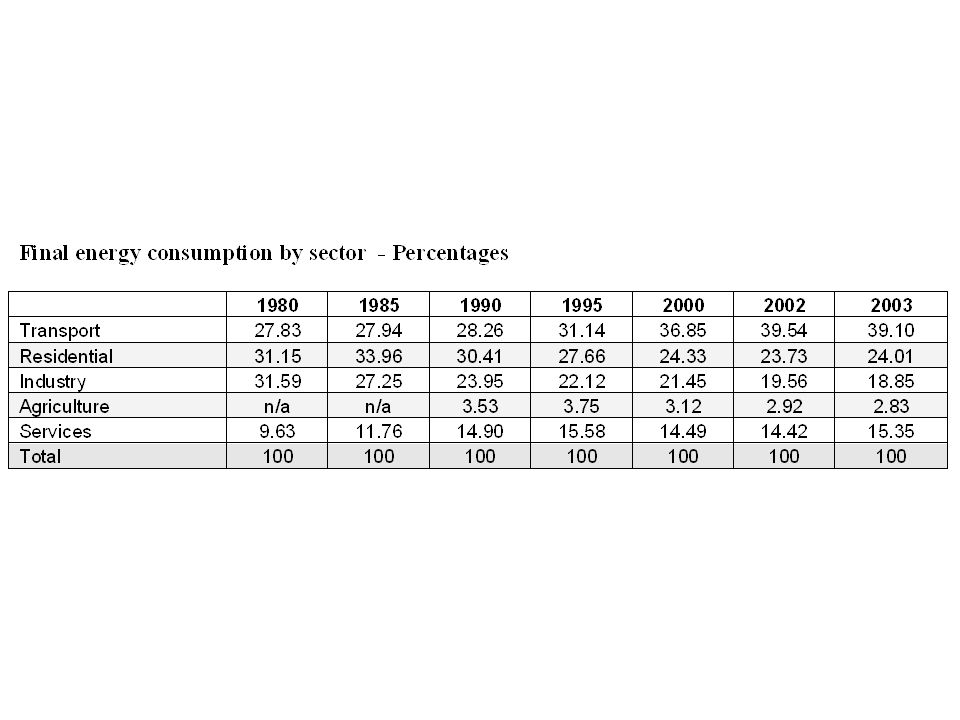
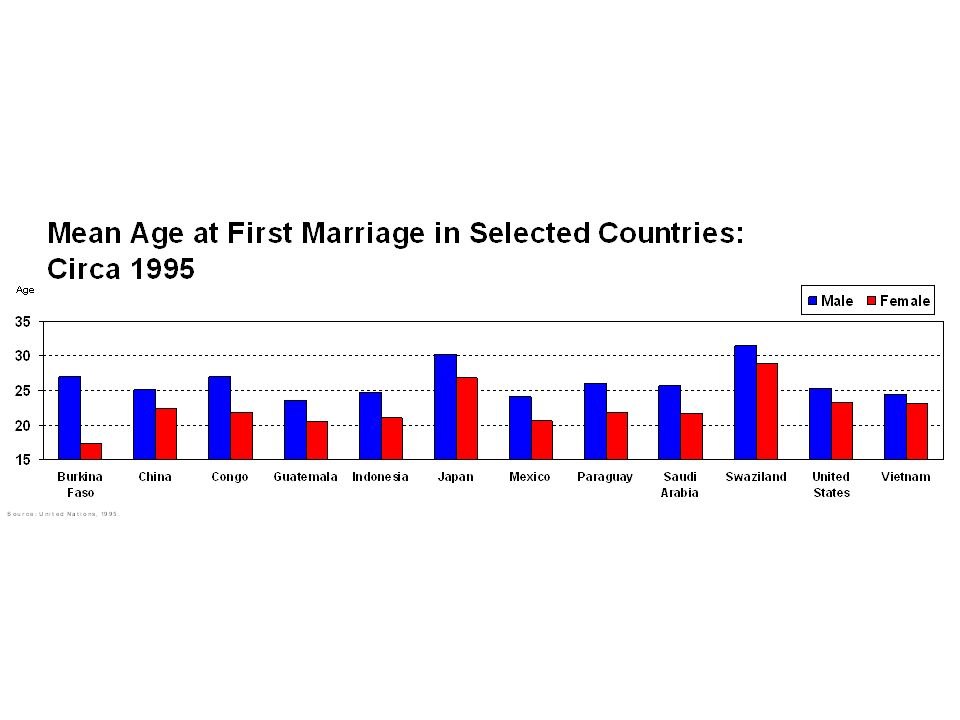
What you should avoid…

27
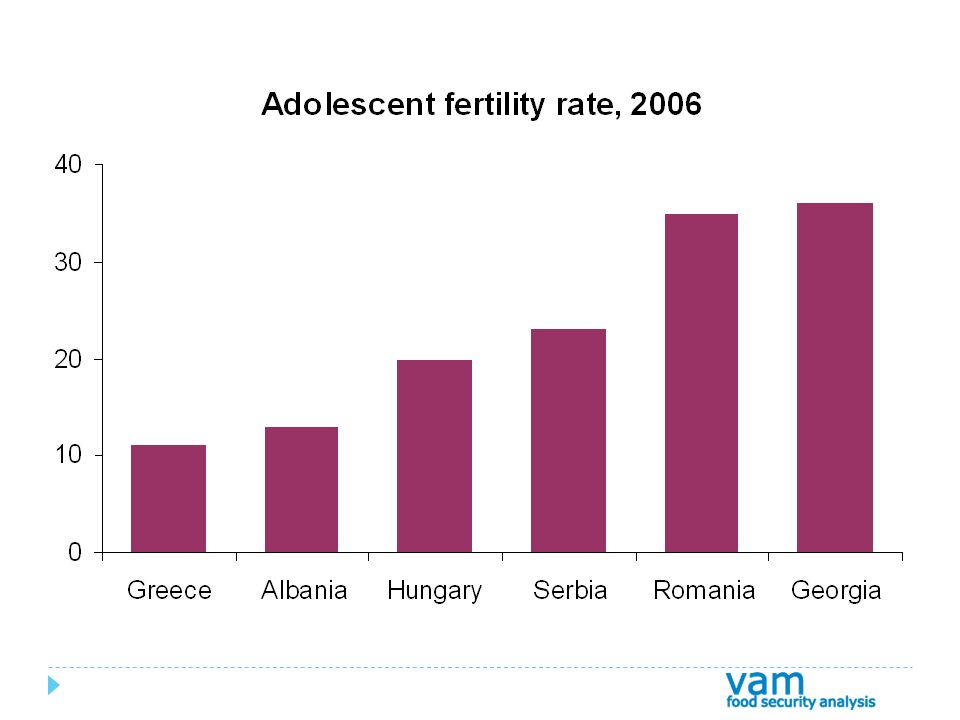
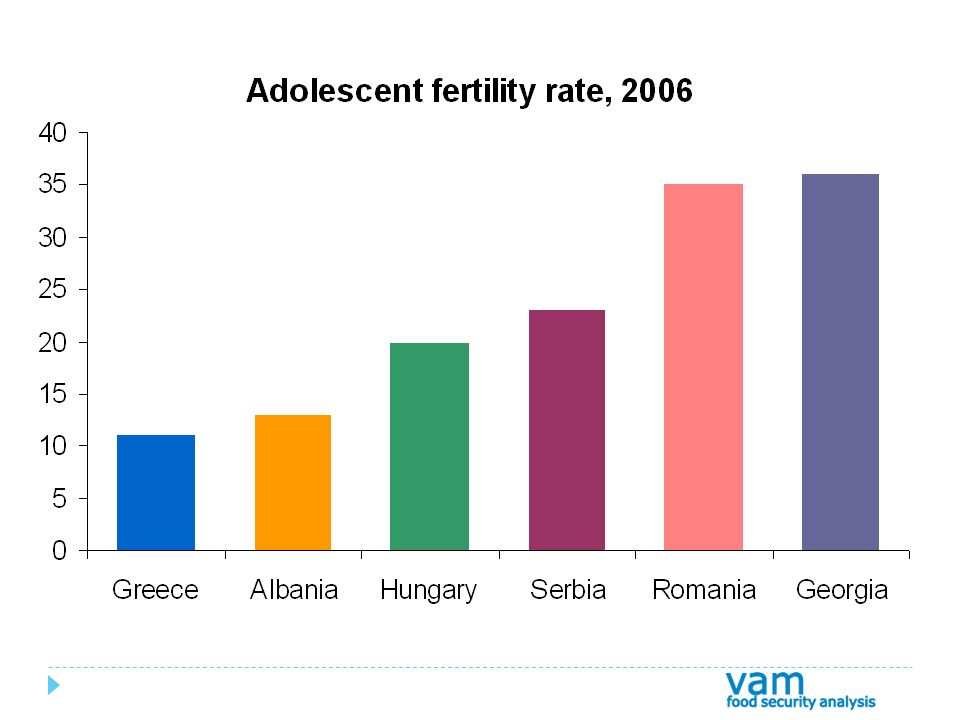
Don’t distract the reader’s attention

31
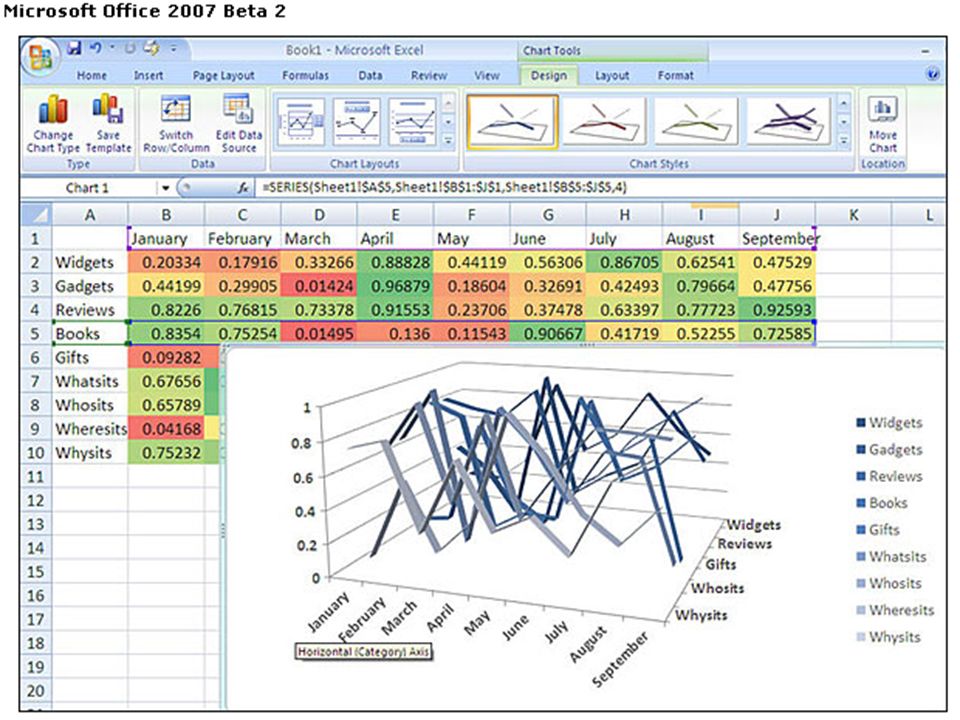
avoid using 3D graphs

32
Avoid three-dimensional charts

37
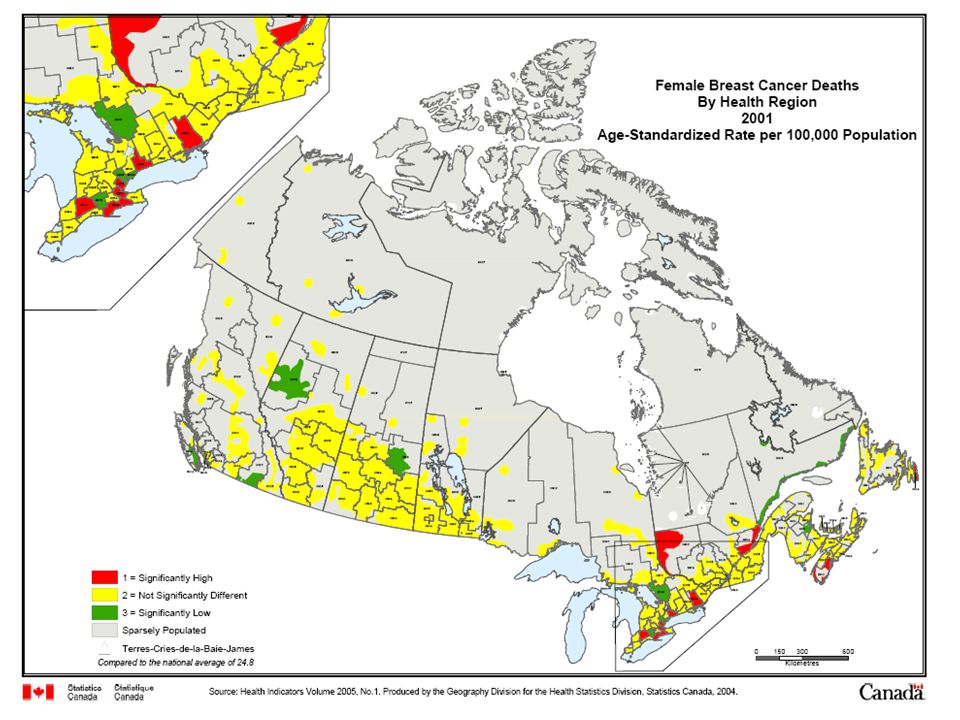
Maps Title Legend Scale bar Source Footnotes

38
Source: E.W. Gilbert as cited in Edward Tufte, The Visual Display of Quantitative Information (1997), p24
, p24.")
40
Summary Visual presentations are tools to communicate Use whatever is best for the audience and message

41
Tourists Harvesters Miners

42
clear and simple message

Similar presentations