Download presentation
Presentation is loading. Please wait.

1
Chapter 1: Exploring Data Lesson 4: Quartiles, Percentiles, and Box Plots Mrs. Parziale

2
Vocabulary: Quartiles: divide the data into _________ roughly even parts. To find Quartiles: – Line up scores numerically – locate the median. – That divides the data in half, thus marking the division between the 2nd and 3rd quartiles. – First quartile Q1 is the median of the lower half of data. – Third quartile Q3 is the median of the higher half of data. four

3
More Vocabulary five number summary: Min, Q 1, Median, Q 3, Max box-and-whiskers plot: a visual representation of the 5-num sum interquartile range: (Q 3 – Q 1 ) ; the ___________ of the middle 50% of the data. This measures the _____________________ of data around the median range concentration

4
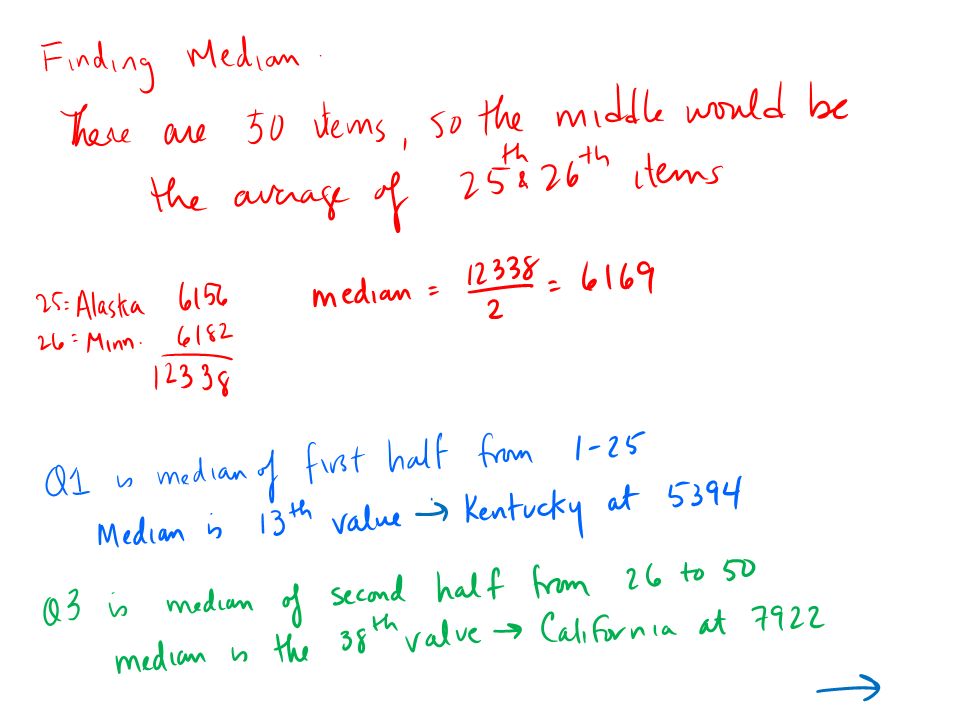
Example 1: Use the College Costs data to the right. Find the data needed to make a box plot. find the median value. Find Q1 Find Q3 What is the 5-num summary? Find the interquartile range (IQR)
.")
7
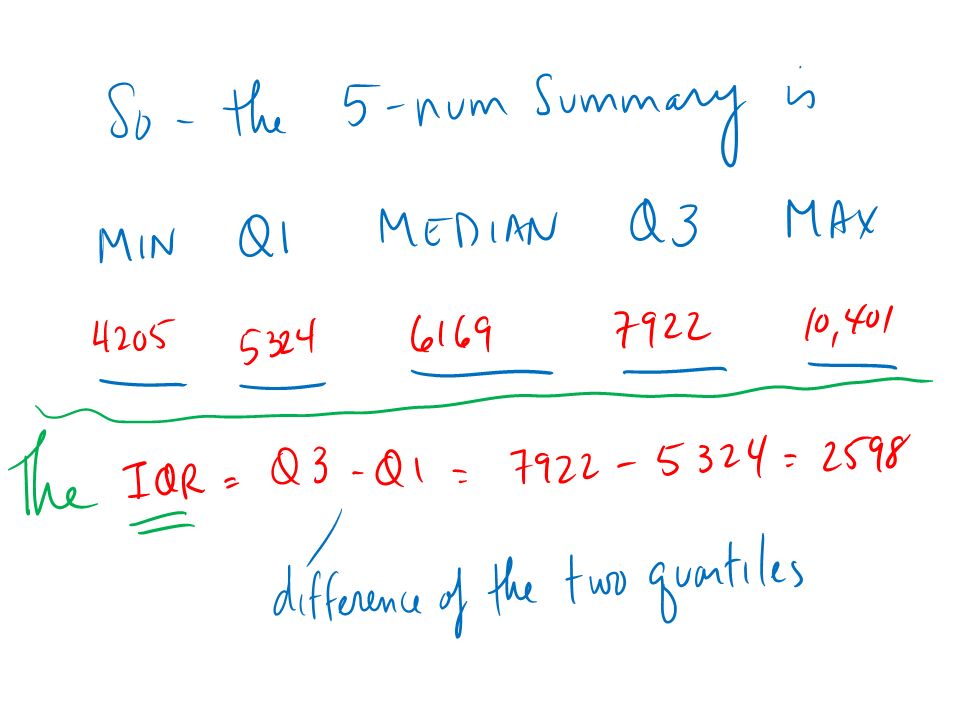
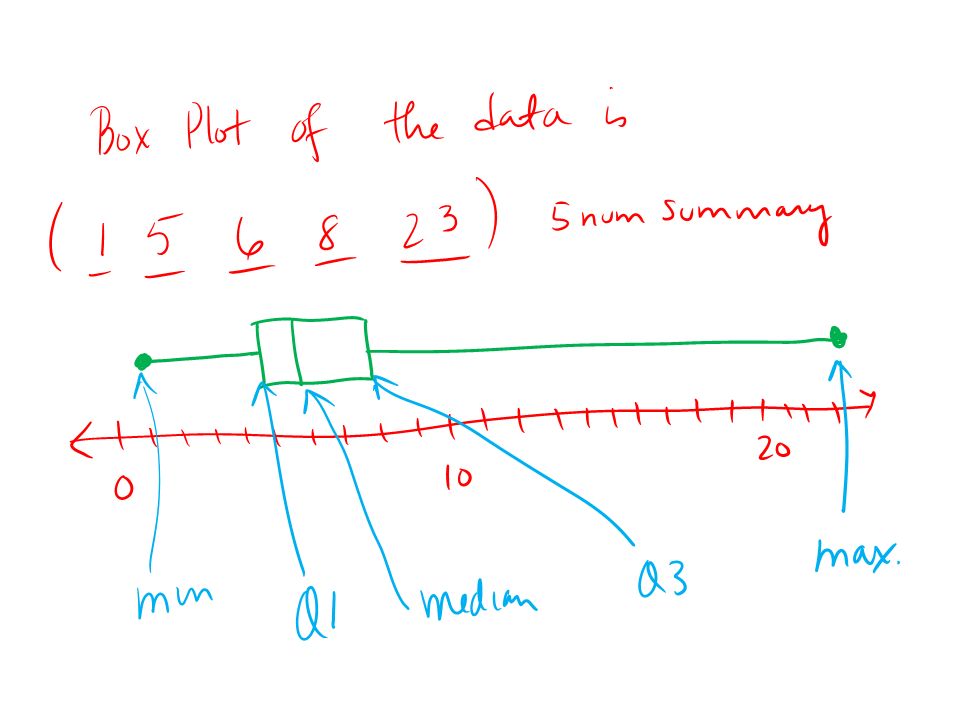
How to make a box plot: Five Number Summary is: 4205, 5324, 6169, 7922, 10401 1. Draw a number line including minimum and max values 2. Draw a rectangle with vertical opposite sides at Q 1 and Q 3. (the hinges) 3. Draw a line parallel to the hinges at the median. 4. Draw segments from the midpoint of the hinges to the min and max (the whiskers)
 3. Draw a line parallel to the hinges at the median. 4. Draw segments from the midpoint of the hinges to the min and max (the whiskers).")
8
Yet More Vocab percentile: the p th percentile of a set of numbers is a ______________________ such that p percent of the numbers are ______________________ to that value. – all points in data set are less than or equal to the max (100 th percentile) – median is the __________ percentile – Q 1 is the ___________ percentile – Q 3 is the __________ percentile value in the set 75 th 25 th 50 th less than or equal
 – median is the __________ percentile – Q 1 is the ___________ percentile – Q 3 is the __________ percentile value in the set 75 th 25 th 50 th less than or equal.")
9
Example 1, cont. What percentile is the first value of our data (Oklahoma)? = g) What percentile rank is New Jersey? = h) What is the cost of the college at the 66 th percentile?.66 = =
 What percentile rank is New Jersey. = h) What is the cost of the college at the 66 th percentile .66 = =.")
10
Using Your TI83 Using the following dataset: {1, 1, 2, 2, 2, 3, 3, 3, 4, 5, 5, 6, 6, 24} Enter data into calculator using STAT EDIT Press 2 nd STATPLOT Press GRAPH Choose box plots Use TRACE to find the values of the 5-num summary.

11
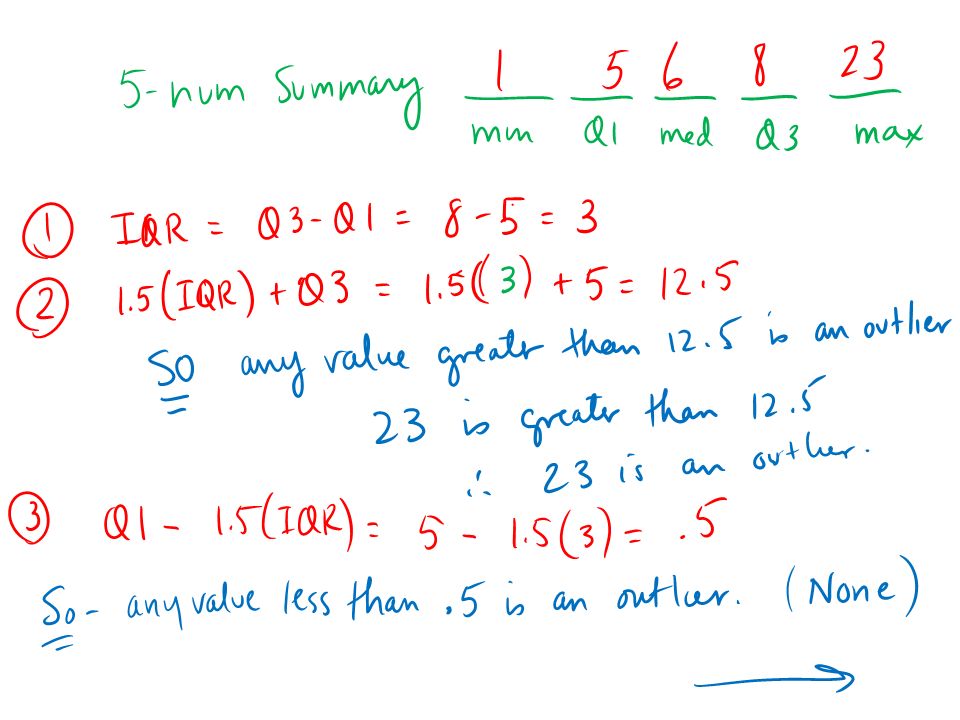
Steps to take when you want to know if something is an outlier? Using the following data (same as previous slide), find the outlier. {1, 1, 2, 2, 2, 3, 3, 3, 4, 5, 5, 6, 6, 24} 1. Find Q 3 – Q 1 (the IQR) 2. Take 1.5*IQR and add it to the Q 3 3. Take 1.5*IQR and subtract it from the Q 1. 4.Anything above or below that number is an outlier.
, find the outlier. {1, 1, 2, 2, 2, 3, 3, 3, 4, 5, 5, 6, 6, 24} 1. Find Q 3 – Q 1 (the IQR) 2. Take 1.5*IQR and add it to the Q 3 3. Take 1.5*IQR and subtract it from the Q 1. 4.Anything above or below that number is an outlier..")
12
{1, 1, 2, 2, 2, 3, 3, 3, 4, 5, 5, 6, 6, 24}

13
Closure Use your calculator to create a box plot for the following data. {1, 4, 5, 5, 5, 6, 6, 7, 8, 12, 23} Find any outliers.

Similar presentations


. Comparing Data Using Boxplots Each section of the boxplot represents 25% of the data. The median (50%tile) is the line.>")


, the Pth percentile of a distribution is a value such that P% of the data fall at or below it. The.>")
