Download presentation
Presentation is loading. Please wait.

1
Meta-analysis and “statistical aggregation” Dave Thompson Dept. of Biostatistics and Epidemiology College of Public Health, OUHSC Learning to Practice and Teach Evidence-Based Health Care Evidence-Based Health Care Third Annual Workshop September 12-13, 2008

2
Meta-analysis “a review in which bias has been reduced by the systematic identification, appraisal, synthesis and, if relevant, statistical aggregation of all relevant studies on a specific topic according to a predetermined and explicit method." Moher D, Cook JC, Eastwood S, Olkin I, Rennie D, Stroup DF. (1999). Improving the quality of reports of meta-analyses of randomized controlled trials: The QUORUM statement. Lancet, 354, 1896-1900.
. Improving the quality of reports of meta-analyses of randomized controlled trials: The QUORUM statement. Lancet, 354,")
3
QUORUM checklist (Moher et al., 1999) Moher D, Cook JC, Eastwood S, Olkin I, Rennie D, Stroup DF. (1999). improving the quality of reports of meta-analyses of randomized controlled trials: The QUORUM statement. Lancet, 354, 1896-1900. Clinical question Patient type InterventionOutcome Studies or sources of data Search strategy Addressing “gray literature” and publication bias Criteria for inclusion of studies Quantitative methods Forest plots Pooling, where studies share similar outcome measures, inclusion criteria, type and duration of treatment. Cumulative meta-analysis
. improving the quality of reports of meta-analyses of randomized controlled trials: The QUORUM statement. Lancet, 354, Clinical question Patient type InterventionOutcome Studies or sources of data Search strategy Addressing gray literature and publication bias Criteria for inclusion of studies Quantitative methods Forest plots Pooling, where studies share similar outcome measures, inclusion criteria, type and duration of treatment. Cumulative meta-analysis.")
4
Statistical aggregation using “forest plots” Lewis, S., & Clarke, M. (2001). Forest plots: Trying to see the wood and the trees. BMJ, 322(7300): 1479–1480. http://www.pubmedcentral.nih. gov/articlerender.fcgi?artid=11 20528 http://www.pubmedcentral.nih. gov/articlerender.fcgi?artid=11 20528
. Forest plots: Trying to see the wood and the trees. BMJ, 322(7300): 1479– gov/articlerender.fcgi artid= gov/articlerender.fcgi artid=")
5
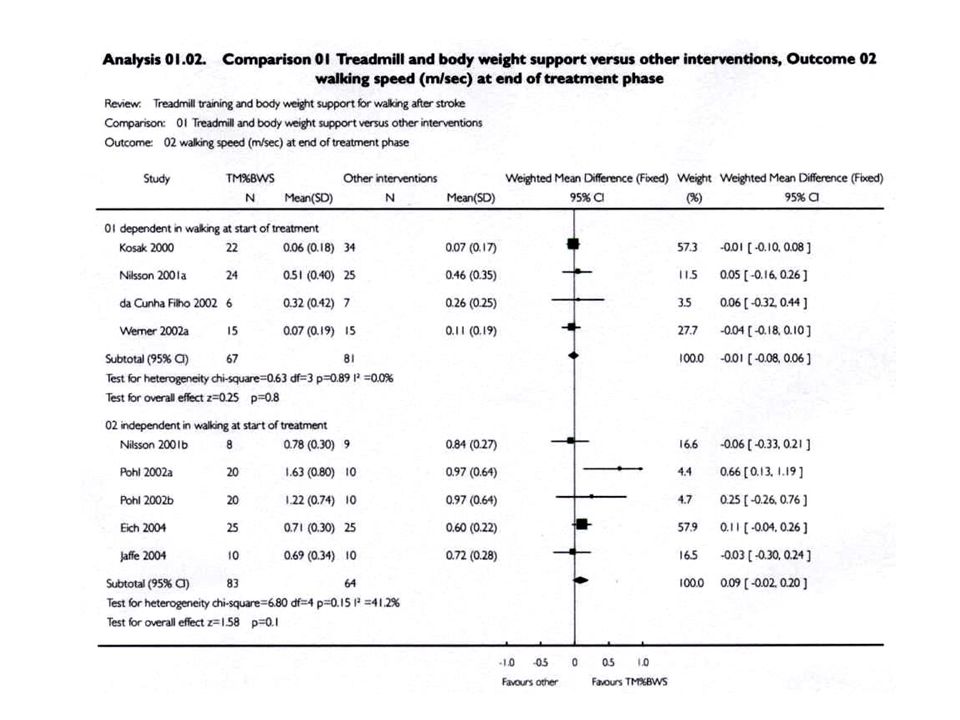
Example 1 Fixed effects analysis Moseley, A.M., Stark, A., Cameron, I.D., & Pollock, A. (2008). Treadmill training and body weight support for walking after stroke. Cochrane Database of Systematic Reviews, 2, 2008.
. Treadmill training and body weight support for walking after stroke. Cochrane Database of Systematic Reviews, 2,")
7
Aggregating (weighting and “pooling”) results of several studies To arrive at overall estimate of outcome, study results are weighted inversely to their variability. The more precise its estimate, the more heavily a study is weighted. Weights depend on both sample size and within-sample variability.

9
Measuring consistency (homogeneity) of studies’ results Individual weights used to calculate Cochran’s Q: Q = w i [outcome of study i - overall effect ] 2 Large values suggest heterogeneity (lack of consistency) Related statistic: I² = 100% x (Q-df)/Q percentage of variation among study outcomes due not to chance, but to heterogeneity among studies.
![Measuring consistency (homogeneity) of studies’ results Individual weights used to calculate Cochran’s Q: Q = w i [outcome of study i - overall effect ] 2 Large values suggest heterogeneity (lack of consistency) Related statistic: I² = 100% x (Q-df)/Q percentage of variation among study outcomes due not to chance, but to heterogeneity among studies.](http://images.slideplayer.com/25/8000520/slides/slide_9.jpg "Measuring consistency (homogeneity) of studies’ results Individual weights used to calculate Cochran’s Q: Q = w i [outcome of study i - overall effect ] 2 Large values suggest heterogeneity (lack of consistency) Related statistic: I² = 100% x (Q-df)/Q percentage of variation among study outcomes due not to chance, but to heterogeneity among studies.")
11
Relatively consistent studies are combined using a fixed effects model, which assumes that each study measures the same outcome, and that the outcome has a true and fixed value in the population.

12
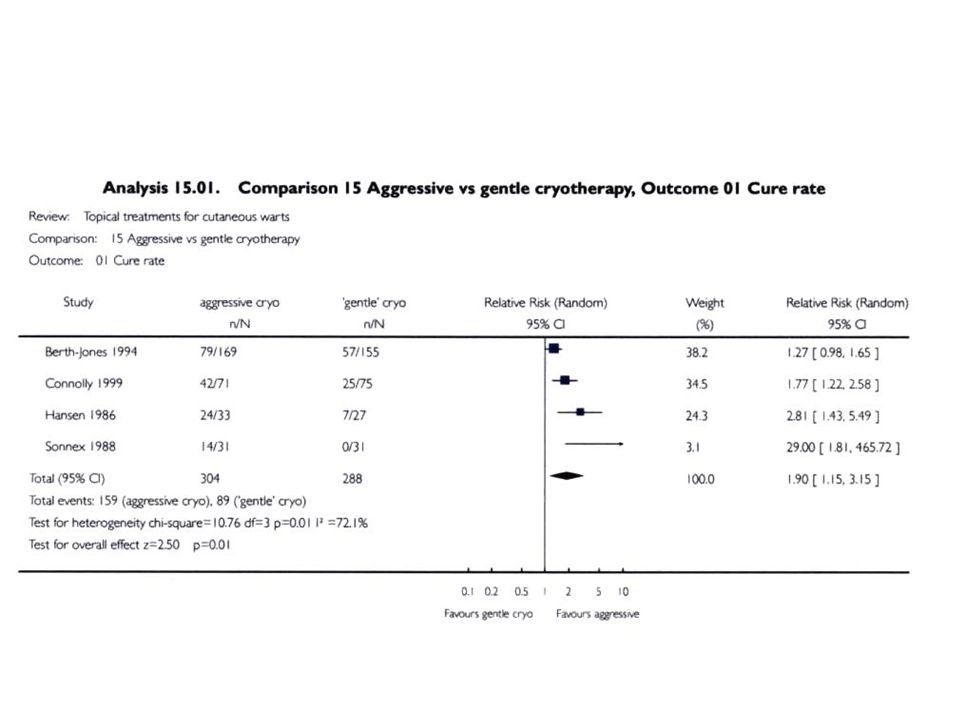
Relatively inconsistent (heterogenous) studies can still be combined in a random effects model, which assumes the studies are a random sample from a family of studies that address slightly different questions. Random effects models produce wider confidence intervals that reflect heterogeneity. No effect on overall estimate.

13
A family of studies that address “slightly different questions?” If we conceive of a clinical question as multidimensional: Patient group Intervention Comparison Outcome then even if studies address the same outcome, they address different questions if, across studies: patient characteristics vary interventions are inconsistent comparison groups are diverse

14
Example 2 Random effects analysis Gibbs, S, & Harvey, I. (2008). Topical treatments for cutaneous warts. Cochrane Database of Systematic Reviews. 2, 2008 Gibbs, S, & Harvey, I. (2008). Topical treatments for cutaneous warts. Cochrane Database of Systematic Reviews. 2, 2008.
. Topical treatments for cutaneous warts. Cochrane Database of Systematic Reviews. 2, 2008 Gibbs, S, & Harvey, I. (2008). Topical treatments for cutaneous warts. Cochrane Database of Systematic Reviews. 2,")
16
Funnel plots Horizontal axis: effect size. Vert. axis proportional to study size and precision. Less precise studies toward bottom. Larger studies (toward top) yield more precise estimates that should approximate true effect size ( ♦). Smaller studies (toward bottom) yield less precise, more variable estimates. Sutton, A.J., Duval, S.J., Tweedie, R.L., Abrams, K.R., & Jones, D.R. (2000). Empirical assessment of effect of publication bias on meta-analyses. BMJ,320:1574-1577.
 yield more precise estimates that should approximate true effect size ( ♦). Smaller studies (toward bottom) yield less precise, more variable estimates. Sutton, A.J., Duval, S.J., Tweedie, R.L., Abrams, K.R., & Jones, D.R. (2000). Empirical assessment of effect of publication bias on meta-analyses. BMJ,320:")
17
Funnel plots and publication bias The graph typically resembles an inverted funnel. Publication bias is suggested if review finds no small and negative studies.

18
Cochran’s Q and I 2 statistics (details) Measures of consistency vs. heterogeneity among study results Q = w i [study outcome i - overall effect ] 2 a weighted sum of squared differences between individual study outcomes and the overall effect across studies. Cochran’s Q is distributed as a chi-square statistic with k-1 degrees of freedom (where k is number of studies) The statistic’s p-value relates to the null hypothesis that individual study estimates are consistent with one another. Related statistic: I² = 100% x (Q-df)/Q percentage of variation across study outcomes due to heterogeneity of studies rather than chance.
 The statistic’s p-value relates to the null hypothesis that individual study estimates are consistent with one another. Related statistic: I² = 100% x (Q-df)/Q percentage of variation across study outcomes due to heterogeneity of studies rather than chance..")
19
Egger test A test of funnel plot asymmetry that tests null hypothesis that y-intercept ( 0 )=0 in a linear regression model: y = 0 + 0 x where y is the estimate (or effect size), divided by its standard error X is precision (reciprocal of the standard error of the estimate). If 0 ≠0, there is evidence of bias Test’s power to detect bias depends on number of studies (data points in funnel plot) Egger M, et al. (1997). Bias in meta-analysis detected by a simple, graphical test. British Medical Journal, 315, 629-634.
 Egger M, et al. (1997). Bias in meta-analysis detected by a simple, graphical test. British Medical Journal, 315,")
20
Egger essentially flips the funnel plots and calculates a regression line that relates the outcome to the study’s precision. The line’s intercept should be zero in the absence of bias.

Similar presentations


.>")


 are a drawing together of material to make a case. These may, or may not,>")


