Download presentation
Presentation is loading. Please wait.

1
CSTPR-CIRES 24th October, 03 Asian Monsoon - ENSO Teleconnections + Climate Change Scenarios for India K. Krishna Kumar CIRES Visiting Fellow (kkrishna@colorado.edu)

2
CSTPR-CIRES 24th October, 03 Outline Monsoon Variability and ENSO Links Monsoon Variability and ENSO Links Recent indifferent behavior of MONSOON-ENSO links and some plausible explanations Recent indifferent behavior of MONSOON-ENSO links and some plausible explanations A brief description on Climate Change Scenarios for the Indian region and possible impacts on Rainfall/Temperature Extremes and Cyclonic Storms A brief description on Climate Change Scenarios for the Indian region and possible impacts on Rainfall/Temperature Extremes and Cyclonic Storms

3
CSTPR-CIRES 24th October, 03 Indian Summer Monsoon Flow

4
CSTPR-CIRES 24th October, 03 Monsoon – A Gigantic Land-Sea Breeze

5
CSTPR-CIRES 24th October, 03 Agriculture Facts India lives mainly in its villages, 600,000 of them Roughly 65% of the population is rural India’s growth in per capita food production during 1979-92 was about 1.6% per annum – the highest in the world during this period Agriculture provides livelihood to about 65% of the labor force Agriculture contributes nearly 29% to the GDP In terms of fertilizer consumption, India ranks 4 th in the world About 43% of India’s geographical area is used for agriculture

6
CSTPR-CIRES 24th October, 03 IRRIGATIONCrop Area under crop (mn. hec) Irrigated area under crop (mn. hec.) Irrigated area as % of total area under crops Foodgrains1214537 Rice431945 Wheat231984 Non- foodgrains 611931 Groundnut9220 Cotton7333 Sugarcane4386 Total1836435
 Irrigated area under crop (mn. hec.) Irrigated area as % of total area under crops Foodgrains Rice Wheat Non- foodgrains Groundnut9220 Cotton7333 Sugarcane4386 Total")
7
CSTPR-CIRES 24th October, 03 Total Foodgrain Production in India and its Relation to Indian Rainfall

8
CSTPR-CIRES 24th October, 03 UNESCO (2000) Report on World Water Earth's hydrosphere contains a huge amount of water equivalent to 1386 million km3. Earth's hydrosphere contains a huge amount of water equivalent to 1386 million km3. 97.5% of this amount is saline and only 2.5% fresh water. 97.5% of this amount is saline and only 2.5% fresh water. The greater portion of this fresh water (68.7%) is in the form of ice and permanent snow cover in the Antarctic, the Artic and in the mountainous region. The greater portion of this fresh water (68.7%) is in the form of ice and permanent snow cover in the Antarctic, the Artic and in the mountainous region. Next 31.3% exit as utilizable fresh water. Next 31.3% exit as utilizable fresh water. Only 0.26% of the total amount of fresh water on the earth is concentrated in lakes, reservoirs, and river systems where they are most easily accessible for our economic needs and absolutely vital for water eco system. Only 0.26% of the total amount of fresh water on the earth is concentrated in lakes, reservoirs, and river systems where they are most easily accessible for our economic needs and absolutely vital for water eco system.
 is in the form of ice and permanent snow cover in the Antarctic, the Artic and in the mountainous region. The greater portion of this fresh water (68.7%) is in the form of ice and permanent snow cover in the Antarctic, the Artic and in the mountainous region. Next 31.3% exit as utilizable fresh water. Next 31.3% exit as utilizable fresh water. Only 0.26% of the total amount of fresh water on the earth is concentrated in lakes, reservoirs, and river systems where they are most easily accessible for our economic needs and absolutely vital for water eco system. Only 0.26% of the total amount of fresh water on the earth is concentrated in lakes, reservoirs, and river systems where they are most easily accessible for our economic needs and absolutely vital for water eco system..")
9
CSTPR-CIRES 24th October, 03 India’s Water Situation

10
CSTPR-CIRES 24th October, 03 Indian Institute of Tropical Meteorology, Pune, India (An Autonomous Institute under Dept. of Science & Technology, Govt. of India) Established 1962 Established 1962 Initially part of Met Department Initially part of Met Department Autonomous in 1971 Autonomous in 1971 100 Scientists 100 Scientists Focus on Monsoon Research Focus on Monsoon Research Climate Diagnostics and Modelling Climate Diagnostics and Modelling
 Established 1962 Established 1962 Initially part of Met Department Initially part of Met Department Autonomous in 1971 Autonomous in Scientists 100 Scientists Focus on Monsoon Research Focus on Monsoon Research Climate Diagnostics and Modelling Climate Diagnostics and Modelling.")
11
CSTPR-CIRES 24th October, 03 Mean Rainfall Patterns Data Source: CMAP (1979-2000) Summer Monsoon (mm/season) Annual (mm/year)
 Summer Monsoon (mm/season) Annual (mm/year)")
12
CSTPR-CIRES 24th October, 03 Indian Summer Monsoon Contribution to Annual Rainfall and its Variability Data Source : CMAP (1979-2000) Monsoon/Annual (%) Coefficient of Variation (%)
 Monsoon/Annual (%) Coefficient of Variation (%)")
13
CSTPR-CIRES 24th October, 03 Mean Annual Cycle of All-India Mean Monthly Rainfall

14
CSTPR-CIRES 24th October, 03 Monsoon Variability IntraseasonalInterannualDecadal/CenturyMillennia & longer Onset/withdrawal; Active and break- monsoon phases; 30-50 day oscillations; severe rainstorms Droughts and floods Changes in the frequency of droughts and floods Changes in the areal extents of monsoons Atmospheric variability; tropical- midlatitude interactions; Soil moisture; Sea surface temperatures Atmospheric interactions; El Niño/ Southern Oscillation; Top layers of tropical oceans; Snow cover; Land surface characteristics Monsoon circulation variations; Deep ocean changes; Greenhouse gases increase; Human activities; Biospheric changes; Volcanic dust Global climate excursions; Ice ages; Warm epochs; Sun-earth geometry Factors Features

15
CSTPR-CIRES 24th October, 03 Daily Evolution of Rainfall on all-India Scale 20022003

16
CSTPR-CIRES 24th October, 03 The Stability of the Indian Summer Monsoon

17
CSTPR-CIRES 24th October, 03

18
MonRF epochs

19
CSTPR-CIRES 24th October, 03

21
Schematic view of sea surface temperature and tropical rainfall in the the equatorial Pacific Ocean during normal, El Niño, and La Niña conditions....

22
CSTPR-CIRES 24th October, 03 Global Impacts of ENSO

23
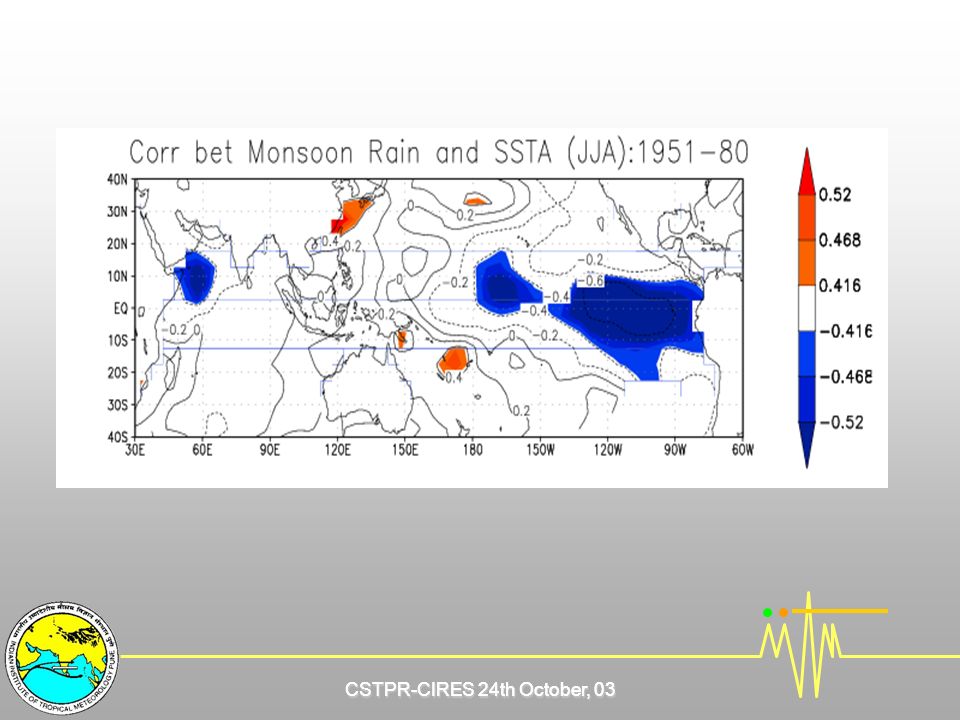
CSTPR-CIRES 24th October, 03 Low-frequency co-variability of Monsoon Rainfall and ENSO

24
CSTPR-CIRES 24th October, 03

26
Difference in the Composites of Winter (Prior to Monsoon) Surface Air Temperatures over the Eurasian Region during El Nino Events pre- 1980 and post-1980 periods (1981-97) – (1951-80) El Ninos Diff. Climatologies of these Periods

27
CSTPR-CIRES 24th October, 03 Relation between Indian Monsoon Rainfall and 200 (A,B) and the Composites of 200 for El Nino Events pre-,post-80’s (C,D)
 and the Composites of 200 for El Nino Events pre-,post-80’s (C,D)")
28
CSTPR-CIRES 24th October, 03 Sea Surface Temp Anomalies in 1982 & 1997 JJA 82 SON 82 JJA 97 SON 97 Monsoon Rainfall: -13% Monsoon Rainfall: +2%

29
CSTPR-CIRES 24th October, 03 Sea Surface Temp Anomalies: 1987 & 2002 JJA 87 SON 87 JJA 02 SON 02 Monsoon Rainfall: -18% Monsoon Rainfall: -19%

30
CSTPR-CIRES 24th October, 03 Precipitation Anomalies: JJA 19821997 1987 2002 Monsoon Rainfall: -13% Monsoon Rainfall: +2% Monsoon Rainfall: -18% Monsoon Rainfall: -19%

31
CSTPR-CIRES 24th October, 03 Precipitation Anomaly in NE Australia (DJF) and NE Brazil (JFM) in 1988 and 1998 19881998 1988 1998
 and NE Brazil (JFM) in 1988 and")
32
CSTPR-CIRES 24th October, 03 Surface Temp Anomaly over North America: DJF 1983 1998 1988 2003

33
CSTPR-CIRES 24th October, 03 Precipitation/ Forecasts of SST and Precipitation in JAS 2002 by Different GCMs

34
CSTPR-CIRES 24th October, 03

36
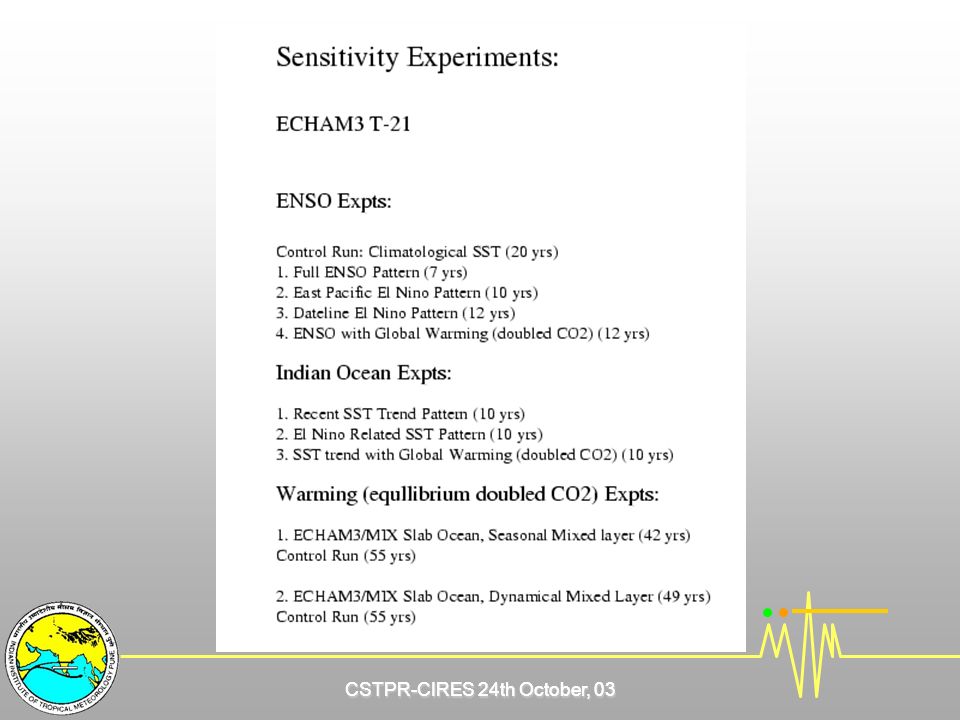
SST Patterns Used for ENSO Experiments

37
CSTPR-CIRES 24th October, 03 SST Patterns Used for Indian Ocean Experiments

38
CSTPR-CIRES 24th October, 03 A A C

39
Response of Indian Monsoon Rainfall to Different El Nino Related SST Patterns ModelMonsoonRainfall ENSO - CTL NINODL-NINOENSOGW-ENSO

40
CSTPR-CIRES 24th October, 03

43
JJA-1 JJA-1 SON-1 DJF-1 MAM

44
CSTPR-CIRES 24th October, 03

Similar presentations


![El Niño Southern Oscillation [ENSO] NORMAL: - Easterly trade winds between ± 30° latitude (Coriolis Force) - Sea Surface Height slant to west - Warm basin.](/15/4529057/big_thumb.jpg "El Niño Southern Oscillation [ENSO] NORMAL: - Easterly trade winds between ± 30° latitude (Coriolis Force) - Sea Surface Height slant to west - Warm basin.>")


>")
>")


 Physical Oceanography>")


