Download presentation
Presentation is loading. Please wait.

1
Steve Crawford Environmental Director NTF JUNE 2-4, 2009 Chair, TAMS Steering committee Chair, USET Natural Resource Committee Member, NTWC Member, NTC Member, TEPAC

2
Solar Power Photo-voltaics Geothermal RGGI review Algae biomass Windpower Tidal power Waste to energy Project Bunch of thoughts

3
Rural Renewable Energy Alliance Jay Edens Director Non-profit, based in Minneapolis Turn key production facility to produce solar panels for less than $1,500 for 4 x 10 ft panels Generate enough heat to reduce heating bills 25% Much better than LIHEAP Production facility employs 2 people, in 20’x 20’ Tribe may be able to access RGGI funds for development Passamaquoddy Development and Supply

5
Production doubling every two years 12,400 MW globally Germany leads the world in photo-energy production, with 30% less sun than Vermont. Power cost /kwh will be at parity with fossil fuels by 2012

7
Carbon Credit fund, begun October 2008 Quarterly auction for next 9 years First auction generated $2.8 million Funds for reducing CO2 emissions $40,000 grant received for weatherization of houses

9
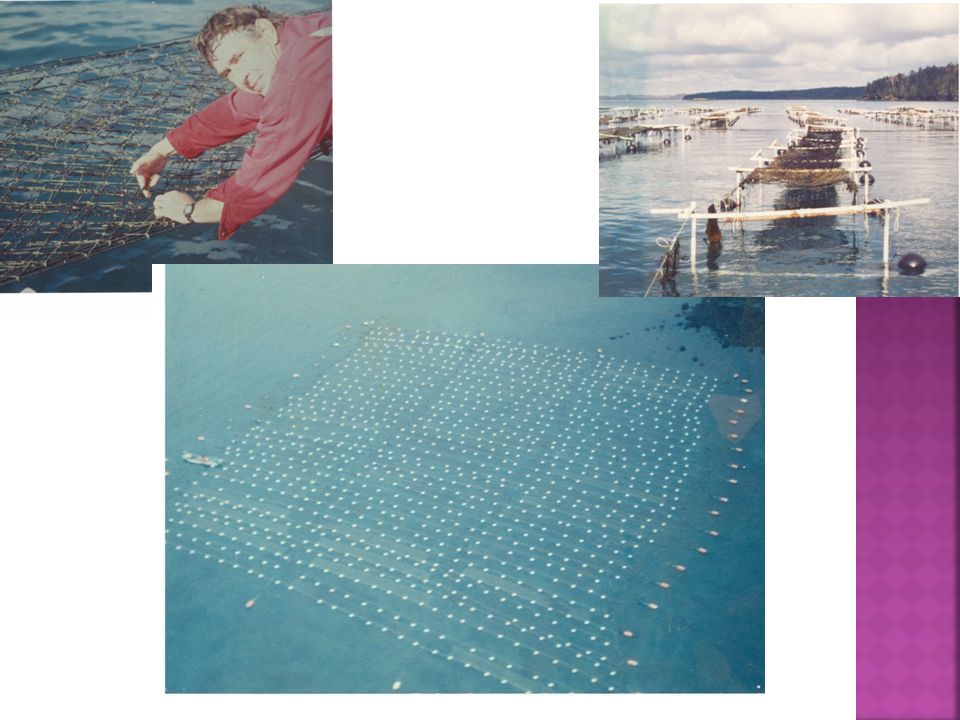
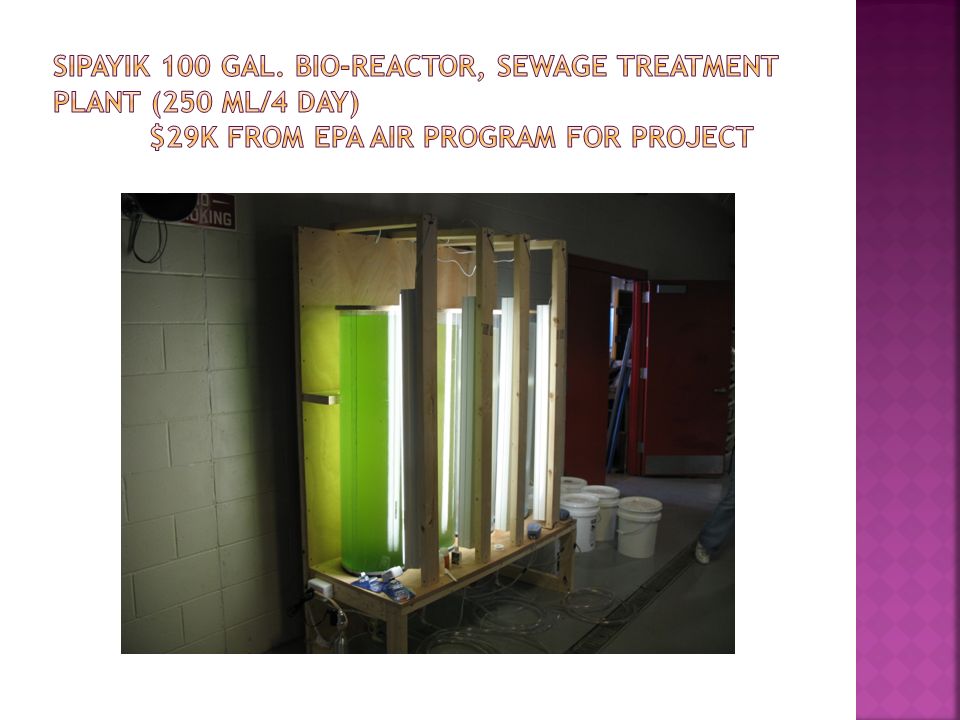
“ There is no other resource that Comes even close in magnitude to the potential for making oil” John Sheehan, energy analyst, National Renewable Energy Lab (NREL), DOE, Golden, CO Corn, 18 gal/acre: Algae, 5,000 Lipid content, Corn <2%, Chlorella Alga, 44 20000 gal of algal culture = 300 gal biodiesel Harvest every 4 days, 1,000 gal bioreactor yields 300 gal biodiesel every 20 weeks.
, DOE, Golden, CO Corn, 18 gal/acre: Algae, 5,000 Lipid content, Corn <2%, Chlorella Alga, 44 gal of algal culture = 300 gal biodiesel Harvest every 4 days, 1,000 gal bioreactor yields 300 gal biodiesel every 20 weeks.")
11
Wind power site WINDPOWER SITES Wind power site

12
15 months wind data Class 3 wind, commercially viable RFP to 13 contractors, resulting in one proposal, DISGEN Simple lease, no ownership, annual lease payment beginning at $227,000, escalate to $324,000 by year 25. 100% ownership would yield $7,623,000 first year, escalating to $10,723,000 by year 25.

13
Cedar Mountain, T3R9 No met data, but approx 25 miles from 30.5 MW Stetson Mountain project being constructed. Transmission line <8 miles, in Millinocket Prentiss Township Probably best wind farm site in State, but no transmission lines nearby. Quebec Hydro Line 8 miles to west

14
1 2 TIDAL PROJECT SITES

15
UEK Turbines

16
2 – year FERC pilot lease, funded by BIA, ends 2010 Produce enough power to power sewage treatment plant, approx. $2,000/month Further development of tidal turbine “farm” has low potential, might generate 2 MW to provide power for local area. Requires substantial regulatory development, and at least 10 years away.

17
Not incineration Reduce volume Recycle metal and glass Recover energy By-products: syn-gas, water, fly ash, glass, metals Very little CO2 Tipping fees approx. $40-50/ton

18
Proven Technology, with plants being used since 1992 by US Navy, Canadian Department of Defense, numerous different markets and site locations around the world and in the US. 50 Ton plant =200 ft x 85 ft x 30 ft building, greenhouse is extra

19
Tribal participation, on Tribal Trust land Near NEBCO office? Reclaim MSW dumps in Washington County Reduce tipping fees Generate power and heat Reduce CO2 emissions 5 acre greenhouse for algal oil production, vegetable/medicinal plant production

20
We are at 387 ppm now, there is no return

21
Climate change and food 15 billion Tons CO2 equivelants from agriculture Includes 7.2 billion Tons from livestock World carry-over stocks of grain 2008= 62 days; a record low. 25% of US grain is going to bio-fuel, enough to feed 500 million Indians.

22
Take home messages: To meet agricultural demand, productivity would need to double on a land area basis. CO 2 fertilization of crop yield is only half of what is assumed in global food security models.. Don Ort, Inst. Of Genomic Biology, U. of Ill. @ Urbana-Champaign, 2008

23
Climate change and water 70% of all freshwater used for irrigation Wheat production – 8% since 1997, Rice – 4%

24
Climate change and health: Direct: Thermal stress, death/injury in storms, floods Indirect: Changes in range of disease vectors Impacts: Traumatic, infectious, nutritional, psychological occurring in demoralized and displaced populations.

25
Every human exhales 1 ton of CO2/yr 8.2 Billion tons/yr CO2 released from fossil fuel combustion THERE ARE 6.8 BILLION OF US

26
There’s a crack in everything That’s how the light gets in To illuminate us and save our world

Similar presentations


.>")


.>")


