Download presentation
Presentation is loading. Please wait.

1
Targeting home fire safety checks Andy Mobbs - London Fire Brigade Risk Information Team February 2008

2
Reducing accidental fires in the home Modernisation of the fire service put clear focus on prevention as well as response Strategy for HFSVs started in 2003 Yearly target of approx 65,000 visits With 3.5 million homes in London and around 6,500 fires in the home, visits must be effectively targeted to reduce risks 3.25 percent of homes visited to date

3
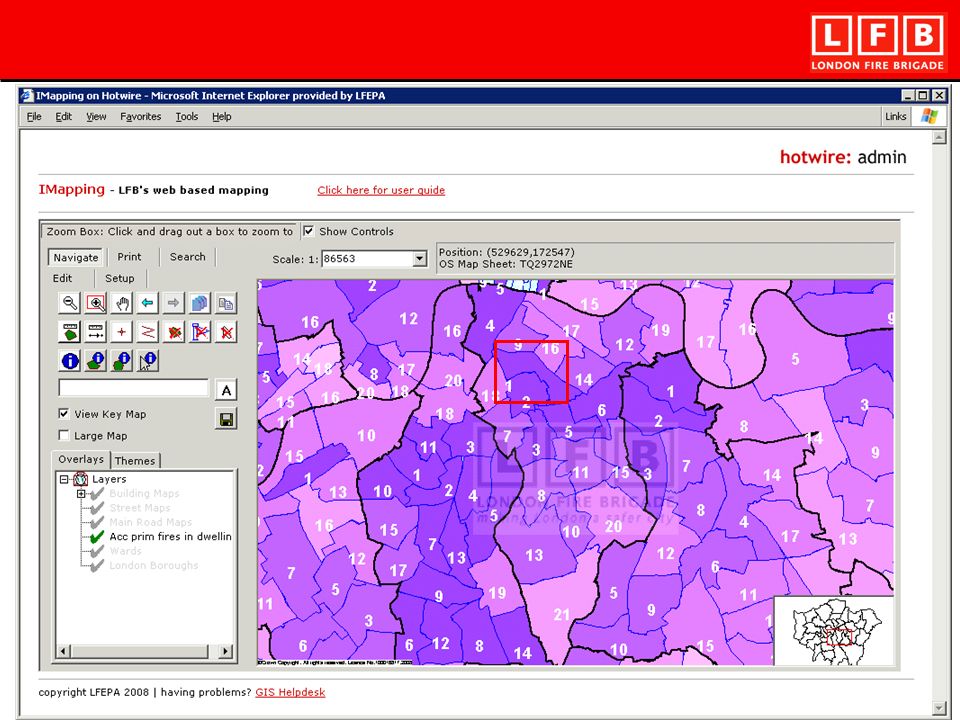
Problems with targeting – where Incident locations vary year-to-year Accidental dwelling fires for Southwark 2005, 2006 & 2007

4
Problems with targeting – who CLG at risk groups defined from those fires that cause greatest harm Broad descriptions cannot easily be translated into real people Older people Children and young people Ethnic minorities or faith groups People with learning or physical disabilities People with alcohol or drug use problems People with mental illness People in poor housing

5
Solution Develop a risk model that combines our incident data with what we know about people, their society and their environment in such a way that we can predict the real level of risk (incident likelihood) Use consumer profiling to describe (and locate) at risk groups by lifestyle ….which we call iRAT
 Use consumer profiling to describe (and locate) at risk groups by lifestyle ….which we call iRAT")
6
What is iRAT? An Incident Risk Analysis Toolkit A statistical approach to analysing the occurrence of incidents A way of combining data about incidents, people, society and geography Prioritising households by lifestyles A systematic way to deliver prevention activities in the areas of highest likelihood to those who experience incidents most often

7
How is iRAT used? Outputs from the statistical modelling are presented as risk rankings i.e. how does ward A compare with ward B in terms of incident likelihood This gives at pan-London or borough level assessment of relative risk Wards ranked highest should receive the greatest focus of our prevention activities Within the areas of highest likelihood, priority should be given to those who experience a disproportionate number of fires

14
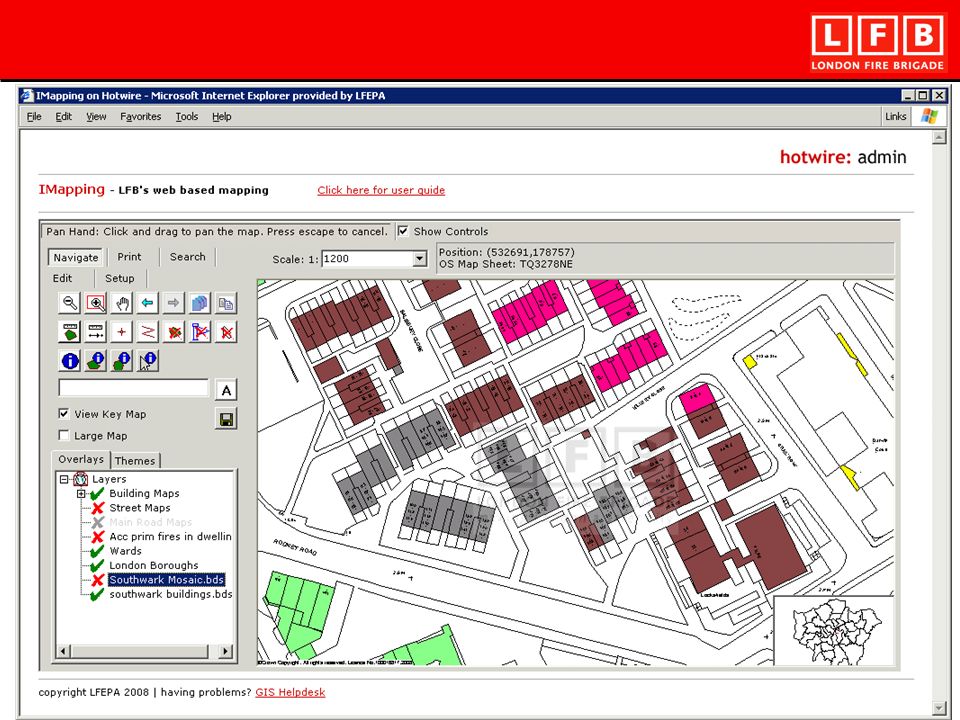
Prioritising households using Mosaic

15
What is Mosaic? A commercially available consumer profiling database Its comprehensive analysis of citizens at postcode and household level provides deep insight into the socio- demographics, lifestyles, culture and behaviour of UK citizens Detailed lifestyle profiles together with preferences for marketing communications Additionally, it provides a common currency that enables the same citizen to be viewed in the same way by all public bodies, supporting joined-up government and partnership working

16
Comparing Mosaic groups with accidental fires in the home Previous targeting has focused on what we have learnt about fire death and injury But this targets the consequence of fire and not necessarily those who are most at risk of a fire occurring Less is known about those who experience fire but are not harmed by it Approximation using consumer profiling More complete profile of people that does not focus on one single factor Age or ethnicity or deprivation

18
Analysing accidental dwelling fires using Mosaic ADFs compared with Mosaic Groups Mosaic GroupNo. of HHNo. of AFDsProp. of HHProp. of ADFsADFs per HHIndex A 458,29156613.81%8.79%0.00123564 B 87,662912.64%1.41%0.00103854 C 505,58559215.23%9.20%0.00117160 D 499,13192215.04%14.32%0.00184795 E 947,926167628.56%26.04%0.00176891 F 470,754114714.18%17.82%0.002437126 G 24,012500.72%0.78%0.002082107 H 163,6112354.93%3.65%0.00143674 I 56,3891471.70%2.28%0.002607134 J 103,8141803.13%2.80%0.00173489 K 1,53310.05%0.02%0.00065234 n/a 830 12.89% Totals 3,318,7086437100.00% 0.001940100

19
Analysing accidental dwelling fires using Mosaic Over representationUnder representation

20
Comparing Mosaic groups Group E - Young, single and mostly well-educated, these people are cosmopolitan in tastes and liberal in attitudes Key Features - Young singles, few children; Full time students/Professionals; Open-minded Receptive to - Internet; Leaflets, Posters; Telephone advice lines; Magazines, Broadsheets Group F - People who are struggling to achieve rewards and are mostly reliant on the council for accommodation and benefits Key Features - Families, many young children; Low incomes; Heavy watchers of TV Receptive to - TV; Telemarketing; Leaflets, Posters; Red top newspapers

22
Taking the work forward Accessibility of mapped data Priority postcode data Mistrust of statistics Confusion between at risk, prevalence vs. proportions and risk reduction Need to refine Mosaic by using type analysis Applying Mosaic to other incident types

23
Questions?

24
Contact details London Fire Brigade Risk Information Team Andy Mobbs020 8555 1200andrew.mobbs@london-fire.gov.uk Paul Eady020 8555 1200paul.eady@london-fire.gov.uk Riana Smit020 8555 1200riana.smit@london-fire.gov.uk

25
Modelling explained

26
Statistical approach Multi-variate regression modelling Standard industry technique 70 data sources used Includes, historic incidents, demographic and geographic data Data used to explain pattern of historic incidents, then rolled forward to give a predictive element to the modelling Best model selected after many iterations and evaluation of outlying data Each ward then ranked based on predicted incident count iRAT model outputs give better match to incidents than any single variable (incident trends, deprivation, rented accommodation etc) Approach validated by independent consultants
 Approach validated by independent consultants")
27
Data sources National Statistics 2001 Census Demographics, dwelling types, health, transport Ordnance Survey Geographic area, road types and length Mosaic consumer profiles 11 groups Indices of multiple deprivation Income, employment, health, education, housing, crime, living environment Regulatory fire safety site inspections High, medium and low risk grading Historic incident information 8 years of incident data Home fire safety visits 3 years of visit data

28
Risk analysis aligned to performance management Incident types linked to performance management BVPIs, local indicators Cause considered Prevention activities are significantly different Accidental or deliberate Risk analysis shows where to target Performances analysis shows impact 17 incident types modelled

Similar presentations


 House Human Services Committee August 8, 2006.>")
 Alison Kitson, Programme Leader (CPD)>")

: one-day introductory.>")


 Households Below Average Income ESDS Government FRS.>")

