Download presentation
Presentation is loading. Please wait.

1
TO ERR IS HUMAN ……

2
We detest it. We avoid even talking about it. ERRORS

3
Do we really understand them? Not taught properly during UG and PG Medical errors Medical Negligence: Not doing something, which a reasonable person would do or doing something which a reasonable person would not do.

4
Zero Error Paradigm Doctors And Health Sector Are Expected To Deliver Every Time Doctors Themselves & Lay Public Thinks That Doctors Can Achieve This Impossible Ideal Every Time

5
Objectives Understand Errors Factors that lead to errors Error management

6
Significance of Error Potential Leads To: Misdiagnosis Delays In Treatment Increased Costs Avoidable Retests Cost US 200million USD Per Year Even A Small Calibration Bias Can Affect Treatment Rates: 1% +Ve Bias In Cholesterol Result 5% Increase In Patients Exceeding The Treatment Cut-off 3% +ve Bias 15% Increase In Patient Treatment

7
Comparative Perspective Error Rates Could Be Reported In Cases Per Million To Allow Easy Comparison: 2.5 Deaths / Million Anaesthesia Cases 164 Deaths / Million Car Crashes 5000 Cases Of Lost Baggage / Million Air Passengers 4566 Laboratory Errors (Results > 6SD) / Million Results Kazmierczak & Catrou. Arch Pathol Lab Med 1993;117:714-8

8
Consequences of the Error Loss of lives Increase in total cost Loss of trust in System Diminished satisfaction – Patients/Docs Institute of Medicine Report Nov-1999Institute of Medicine Report Nov-1999

10
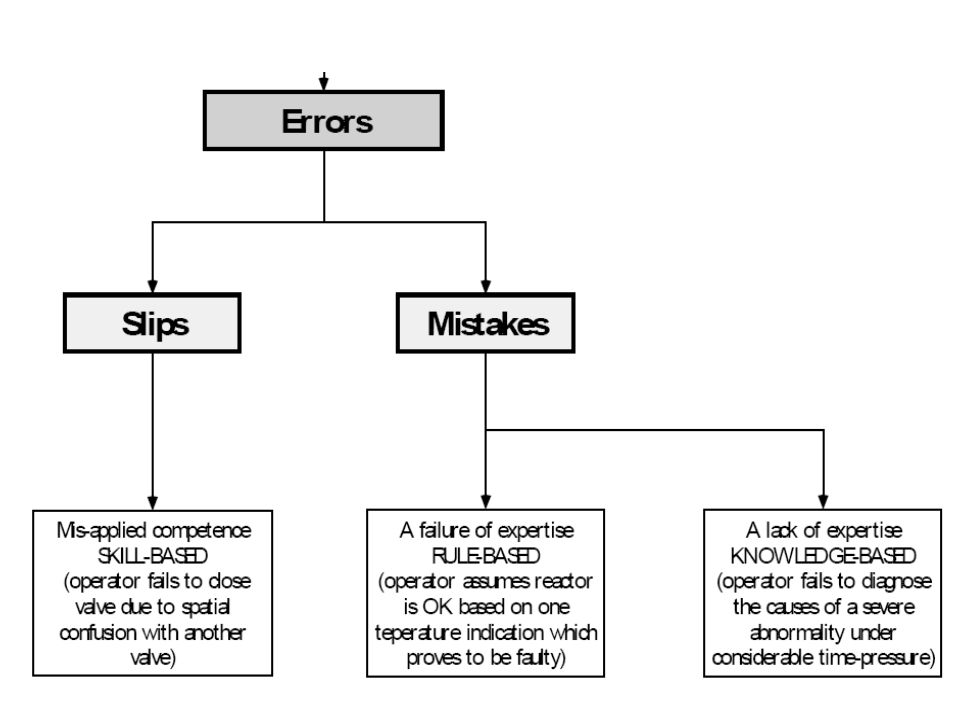
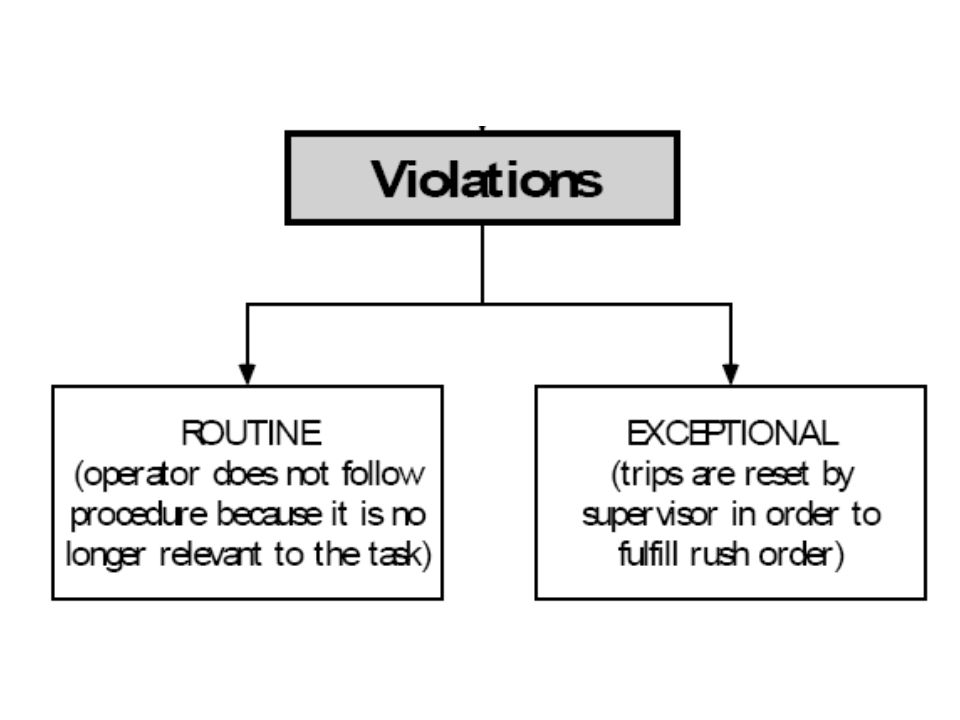
Understanding Human Behaviour and Error David Embrey Human Reliability Associates 1, School House, Higher Lane, Dalton, Wigan, Lancashire. WN8 7RP

13
Basic Concept True value - this is an ideal concept which cannot be achieved. Accepted true value - the value approximating the true value, the difference between the two values is negligible. Error - the discrepancy between the result of a measurement and the true (or accepted true value).
..")
14
Sources of Error Analytical – Random & Systematic Non-analytical

15
Random Error An error which varies in an unpredictable manner, in magnitude and sign, when a large number of measurements of the same quantity are made under effectively identical conditions. Random errors create a characteristic spread of results for any test method and cannot be accounted for by applying corrections. Random errors are difficult to eliminate but repetition reduces the influences of random errors.

16
Random Errors

17
Causes of R.E. (Imprecision) Reagent Variable Reagent Mixing Splashing Calibrators Too Frequent calibrations Variable Age QC material Variable Preparation Variable Age Sample Carry-over Interference Common to all these materials Evaporation / Condensation Instrument Worn out spares Electrical Noise ( E.M.F.) Inconsistent wavelength Inconsistent Temperature Volumetric / Timing Error Contamination of Tubings/Valves Partial blockages in Sample/ Rgt probes variable cuvette thickness Intermittent failure
 Reagent Variable Reagent Mixing Splashing Calibrators Too Frequent calibrations Variable Age QC material Variable Preparation Variable Age Sample Carry-over Interference Common to all these materials Evaporation / Condensation Instrument Worn out spares Electrical Noise ( E.M.F.) Inconsistent wavelength Inconsistent Temperature Volumetric / Timing Error Contamination of Tubings/Valves Partial blockages in Sample/ Rgt probes variable cuvette thickness Intermittent failure.")
18
Systematic Error An error which, in the course of a number of measurements of the same value of a given quantity, remains constant when measurements are made under the same conditions, or varies according to a definite law when conditions change. Systematic errors create a characteristic bias in the test results and can be accounted for by applying a correction.

19
Systematic Errors

20
Common Causes of S.E. (Bias) Manual Error in Reconstitution of Control/ Calibrator/ Reagent / Water quality Over a Period of Time Changes in Volumetric / Timing Light Source Instrument Spares
 Manual Error in Reconstitution of Control/ Calibrator/ Reagent / Water quality Over a Period of Time Changes in Volumetric / Timing Light Source Instrument Spares.")
21
Accuracy…. …The agreement between your value and the 'true' value, that is how correct your result is.

22
Precision…. The reproducibility of your results or the agreement between replicate measurements.

23
The Closer Your Results, Are To Each Other, For The Same Analyte In The Same Serum, The Better Your Precision. For Method evaluation, precision should be assessed in terms of:- - Within Run Performance (Intra-assay precision) - Between Run Performance (Inter-assay precision)
 - Between Run Performance (Inter-assay precision).")
24
Accurate and Precise Imprecise But Will Be Accurate If You Average The Results Precise but Inaccurate

25
Specificity…. …is the ability of a method to measure solely the component of interest. A lack of specificity will affect accuracy − Falsely elevated or lowered values may be obtained

26
…is the ability to detect small quantities of a measured component. Sensitivity… − will affect both precision and accuracy at the bottom end of the assay range.

27
AIMS OF QC & QA Quality control simply ensures that results generated by the system are correct. Quality Assurance is concerned with much more: Right test is carried out on the right specimen, and that the right result and right interpretation is delivered to the right person at the right time

28
Quality Assessment - (Proficiency testing) means to determine the quality of the results. & is a challenge to the effectiveness of the QA and QC programs. Quality Assessment - RANDOX RIQAS, BIORAD EQAS.

29
Objectives Of Internal QC To Improve & Maintain Performance (Analytical, Medical & Other Aspects) To Alert Staff Towards Erroneous Results & To Take Remedial Actions To Detect Undue Variations In Results & Identify Its Source
 To Alert Staff Towards Erroneous Results & To Take Remedial Actions To Detect Undue Variations In Results & Identify Its Source")
30
LEVY JENNING’S CHART

31
Levy Jennings Chart +3 sd -3 sd +2 sd -2 sd -1 sd +1 sd Analyte conc. Target value Daily Assay Run

32
Westgard Rules Formulation Based On Statistical Methods To Analyse Data. To Define Specific Performance Limits To Detect Random And Systematic Errors. Six Commonly Used Westgard Rules – Two - Warning Four - Mandatory Violation of Warning rules should Trigger A Review Of Test Procedures, Reagent Performance And Equipment Calibration. Violation of Mandatory Rules Should Result In Rejection of The Results

33
Warning Rules Warning 1 2SD : When the IQC value exceeds the mean by 2SD. It is an event likely to occur normally in less than 5% of cases. – Random Error Warning 4 1SD : If four consecutive IQC values exceed the same limit (mean 1SD) and this may indicate the need to perform instrument maintenance or reagent calibration. – Systematic Error/ Bias
 and this may indicate the need to perform instrument maintenance or reagent calibration. – Systematic Error/ Bias.")
34
Mandatory Rules Mandatory 1 3SD : When the IQC value exceeds the mean by 3SD. Regarded as out of control. – Systematic Error Mandatory 2 2SD : When two consecutive IQC values exceed the mean on the same side of the mean by 2SD.– Systematic Error Mandatory R 4SD : Applied when the IQC is tested in duplicate or N=2. when the difference in SD between the duplicates exceeds 4SD. Mandatory 10x : When the last 10 consecutive IQC values are on the same side of the mean or target value. – Systematic Error

35
Westgard Rules: 1 3SD +3 sd -3 sd +2 sd -2 sd -1 sd +1 sd Analyte Conc. Target value Daily Assay Run

36
Westgard Rules: 10X +3 sd -3 sd +2 sd -2 sd -1 sd +1 sd Analyte Conc. Target value Daily Assay Run

37
Westgard Flowchart Control data 1 point outside 2 SD 1 point outside 3 SD 2 consecutive values outside the same 2 SD Difference between 2 controls within a run exceeds 4 SD 4 consecutive control values on one side of the mean and further than 1 SD from the mean 10 consecutive values on one side of the mean In control – report data Out of control – reject analytical run Yes No Yes

38
Follow-up Action in the Event of a Violation Accept the test run in its entirety - only when a warning rule is violated. Initiate a review. Reject the whole test run - only when a mandatory rule is violated. Enlarge the grey zone and thus re-test range for that particular assay run - this option can be considered in the event of a violation of either a warning or mandatory rule.

39
HOW TO INVESTIGATE THE CAUSE….. …… ELIMINATE THE GUESSWORK LAY DOWN A PROTOCOL

40
Generic Protocol for Remedial Actions 1.Reanalyze the same control immediately. 2.Repeat the test using a fresh vial of control. 3.Repeat the test using a new control from a different lot. 4.Check integrity of Reagent system & make necessary changes. 5.Perform maintenance and rerun the control. 6.Recalibrate (Only if necessary) and rerun the control. 7.Call an expert for help.
 and rerun the control. 7.Call an expert for help..")
41
“Knowing is Not Enough; We Must Apply. Willing is Not Enough; We Must Do.” —Goethe

42
Planning QC Strategy Define quality specifications - TEa Measure – Assess bias & imprecision - TE Analyse with Normalised OPSpecs Charts, Power Function graphs, Critical-error graphs, QC selection grids etc. Implement & Improve Control Monitor with SIGMA MATRIX

43
WHAT IS ‘BEYOND QC’ ?

44
OTHER ISSUES TO BE CONSIDERED Maintenance & Monitoring of - Materials, Machine & Man Method Validation QC/ Calibrator Material S.O.P.s Comparison Of Data

45
Maintenance & Monitoring Temperature maintenance – For Material stability - Refrigerator, Analysers Water Quality – NCCLS Grade II Electrical Stability– Earthing, E.M.F. Instruments – P.M., Cuvettes, Bulbs, Tubings. Calibration of equipments - Pipettes Maintenance of Procedure Manuals Inventory managements & Storage - Materials

46
MONITORING - Reagents Reagent characteristics – Vital data pH O.D. of Blanks Factor Range Conductivity for diluents etc. Calibration factors – Delta checks Reaction Curves – For Ap & As Errors & Action Taken Logs

47
METHOD VALIDATION Should be Performed Before Introducing Test / New Method / Systems in Routine Practice by Thoroughly Testing Reference Material or by Comparison of Test Results Performed by an Alternative Method

48
Criteria & Information Sought In Method Validation Accuracy by running known value samples of M.D.Levels & comparing test results – For Constant & Proportional errors, Regressional analysis Precision by running replicates of QC samples with within- the-run, Across-the-run & Between-the-run precision checks & comparison Linearity Information

49
QC / CALIBRATOR MATERIAL Third Party Control Materials Controls with values for your method/ instruments with wider database Stability & Type of Material (Matrix Effect) Running Two levels of controls – Provides better error checks across a range
 Running Two levels of controls – Provides better error checks across a range")
50
Man Training of Staff Basic Continuous education Laying down S.O.P.

51
COMPARISON OF TEST RESULTS Peer Group Comparison (Randox 24x7) Delta Checks (Previous values) Clinical correlation
 Delta Checks (Previous values) Clinical correlation")
52
THANK YOU !!

Similar presentations


 for Medical Laboratories: An introduction Dr. Otto Panagiotakis and Dr. Alexander Haliassos ESEAP – Greek Proficiency Testing.>")


. You can freely download,>")


