Download presentation
Presentation is loading. Please wait.

2
Economics 111.3 Winter 14 March 5 th, 2014 Lecture 19 Ch. 9 Ordinal Utility: Indifference Curve Analysis

3
Substitution Effect and Income Effect

4
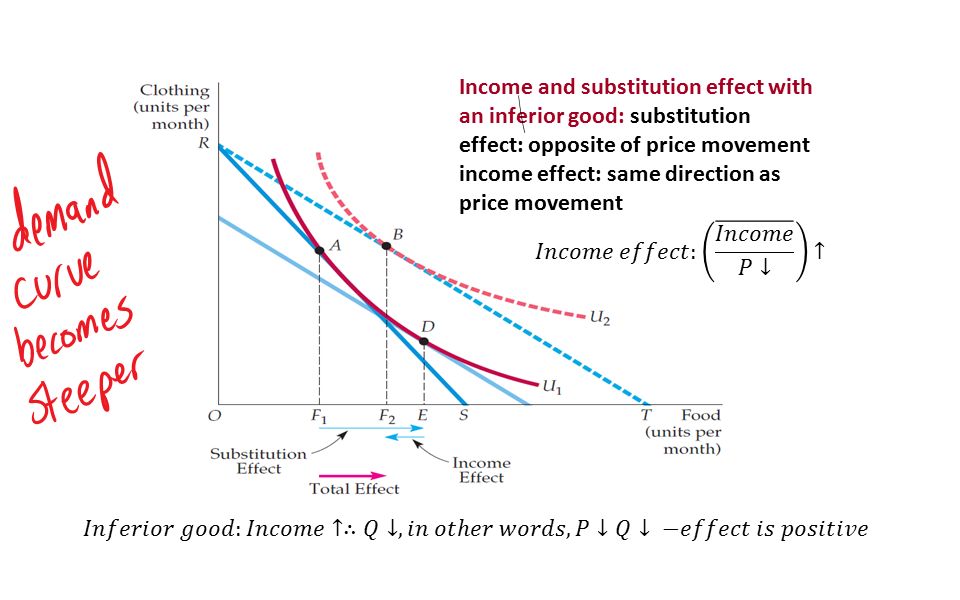
Income and substitution effects: sign of an effect Effect is negative, if price and quantity move in opposite directions; Effect is positive, if price and quantity move in the same direction

6
Income and substitution effect with an inferior good: substitution effect: opposite of price movement income effect: same direction as price movement

7
U1U1 U2U2 E F G Good Y Good X Is good X inferior or normal? Substitution effect Income effect

8
A Giffen Good

9
Giffen good: good for which a decrease in its price causes the quantity demanded to fall Basketball, Tickets per year Movies, Tickets per year L 1 L* Total effect Income effect Substitution effect L 2 e 1 e 2 e* I 1 I 2

10
Upward-Sloping Demand Curve: The Giffen Good When food is an inferior good, and when the income effect is large enough to dominate the substitution effect, the demand curve will be upward-sloping. The consumer is initially at point A, but, after the price of food falls, moves to B and consumes less food. Because the income effect EF 2 is larger than the substitution effect F 1 E, the decrease in the price of food leads to a lower quantity of food demanded. A Special Case: The Giffen Good ●Giffen good Good whose demand curve slopes upward because the income effect is larger than the substitution effect.

12
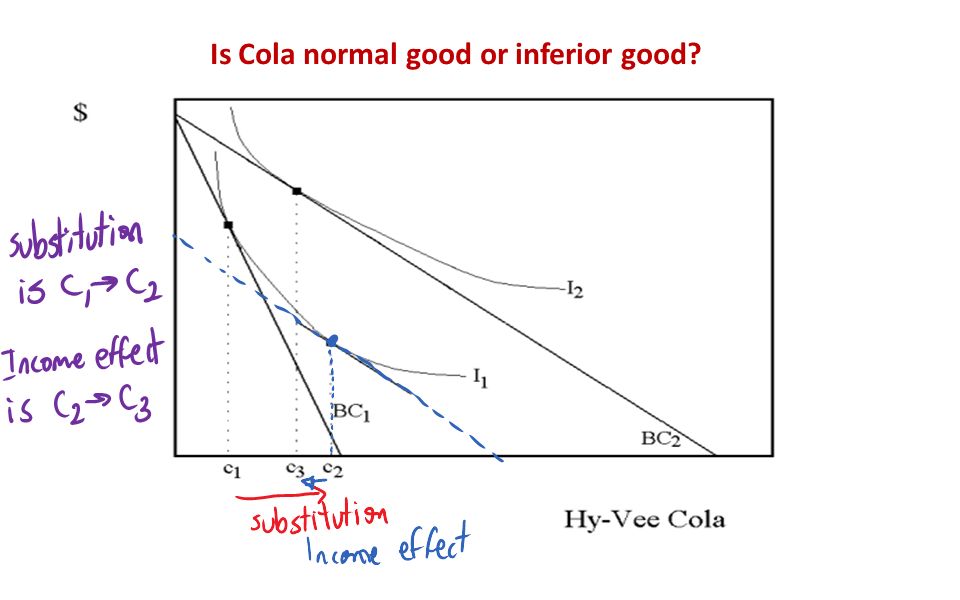
Is Cola normal good or inferior good?

13
True or False

15
Ch. 10: up to p. 231

17
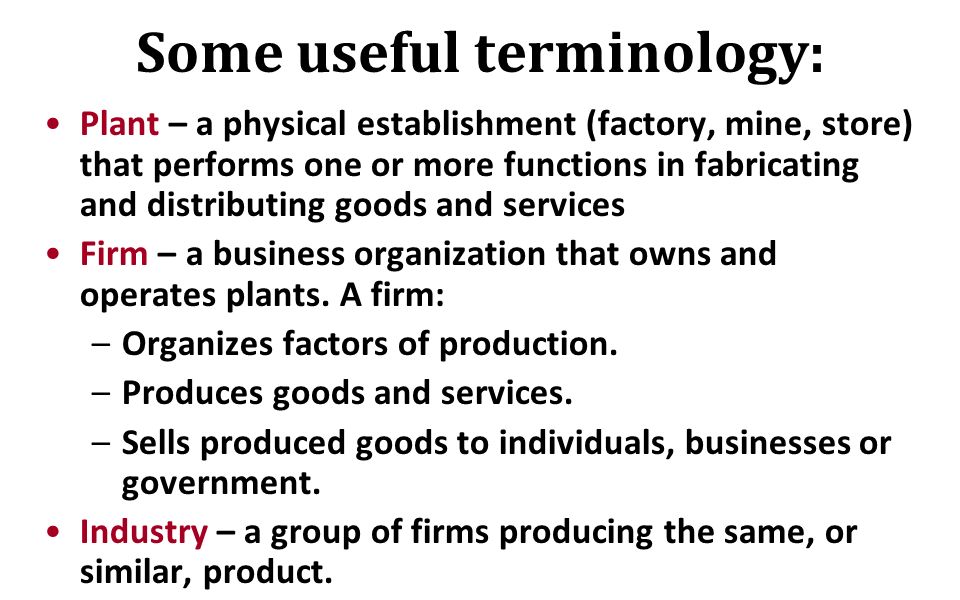
Some useful terminology: Plant – a physical establishment (factory, mine, store) that performs one or more functions in fabricating and distributing goods and services Firm – a business organization that owns and operates plants. A firm: –Organizes factors of production. –Produces goods and services. –Sells produced goods to individuals, businesses or government. Industry – a group of firms producing the same, or similar, product.

18
Firms Maximize Profit Profit is the difference between total revenue and total cost. Profit = Total revenue – Total cost Profit = Total revenue –Economic cost

19
Economic costs ECONOMIC COST of any resource is the value or worth it would have in its best alternative use FIRM’S ECONOMIC COST – those payments a firm must make, or incomes it must provide, to resource suppliers to attract the resources away from alternative production opportunities. Economic costs are the sum of Explicit Costs Money payments a firm must make to non-owners of the firm for the resources they supplied. Implicit Costs Opportunity costs of firm’s own resources or money payments the self-employed resources could have earned in their best alternative use.

Similar presentations


 If a good is a Giffen good, it must be an inferior good A) True B) False Question 2) If a good is an inferior good, it must be a Giffen good.>")


