Download presentation
Presentation is loading. Please wait.

1
Formal Inference Multivariate Internal

3
Introduction This report compares if Auckland or Wellington citizens are more likely to borrow more money. The median house price in Auckland is $720 000 (Apr. 2015)compared with Wellington’s median house price of $411000 (Apr 2015). The population in Auckland is 1.4million as compared to 400 thousand people in Wellington. The data has been sourced from …… It has been rounded to ….. It is believed that the sample is a random selection of Auckland and Wellington citizens. The size of the sample is 100 citizens from each city.
compared with Wellington’s median house price of $ (Apr 2015). The population in Auckland is 1.4million as compared to 400 thousand people in Wellington. The data has been sourced from …… It has been rounded to ….. It is believed that the sample is a random selection of Auckland and Wellington citizens. The size of the sample is 100 citizens from each city..")
4
Analysis

5
Summary stats are missing

6
Analysis The Wellington sample is skewed to the left. There is a group of mortgages in Wellington that fall above $400 000. Auckland’s mortgages are more bell shaped and uniformly spread out. The range for Auckland and Wellington is similar. (Quote the values). However the interquartile range for Wellington is almost twice that of Auckland's. (Quote values) Which means the debt of Aucklanders are more predictable. (A comment about the standard deviation here would be good for M/E students)
. However the interquartile range for Wellington is almost twice that of Auckland s. (Quote values) Which means the debt of Aucklanders are more predictable. (A comment about the standard deviation here would be good for M/E students).")
7
Analysis It is interesting to note that there are no outliers in this data. It would be expected that one or two people from the sample would have a million dollar plus mortgage. The median for Wellington mortgages is above Auckland’s upper quartile for mortgages. 50% of the Wellington’s mortgages are above Auckland’s upper quartile.

8
Analysis

10
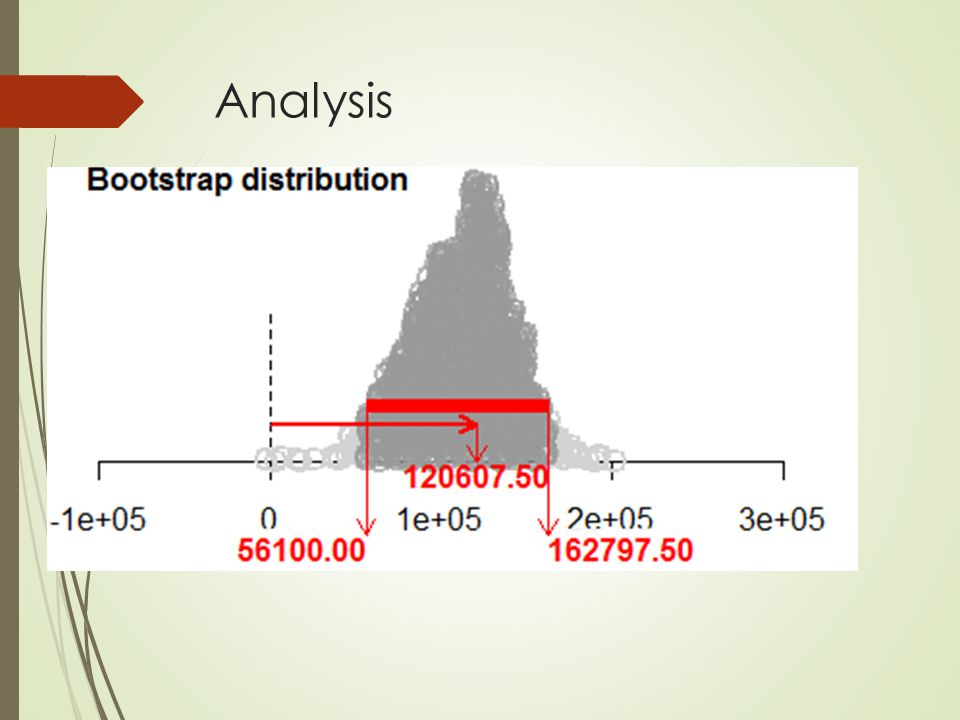
CI Statement It is very likely that the median mortgage for Wellington residence is greater than the median mortgage for Auckland residence. The Bootstrap analysis shows a difference between the medians of between $56000 and $163000. This interval only contains positive values, therefore it is very likely the median mortgages tend to be larger in Wellington, compared with Auckland.

11
Interpretation of the CI This report claims that the median mortgage in Wellington is very likely to be between $56000 and $163000 greater than that of Auckland mortgages.

12
Sampling Variability Discussion From the original sample the difference between the medians is $120 000. If another sample were collected in the same way from the same population it is highly likely the sample medians will not be $120000 apart. By re-sampling with replacement from the original sample 1000 times (Boot Strapping) and plotting the difference between each ‘new’ sample a distribution of possibly differences is constructed. This distribution of possibly differences will be a Normal distribution from which a C.I. can be taken to make a formal inference about the population.
 and plotting the difference between each ‘new’ sample a distribution of possibly differences is constructed. This distribution of possibly differences will be a Normal distribution from which a C.I. can be taken to make a formal inference about the population..")
13
Randomisation

14
Randomisation Analysis In Randomisation analysis I am checking to see if the difference between debt in Wellington and Auckland in my sample could have occurred by chance alone. iNZight randomly re-assigns the categorical data (Auckland and Wellington) and then re-considers the difference between the means. We expect this difference to be approximately zero. We repeat this process 1000 times then look at the distribution. Like when a coin is thrown 1000 times, 500 heads and 500 tails is expected - 400 heads to 600 tails can occur and many other combinations make up a normal distribution. The distribution in the randomisation test gives us an idea of the range of possible outcomes by chance alone. When we compare this distribution with the actual difference between the sample means hopefully this value extends outside the chance along range showing that the difference could not have occurred by chance alone.
 and then re-considers the difference between the means. We expect this difference to be approximately zero. We repeat this process 1000 times then look at the distribution. Like when a coin is thrown 1000 times, 500 heads and 500 tails is expected heads to 600 tails can occur and many other combinations make up a normal distribution. The distribution in the randomisation test gives us an idea of the range of possible outcomes by chance alone. When we compare this distribution with the actual difference between the sample means hopefully this value extends outside the chance along range showing that the difference could not have occurred by chance alone..")
15
Other models / Reflections Bias Data collection method Improvements Translatability Could you have arrived at your conclusion by chance alone?

16
Conclusion Answer your comparison problem giving the correct evidence for your claim. Briefly highlight the key findings from your investigation

Similar presentations


 Bani K. Mallick1 STAT 651 Lecture #15.>")


 Chapter 6 Sampling Distributions and Confidence Interval Estimation.>")


>")


