Download presentation
Presentation is loading. Please wait.

2
Visual representation of data should: Show the data Encourage the reader/viewer to think about the substance of the graph, not the design Avoid distorting what the data has to say When given a large amount of quantitative data, it is most useful to organize it into smaller groups, or classes. One way to do this is to create a Frequency Table

3
Partitions the information into smaller groups (classes) and shows how many data values are in each Classes are constructed so that each data value only falls into one group
 and shows how many data values are in each Classes are constructed so that each data value only falls into one group")
4
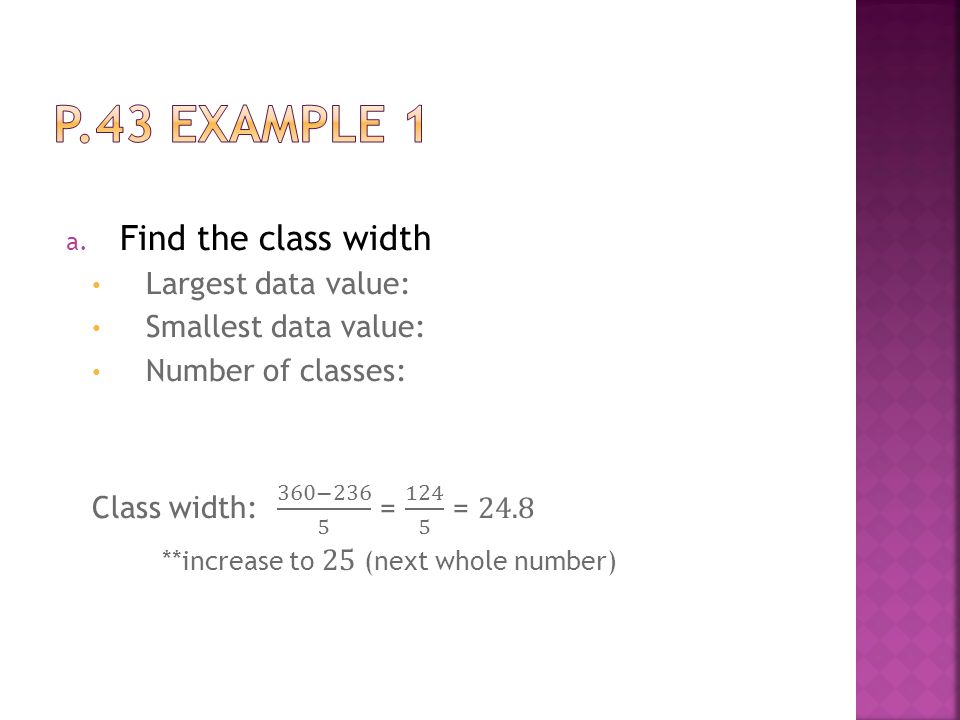
Class width determines how the classes are organized the difference between the lower class limit of one class and the lower class limit of the next class To compute the class width: largest data value — smallest data value desired number of classes then increase the value computed to the next highest whole number

5
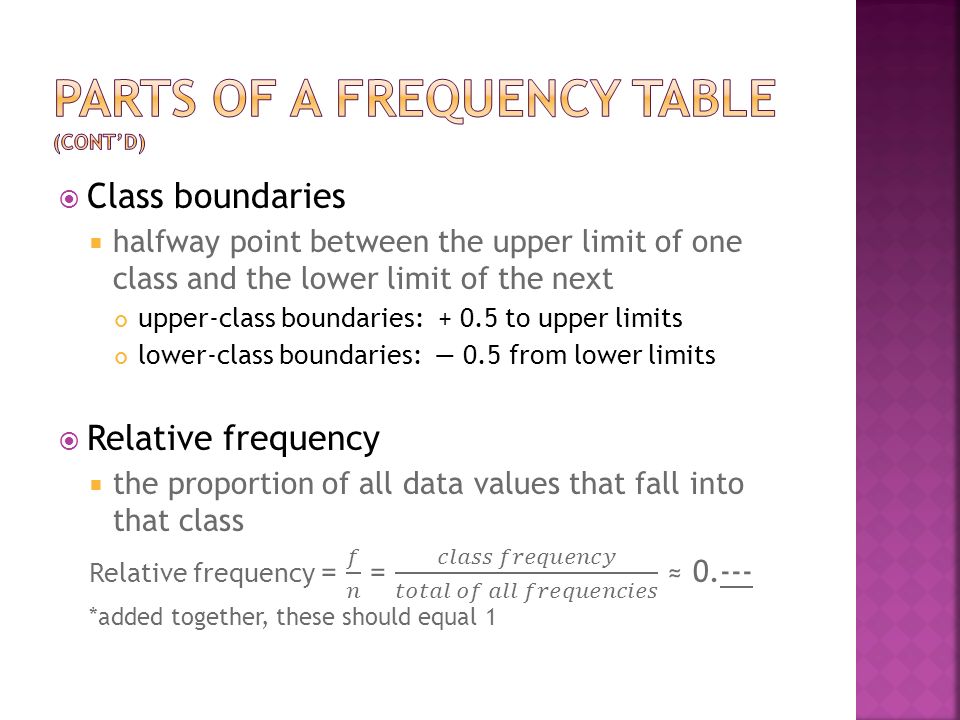
Class limits lower class limit lowest data value that fits in a class upper class limit highest data value that fits in a class one less than the lower class limit of the next class Class frequency the number of tally marks corresponding to that class Class midpoint (class mark) the center of each class; find the average (lower + upper/2)
 the center of each class; find the average (lower + upper/2)")
9
p. 43 – 44 #2 (use 6 classes) and #5 (use 5 classes) Do parts a, b, & c for both
 and #5 (use 5 classes) Do parts a, b, & c for both")
Similar presentations