Download presentation
Presentation is loading. Please wait.

1
Author(s): Brenda Gunderson, Ph.D., 2011 License: Unless otherwise noted, this material is made available under the terms of the Creative Commons Attribution–Non-commercial–Share Alike 3.0 License: http://creativecommons.org/licenses/by-nc-sa/3.0/ We have reviewed this material in accordance with U.S. Copyright Law and have tried to maximize your ability to use, share, and adapt it. The citation key on the following slide provides information about how you may share and adapt this material. Copyright holders of content included in this material should contact open.michigan@umich.edu with any questions, corrections, or clarification regarding the use of content. For more information about how to cite these materials visit http://open.umich.edu/education/about/terms-of-use. Any medical information in this material is intended to inform and educate and is not a tool for self-diagnosis or a replacement for medical evaluation, advice, diagnosis or treatment by a healthcare professional. Please speak to your physician if you have questions about your medical condition. Viewer discretion is advised: Some medical content is graphic and may not be suitable for all viewers.

2
Attribution Key for more information see: http://open.umich.edu/wiki/AttributionPolicy Use + Share + Adapt Make Your Own Assessment Creative Commons – Attribution License Creative Commons – Attribution Share Alike License Creative Commons – Attribution Noncommercial License Creative Commons – Attribution Noncommercial Share Alike License GNU – Free Documentation License Creative Commons – Zero Waiver Public Domain – Ineligible: Works that are ineligible for copyright protection in the U.S. (17 USC § 102(b)) *laws in your jurisdiction may differ Public Domain – Expired: Works that are no longer protected due to an expired copyright term. Public Domain – Government: Works that are produced by the U.S. Government. (17 USC § 105) Public Domain – Self Dedicated: Works that a copyright holder has dedicated to the public domain. Fair Use: Use of works that is determined to be Fair consistent with the U.S. Copyright Act. (17 USC § 107) *laws in your jurisdiction may differ Our determination DOES NOT mean that all uses of this 3rd-party content are Fair Uses and we DO NOT guarantee that your use of the content is Fair. To use this content you should do your own independent analysis to determine whether or not your use will be Fair. { Content the copyright holder, author, or law permits you to use, share and adapt. } { Content Open.Michigan believes can be used, shared, and adapted because it is ineligible for copyright. } { Content Open.Michigan has used under a Fair Use determination. }
) *laws in your jurisdiction may differ Public Domain – Expired: Works that are no longer protected due to an expired copyright term. Public Domain – Government: Works that are produced by the U.S. Government. (17 USC § 105) Public Domain – Self Dedicated: Works that a copyright holder has dedicated to the public domain. Fair Use: Use of works that is determined to be Fair consistent with the U.S. Copyright Act. (17 USC § 107) *laws in your jurisdiction may differ Our determination DOES NOT mean that all uses of this 3rd-party content are Fair Uses and we DO NOT guarantee that your use of the content is Fair. To use this content you should do your own independent analysis to determine whether or not your use will be Fair. { Content the copyright holder, author, or law permits you to use, share and adapt. } { Content Open.Michigan believes can be used, shared, and adapted because it is ineligible for copyright. } { Content Open.Michigan has used under a Fair Use determination. }.")
3
Where are we? Regression Example Exam 2 vs Final Least Squares Regression Line: SSTO = 1300 SSE = 272.1 Exam 2336544646040 Final538078938858

4
The Square of the Correlation r 2 r 2 is always between _________________ Measure total variation in responses as: r 2 = =proportion of total variability in responses that can be explained by the linear relationship with the explanatory variable x. SSTO =

5
Measuring Strength and Direction for Exam 2 vs Final pg 190 SSTO = SSE = Interpretation: We have that ___________% of the variation in _________________can be accounted for by its linear relationship with __________________. Correlation coefficient r = ___________________

6
Cautions about Correlation and Regression Read pages 134 – 136 and 152 – 159 for good examples/ discussion on following topics: Nonlinear relationships Detecting Outliers and their influence on regression results Dangers of Extrapolation (predicting outside the range of your data)
")
7
Cautions about Correlation and Regression Dangers of combining groups inappropriately (Simpson’s Paradox) Correlation does not prove causation
 Correlation does not prove causation")
8
SPSS Regression Analysis for Exam 2 vs Final pg 191

9
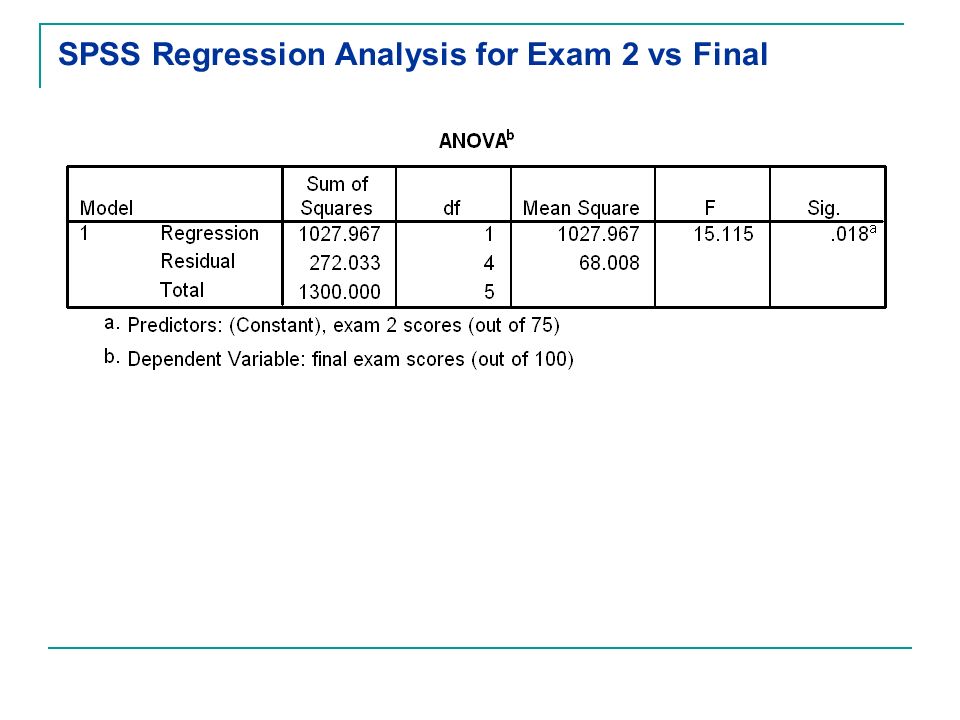
SPSS Regression Analysis for Exam 2 vs Final

11
This will be an important p-value Keep this p-value of 0.018 in mind for your one clicker question …

12
Suppose p-value = 0.018. For which significance levels would the result be statistically significant? Choose all that apply... A) 0.01 B) 0.05 C) 0.10 D) Can’t tell
 0.01 B) 0.05 C) 0.10 D) Can’t tell.")
13
4.Paired or Independent? a.Wish to estimate difference in highway versus city average gas mileage for 2010 cars with automatic transmissions. A random sample of 8 such cars is used and the highway and the city gas mileage is measured … … to create a CI estimate for the population mean difference between highway and city gas mileage for all 2010 cars. A.Paired B.Independent

14
4.Paired or Independent? b.Study to compare two insurance companies on length of stay for pediatric asthma patients. A sample of 300 such cases from Insurer A was selected and a sample of 300 such cases from Insurer B was selected. Length of stay for all 600 cases recorded and used to test if the average length of stay for Insurer A pediatric asthma patients was significantly different from that for Insurer B pediatric asthma patients. A.Paired B.Independent

15
5. Study on service time at Josh’s… is the average time less than 15 minutes? n = 100 service times Assume service times are r.s. from approx normal population. Use 5% significance level. a.State the hypotheses … H 0 : _____________________________ H a : _____________________________

16
5. Study on service time at Josh’s… b.Sample mean is 14 min and standard error of mean is 0.5 min. Compute test statistic (include symbol and value).
..")
17
5. Study on service time at Josh’s… c.Find p-value … show all work.

18
d. Appropriate decision & conclusion? A. Reject H 0, there is insufficient evidence to demonstrate the service time is less than 15 minutes on average. B. Reject H 0, the mean service time is significantly less than 15 minutes. C. Fail to reject H 0, there is insufficient evidence to demonstrate the service time is less than 15 minutes on average. D. Fail to reject H 0, the mean service time is significantly less than 15 minutes.

19
6. Defects – Study to compare defective rates for two machines. 90% CI for differ in popul defect rates (Mach 1 less Mach 2) is (0.01, 0.03). A. The p-value is more than 10%. B. The p-value is less than or equal to 10%. C. There is not enough information to know what the p-value would be. a.Based on CI, what can be said about p-value for testing for a significant difference in defective rates at 10% level? Select one:
 is (0.01, 0.03). A. The p-value is more than 10%. B. The p-value is less than or equal to 10%. C. There is not enough information to know what the p-value would be. a.Based on CI, what can be said about p-value for testing for a significant difference in defective rates at 10% level. Select one:.")
20
6. Defects – Study to compare defective rates for two machines. 90% CI for differ in popul defect rates (Mach 1 less Mach 2) is (0.01, 0.03). b.Complete the sentence: For this study, the sample proportion of defectives for Machine 1 was _______ % higher than that for Machine 2.
 is (0.01, 0.03). b.Complete the sentence: For this study, the sample proportion of defectives for Machine 1 was _______ % higher than that for Machine 2..")
Similar presentations
: Don M. Blumenthal, 2010 License: Unless otherwise noted, this material is made available under the terms of the Attribution – Non-commercial.>")
: Paul Conway, 2008-2010. License: Unless otherwise noted, this material is made available under the terms of the Creative Commons Attribution.>")
: Michael Hortsch, Ph.D., 2010 License: Unless otherwise noted, this material is made available under the terms of the Creative Commons Attribution.>")
: Brenda Gunderson, Ph.D., 2011>")
: Caroline Richardson, M.D., 2009 License: Unless otherwise noted, this material is made available under the terms of the Creative Commons Attribution–Noncommercial–Share.>")
: Brenda Gunderson, Ph.D., 2011 License: Unless otherwise noted, this material is made available under the terms of the Creative Commons Attribution–Non-commercial–Share.>")
: John Doe, MD; Jane Doe, PhD, 2009 License: Unless otherwise noted, this material is made available under the terms of the Creative Commons Attribution.>")
: John Doe, MD; Jane Doe, PhD, 2009 License: Unless otherwise noted, this material is made available under the terms of the Creative Commons Attribution.>")

: Paul Conway, 2008-2010. License: Unless otherwise noted, this material is made available under the terms of the Creative Commons Attribution.>")
: Brenda Gunderson, Ph.D., 2011 License: Unless otherwise noted, this material is made available under the terms of the Creative Commons Attribution–Non-commercial–Alike.>")
: Seetha Monrad, M.D., 2009 License: Unless otherwise noted, this material is made available under the terms of the Creative Commons Attribution–Noncommercial–Share.>")
: University of Michigan Department of Emergency Medicine.>")
: Brenda Gunderson, Ph.D., 2011 License: Unless otherwise noted, this material is made available under the terms of the Creative Commons Attribution–Non-commercial–Share.>")
: Dr. Roy William Mayega (Makerere.>")
: Brenda Gunderson, Ph.D., 2011 License: Unless otherwise noted, this material is made available under the terms of the Creative Commons Attribution–Non-commercial–Share.>")

: MELO 3D Project Team, 2011 License: Unless otherwise noted, this material is made available under the terms of the Creative Commons Attribution.>")

: MELO 3D Project Team, 2011 License: This work is licensed under the Creative Commons Attribution-ShareAlike 3.0 Unported License. To view a.>")