Download presentation
Presentation is loading. Please wait.

1
Crop and Soil Management Issues Related to Forage Cation Levels J.B. Peters, K.A. Kelling, Soil Science Department University of Wisconsin - Madison

2
Influence of pH on Alfalfa, Marshfield 2000

3
Treatments Four K 2 0 levels – 0, 100, 200, 400 lbs K 2 O/a/year * Target pH levels –Marshfield: six levels – 4.8 - 7.3 –Spooner: five levels – 4.7 - 6.7 –Hancock: eight levels – 4.5 - 7.0 * Applied after first cutting

4
Average Tissue P Levels

5
Average Tissue K Levels 3 rd cut, 1999

6
Average Tissue Ca Levels

7
Average Tissue Mg Levels

8
Effect of crushed wallboard and gypsum fertilizer on soil Ca and K levels. Arlington, WI. 1 Ca (ppm) Exchangeable K (ppm) Treatment1995199719951997 Control18751650341285 4 t/acre WB20751913388284 16 t/acre WB33133125330213 50 lb S/acre gypsum19001700320240 LSD.05 415526NS48 gypsum = 65 lbs Ca/acre WB = 320 lbs Ca / ton 1 Treatments applied ppi, Spring 1995.
 Exchangeable K (ppm) Treatment Control t/acre WB t/acre WB lb S/acre gypsum LSD NS48 gypsum = 65 lbs Ca/acre WB = 320 lbs Ca / ton 1 Treatments applied ppi, Spring")
9
Effect of crushed wallboard and gypsum fertilizer on alfalfa tissue cation levels. Arlington, WI, 1995. 1 st Cut TreatmentKCaMg ---------- % ---------- Control4.311.530.50 4 t/acre WB4.381.660.48 16 t/acre WB3.461.550.46 50 lb S/acre gypsum3.701.550.41 Pr > F0.120.830.17 gypsum = 65 lbs Ca/acreWB = 320 lbs Ca / ton

10
Effect of crushed wallboard and gypsum fertilizer on soil Ca and K levels. Lancaster, WI. 1 Ca (ppm) Exchangeable K (ppm) Treatment1995199719951997 Control14501325138196 4 t/acre WB16131462106175 16 t/acre WB2075222599151 50 lb S/acre gypsum14381400105176 LSD.05 184289NS gypsum = 65 lbs Ca/acre WB = 320 lbs Ca / ton 1 Treatments applied ppi, Spring 1995.
 Exchangeable K (ppm) Treatment Control t/acre WB t/acre WB lb S/acre gypsum LSD NS gypsum = 65 lbs Ca/acre WB = 320 lbs Ca / ton 1 Treatments applied ppi, Spring")
11
Effect of crushed wallboard and gypsum fertilizer on alfalfa tissue cation levels. Lancaster, WI, 1995. 1 st Cut TreatmentKCaMg ---------- % ---------- Control4.161.390.39 4 t/acre WB4.321.520.42 16 t/acre WB3.901.490.41 50 lb S/acre gypsum3.821.440.39 Pr > F0.340.010.47 gypsum = 65 lbs Ca/acreWB = 320 lbs Ca / ton

12
Effect of crushed wallboard and gypsum fertilizer on soil Ca and K levels. Spooner, WI. 1 Ca (ppm) Exchangeable K (ppm) Treatment1995199719951997 Control888788171235 4 t/acre WB1150938144269 16 t/acre WB25121563141213 50 lb S/acre gypsum936800156223 LSD.05 60119123NS gypsum = 65 lbs Ca/acre WB = 320 lbs Ca / ton 1 Treatments applied ppi, Spring 1995.
 Exchangeable K (ppm) Treatment Control t/acre WB t/acre WB lb S/acre gypsum LSD NS gypsum = 65 lbs Ca/acre WB = 320 lbs Ca / ton 1 Treatments applied ppi, Spring")
13
Effect of crushed wallboard and gypsum fertilizer on alfalfa tissue cation levels. Spooner, WI, 1996. 1 st Cut TreatmentKCaMg ---------- % ---------- Control3.771.290.28 4 t/acre WB3.571.370.22 16 t/acre WB3.491.450.19 50 lb S/acre gypsum3.571.270.28 Pr > F0.110.01 gypsum = 65 lbs Ca/acreWB = 320 lbs Ca / ton

14
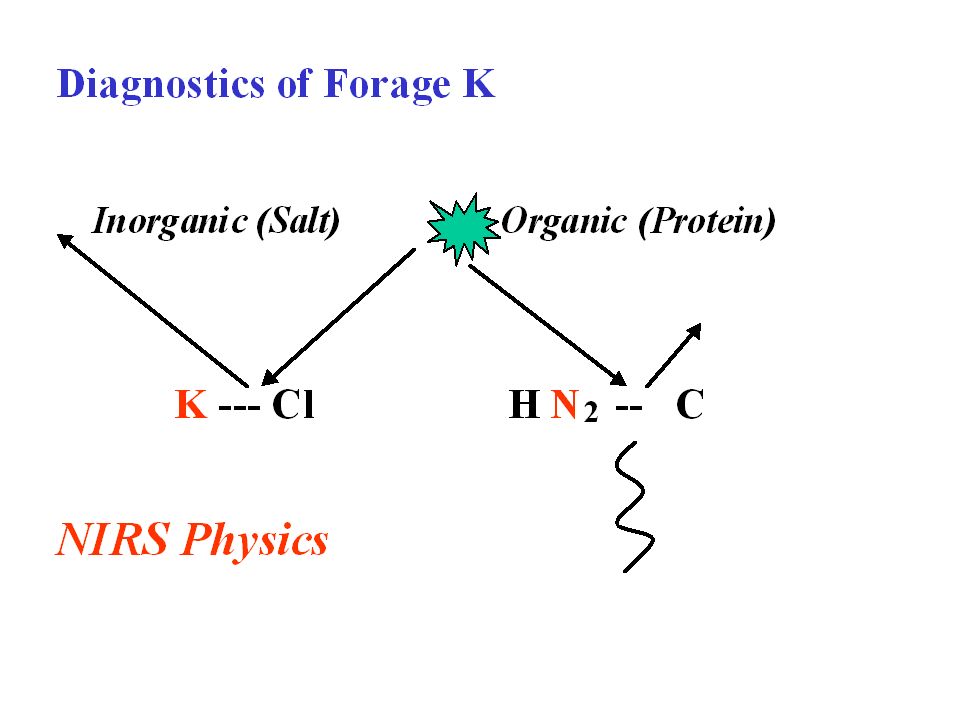
1000 2400 Wavelength (nanometers) Reflectance Light absorption NIRS Concepts
 Reflectance Light absorption NIRS Concepts")
17
Wet chemistry mineral analysis compared to NIR estimation. 3 rd cut, Hancock, 1999. Regression EquationR2R2 P NIR = 0.22 + (0.255)(P WET )0.19 K NIR = 0.98 + (0.579)(K WET )0.58 Ca NIR = 0.55 + (0.891)(Ca WET )0.79 Mg NIR = 0.16 + (0.349)(Mg WET )0.41
(P WET )0.19 K NIR = (0.579)(K WET )0.58 Ca NIR = (0.891)(Ca WET )0.79 Mg NIR = (0.349)(Mg WET )0.41.")
18
Wet chemistry mineral analysis compared to NIR estimation. 3 rd cut, Marshfield, 1999. Regression EquationR2R2 P NIR = 0.29 + (0.056)(P WET )0.01 K NIR = 1.46 + (0.335)(K WET )0.60 Ca NIR = 0.57 + (0.884)(Ca WET )0.67 Mg NIR = 0.21 + (0.325)(Mg WET )0.68
(P WET )0.01 K NIR = (0.335)(K WET )0.60 Ca NIR = (0.884)(Ca WET )0.67 Mg NIR = (0.325)(Mg WET )0.68.")
19
Wet chemistry mineral analysis compared to NIR estimation. 3 rd cut, Spooner, 1999. Regression EquationR2R2 P NIR = 0.26 + (0.068)(P WET )0.01 K NIR = 1.07 + (0.581)(K WET )0.36 Ca NIR = 0.88 + (0.506)(Ca WET )0.59 Mg NIR = 0.16 + (0.457)(Mg WET )0.53
(P WET )0.01 K NIR = (0.581)(K WET )0.36 Ca NIR = (0.506)(Ca WET )0.59 Mg NIR = (0.457)(Mg WET )0.53.")
20
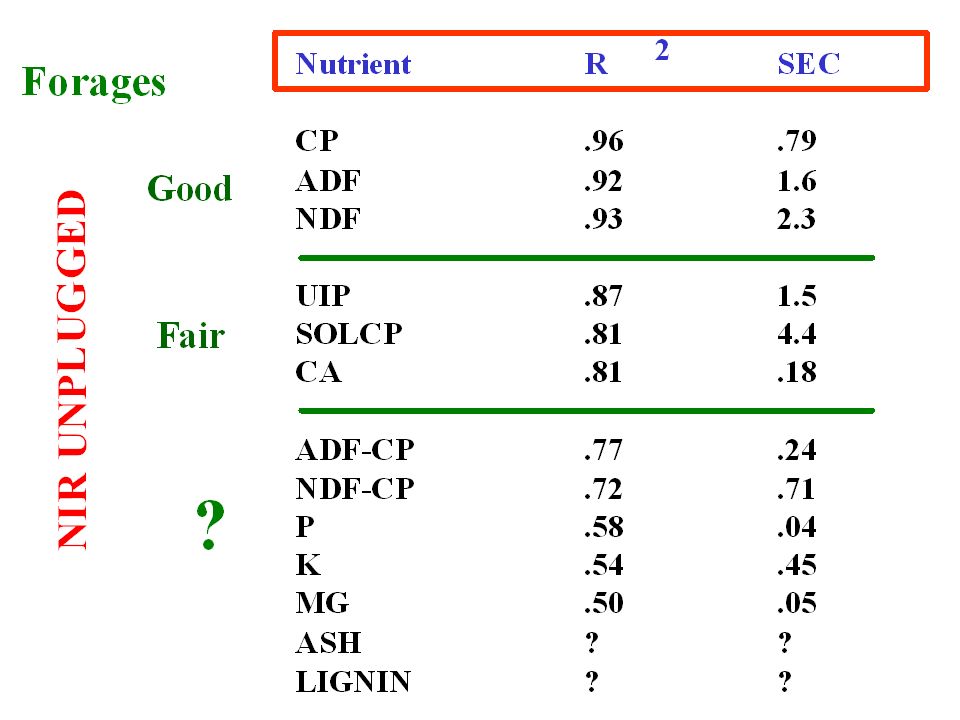
Using NIRS in Forage Testing General Recommendations General Nutrients DMyesLigninlimited CPyesAshlimited ADFyesCalimited NDFyesPno StarchyesKno FatyesMgno Bypass CP yesMiroMinno Soluble CPlimited ADF-CPlimited NDF-CPlimited

21
Summary Liming these acid soils was essential to optimize DM production, irregardless of K As soil K increased, tissue K increased and tissue Ca and Mg tended to decrease Annual applications of K resulted in a buildup of soil K and a decrease in soil test Ca and Mg

22
Summary, cont. As soil Ca increased, tissue K levels tended to decrease and tissue Ca tended to increase, especially on the lighter textured soil at Spooner Large applications of Ca resulted in a buildup of soil Ca and a decrease in soil test K

23
Summary, cont. Keeping soil test K levels in the optimum range appears to be the best strategy for keeping tissue K levels in acceptable ranges for use as dairy feed

Similar presentations


 and Dairy Cow Requirements Jim Linn, PhD Professor Emeritus – University of Minnesota Milk Specialties.>")


 463-4734>")


>")
