Download presentation
Presentation is loading. Please wait.

1
Spectral Algorithms for Learning and Clustering Santosh Vempala Georgia Tech

2
Thanks to: Nina Balcan Avrim Blum Charlie Brubaker David Cheng Amit Deshpande Petros Drineas Alan Frieze Ravi Kannan Luis Rademacher Adrian Vetta V. Vinay Grant Wang

3
Warning This is the speaker’s first hour-long computer talk --- viewer discretion advised.

4
“Spectral Algorithm”?? Input is a matrix or a tensor Algorithm uses singular values/vectors (or principal components) of the input. Does something interesting!
 of the input. Does something interesting!.")
5
Spectral Methods Indexing, e.g., LSI Embeddings, e.g., CdeV parameter Combinatorial Optimization, e.g., max-cut in dense graphs, planted clique/partition problems A course at Georgia Tech this Fall will be online and more comprehensive!

6
Two problems Learn a mixture of Gaussians Classify a sample Cluster from pairwise similarities

7
Singular Value Decomposition Real m x n matrix A can be decomposed as:

8
SVD in geometric terms Rank-1 approximation is the projection to the line through the origin that minimizes the sum of squared distances. Rank-k approximation is projection to k-dimensional subspace that minimizes sum of squared distances.

9
Fast SVD/PCA with sampling [Frieze-Kannan-V. ‘98] Sample a “constant” number of rows/colums of input matrix. SVD of sample approximates top components of SVD of full matrix. [Drineas-F-K-V-Vinay] [Achlioptas-McSherry] [D-K-Mahoney] [Deshpande-Rademacher-V-Wang] [Har-Peled] [Arora, Hazan, Kale] [De-V] [Sarlos] … Fast (nearly linear time) SVD/PCA appears practical for massive data.
 SVD/PCA appears practical for massive data..")
10
Mixture models Easy to unravel if components are far enough apart Impossible if components are too close

11
Distance-based classification How far apart? Thus, suffices to have [Dasgupta ‘99] [Dasgupta, Schulman ‘00] [Arora, Kannan ‘01] (more general)
.")
12
Hmm… Random Projection anyone? Project to a random low-dimensional subspace n k ||X’-Y’|| ||X-Y|| || || No improvement!

13
Spectral Projection Project to span of top k principal components of the data Replace A with A = Apply distance-based classification in this subspace

14
Guarantee Theorem [V-Wang ’02]. Let F be a mixture of k spherical Gaussians with means separated as Then probability 1-, the Spectral Algorithm correctly classifies m samples.
![Guarantee Theorem [V-Wang ’02].](http://images.slideplayer.com/25/7920263/slides/slide_14.jpg "Let F be a mixture of k spherical Gaussians with means separated as Then probability 1-, the Spectral Algorithm correctly classifies m samples..")
15
Main idea Subspace of top k principal components (SVD subspace) spans the means of all k Gaussians
 spans the means of all k Gaussians")
16
SVD in geometric terms Rank 1 approximation is the projection to the line through the origin that minimizes the sum of squared distances. Rank k approximation is projection k-dimensional subspace minimizing sum of squared distances.

17
Why? Best line for 1 Gaussian? - line through the mean Best k-subspace for 1 Gaussian? - any k-subspace through the mean Best k-subspace for k Gaussians? - the k-subspace through all k means!

18
How general is this? Theorem[VW’02]. For any mixture of weakly isotropic distributions, the best k-subspace is the span of the means of the k components. Covariance matrix = multiple of identity
![How general is this. Theorem[VW’02].](http://images.slideplayer.com/25/7920263/slides/slide_18.jpg "For any mixture of weakly isotropic distributions, the best k-subspace is the span of the means of the k components. Covariance matrix = multiple of identity.")
19
Sample SVD Sample SVD subspace is “close” to mixture’s SVD subspace. Doesn’t span means but is close to them.

20
2 Gaussians in 20 dimensions

21
4 Gaussians in 49 dimensions

22
Mixtures of logconcave distributions Theorem [Kannan, Salmasian, V, ‘04]. For any mixture of k distributions with SVD subspace V,
![Mixtures of logconcave distributions Theorem [Kannan, Salmasian, V, ‘04].](http://images.slideplayer.com/25/7920263/slides/slide_22.jpg "For any mixture of k distributions with SVD subspace V,.")
23
Questions 1.Can Gaussians separable by hyperplanes be learned in polytime? 2.Can Gaussian mixture densities be learned in polytime? [Feldman, O’Donell, Servedio]

24
Clustering from pairwise similarities Input: A set of objects and a (possibly implicit) function on pairs of objects. Output: 1.A flat clustering, i.e., a partition of the set 2.A hierarchical clustering 3.(A weighted list of features for each cluster)
.")
25
Typical approach Optimize a “natural” objective function E.g., k-means, min-sum, min-diameter etc. Using EM/local search (widely used) OR a provable approximation algorithm Issues: quality, efficiency, validity. Reasonable functions are NP-hard to optimize
 OR a provable approximation algorithm Issues: quality, efficiency, validity. Reasonable functions are NP-hard to optimize.")
26
Divide and Merge Recursively partition the graph induced by the pairwise function to obtain a tree Find an “optimal” tree-respecting clustering Rationale: Easier to optimize over trees; k-means, k-median, correlation clustering all solvable quickly with dynamic programming

27
Divide and Merge

28
How to cut? Min cut? (in weighted similarity graph) Min conductance cut [Jerrum-Sinclair] Sparsest cut [Alon], Normalized cut [Shi-Malik] Many applications: analysis of Markov chains, pseudorandom generators, error-correcting codes...
 Min conductance cut [Jerrum-Sinclair] Sparsest cut [Alon], Normalized cut [Shi-Malik] Many applications: analysis of Markov chains, pseudorandom generators, error-correcting codes....")
29
How to cut? Min conductance/expansion is NP-hard to compute. -Leighton-Rao Arora-Rao-Vazirani -Fiedler cut: Minimum of n-1 cuts when vertices are arranged according to component in 2 nd largest eigenvector of similarity matrix.

30
Worst-case guarantees Suppose we can find a cut of conductance at most A.C where C is the minimum. Theorem [Kannan-V.-Vetta ’00]. If there exists an ( )-clustering, then the algorithm is guaranteed to find a clustering of quality
-clustering, then the algorithm is guaranteed to find a clustering of quality.")
31
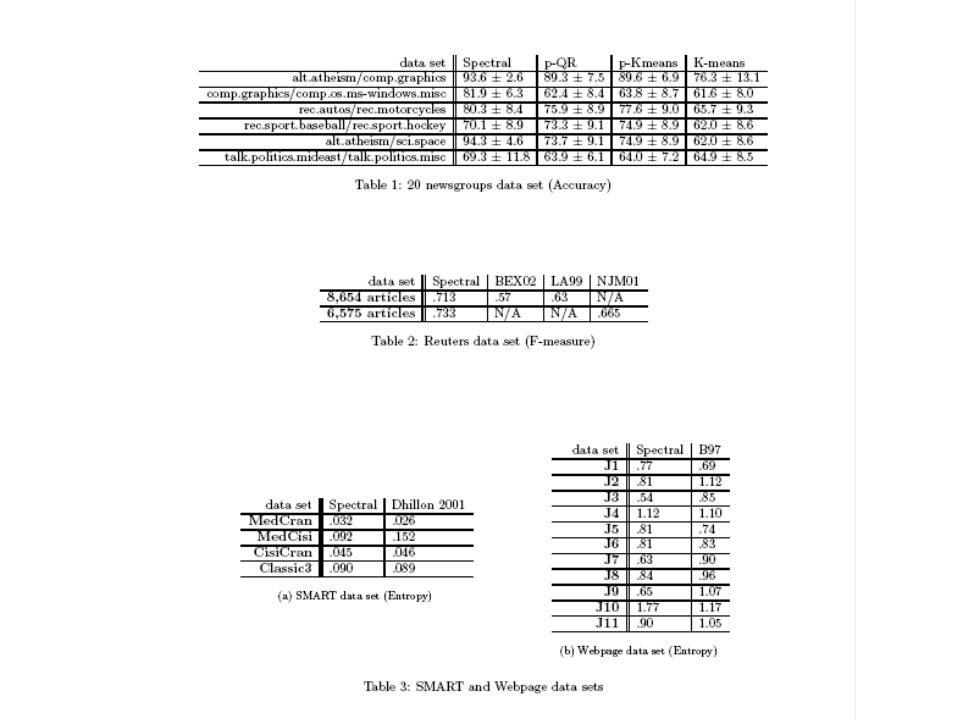
Experimental evaluation Evaluation on data sets where true clusters are known Reuters, 20 newsgroups, KDD UCI data, etc. Test how well algorithm does in recovering true clusters – look an entropy of clusters found with respect to true labels. Question 1: Is the tree any good? Question 2: How does the best partition (that matches true clusters) compare to one that optimizes some objective function?
 compare to one that optimizes some objective function .")
33
Cluster 44: [938] 64.82%: "Antidiabetic Agents, Misc.". 51.49%: Ace Inhibitors & Comb.. 49.25%: Sulfonylureas. 48.40%: Antihyperlipidemic Drugs. 36.35%: Blood Glucose Test Supplies. 23.24%: Non-Steroid/Anti-Inflam. Agent. 22.60%: Beta Blockers & Comb.. 20.90%: Calcium Channel Blockers&Comb.. 19.40%: Insulins. 17.91%: Antidepressants. Cluster 97: [111] 100.00%: Mental Health/Substance Abuse. 58.56%: Depression. 46.85%: X-ray. 36.04%: Neurotic and Personality Disorders. 32.43%: Year 3 cost - year 2 cost. 28.83%: Antidepressants. 21.62%: Durable Medical Equipment. 21.62%: Psychoses. 14.41%: Subsequent Hospital Care. 8.11%: Tranquilizers/Antipsychotics. Cluster 48: [39] 94.87%: Cardiography - includes stress testing. 69.23%: Nuclear Medicine. 66.67%: CAD. 61.54%: Chest Pain. 48.72%: Cardiology - Ultrasound/Doppler. 41.03%: X-ray. 35.90%: Other Diag Radiology. 28.21%: Cardiac Cath Procedures 25.64%: Abnormal Lab and Radiology. 20.51%: Dysrhythmias. Clustering medical records Medical records: patient records (> 1 million) with symptoms, procedures & drugs Goals: predict cost/risk, discover relationships between different conditions, flag at-risk patients etc.. [Bertsimas, Bjarnodottir, Kryder, Pandey, V, Wang]
![Cluster 44: [938] 64.82%: Antidiabetic Agents, Misc. .](http://images.slideplayer.com/25/7920263/slides/slide_33.jpg "51.49%: Ace Inhibitors & Comb %: Sulfonylureas %: Antihyperlipidemic Drugs %: Blood Glucose Test Supplies %: Non-Steroid/Anti-Inflam. Agent %: Beta Blockers & Comb %: Calcium Channel Blockers&Comb %: Insulins %: Antidepressants. Cluster 97: [111] %: Mental Health/Substance Abuse %: Depression %: X-ray %: Neurotic and Personality Disorders %: Year 3 cost - year 2 cost %: Antidepressants %: Durable Medical Equipment %: Psychoses %: Subsequent Hospital Care. 8.11%: Tranquilizers/Antipsychotics. Cluster 48: [39] 94.87%: Cardiography - includes stress testing %: Nuclear Medicine %: CAD %: Chest Pain %: Cardiology - Ultrasound/Doppler %: X-ray %: Other Diag Radiology %: Cardiac Cath Procedures 25.64%: Abnormal Lab and Radiology %: Dysrhythmias. Clustering medical records Medical records: patient records (> 1 million) with symptoms, procedures & drugs Goals: predict cost/risk, discover relationships between different conditions, flag at-risk patients etc.. [Bertsimas, Bjarnodottir, Kryder, Pandey, V, Wang].")
34
Other domains Clustering genes of different species to discover orthologs – genes performing similar tasks across species. –(current work by R. Singh, MIT) EigenclusterEigencluster to cluster search results Compare to GoogleGoogle [Cheng, Kannan,Vempala,Wang]
 EigenclusterEigencluster to cluster search results Compare to GoogleGoogle [Cheng, Kannan,Vempala,Wang].")
35
Future of clustering? Move away from explicit objective functions? E.g., feedback models, similarity functions [Balcan, Blum] Efficient regularity-style quasi-random clustering: partition into a small number of pieces so that edges between pairs appear random Tensor Clustering: using relationships of small subsets ?!

36
Spectral Methods Indexing, e.g., LSI Embeddings, e.g., CdeV parameter Combinatorial Optimization, e.g., max-cut in dense graphs, planted clique/partition problems A course at Georgia Tech this Fall will be online and more comprehensive!

Similar presentations


 Dimensionality Reductions or data projections Random projections.>")

 for Clustering Gene Expression Data K. Y. Yeung and W. L. Ruzzo.>")


 edge (u,v) denotes similarity between u and v weighted.>")


