Download presentation
Presentation is loading. Please wait.

1
HEFPA Paper Digest I Supon Limwattananon

2
WP2 WP1

7
Health shocks - Labor supply - Income (earned and unearned) - Medical spending Food consumption Non-food consumption - Health insurance - Coping methods: - Saving - Gift - Borrowing/loan - Asset - Social insurance/security - Informal solidarity Consumption insurance Financial risks
 - Medical spending Food consumption Non-food consumption - Health insurance - Coping methods: - Saving - Gift - Borrowing/loan - Asset - Social insurance/security - Informal solidarity Consumption insurance Financial risks")
8
Paper 3

9
Which kind of insurance can protect welfare loss? For common minor illnesses vs. for unanticipated major illnesses First-dollar coverage with low capped benefits vs. catastrophic insurance with patient cost-sharing 1 1 Townsend (1995); Kochar (1995) found families in LICs were able to insure illness shocks fairly well.
; Kochar (1995) found families in LICs were able to insure illness shocks fairly well..")
10
Objective

11
Findings Section III: Section IV:

12
Panel data

13
Fixed-effects model

14
(1) ADLs vs. (2) Self-reported illness symptoms Symptom lasting > 1 mo. Any symptom 1. 2.1 2.2 1.1 1.2 mean (SD) % mean (SD) h ij
 % mean (SD) h ij.")
15
Problems on self-reported illnesses

16
L ij 3. 2. 1.1 1.2 X ij Labor supply /wk This has to be imputed for informal sectors per wk (C/n) ij
 ij.")
17
h ij X ij L ij (1.1) 2.1 2.2 1. per wk Section III
 per wk Section III")
18
h ij 2.1 2.2 1. L ij 1.1 1.2 2. 3. per wk Interpretation: Moving from being able to perform all ADLs to being able to perform none would result in - lowering hours of work by 30.9 hours per week (84% of baseline mean hours) - 73.8% likelihood of becoming labor-force nonparticipant - a reduction of earnings by Rp.20,170 (~ baseline mean earnings) - an increase in medical spending of Rp.1,180
 % likelihood of becoming labor-force nonparticipant - a reduction of earnings by Rp.20,170 (~ baseline mean earnings) - an increase in medical spending of Rp.1,180.")
19
Section III

20
Section IV: Consumption insurance

21
ln(C/n) ij h ij X ij 2.1 2.2 1. Moving from being able to perform all ADLs to being able to perform none would lower consumption by 19.5%

22
Section IV

23
Section V: The extent to which households are able to insure consumption Biased est.: For each Rp. that income falls, consumption falls by only 3% Unbiased est.: For each Rp. that income falls, consumption falls by 35% Households are able to insure only 65% of the consumption with respect to income loss due to a loss in ADL

24
Instrument Variable (IV) Y = 1 + 1 h + Z 1 + 1 C = 2 + 2 + X 2 + 2 Predicted Y as an instrument Step 1. Income Step 2. Consumption C = 0 + 0 Y + X 0 + 0 OLS method Y is endogenous: some unobserved variables affect both Y and C. Hence, Is biased (change in Y affecting change in C is spurious). Consumption: IV method
. Consumption: IV method.")
25
Paper 4

26
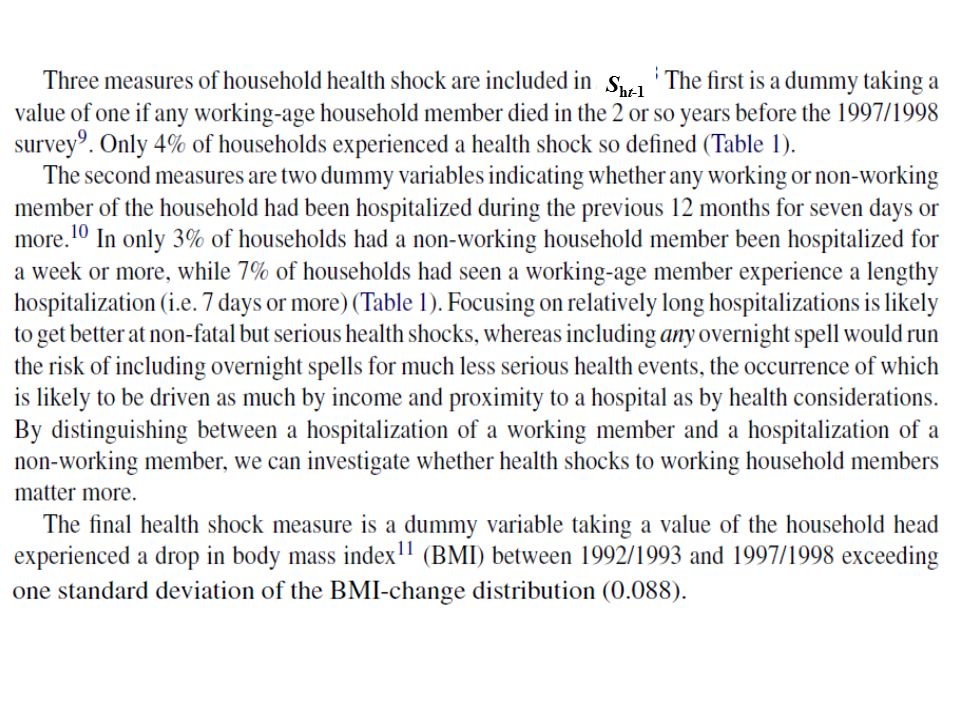
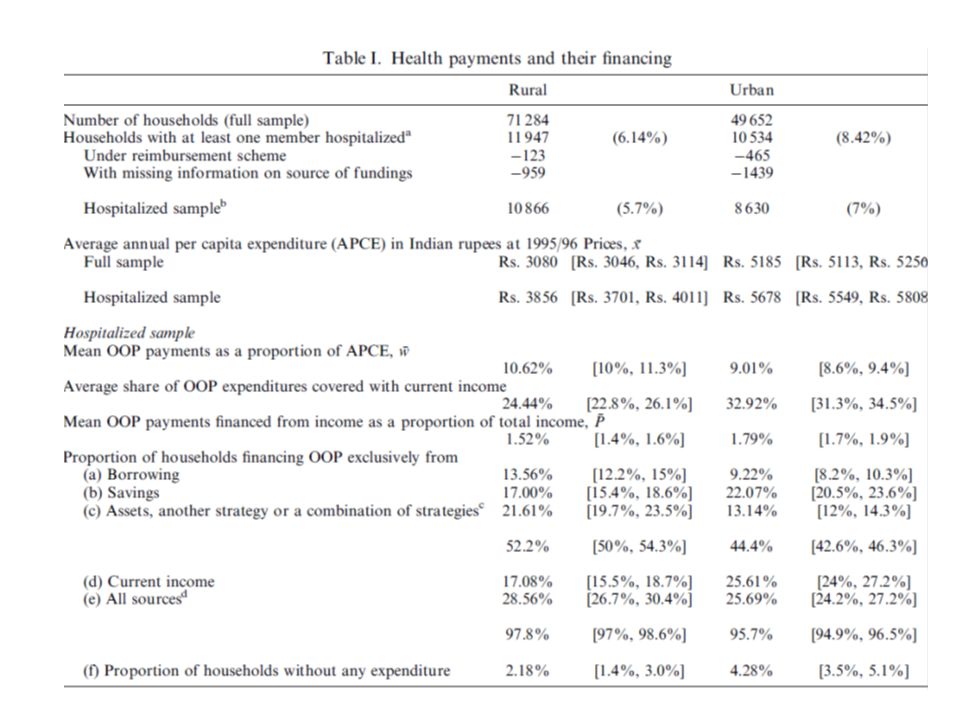
S ht-1

28
1.1 1.2 1. 2. 3.1 3.2 ln y ht 1. 2.1 2.2 3. S ht-1 XhtXht e.g., gift, remittance, pension, compensation e.g., wage/salary, agriculture, family business esp., direct, nonmedical costs of care

29
yhtyht

30
Rural Urban Effects on income per household An urban household’s earned income is more vulnerable to death shocks than an rural household’s. Statistically non-significant Regression coefficient and (t-statistics) Statistically non-significant An increase in unearned income offsets a decrease in earned income; whereby other-than death shocks in urban area are larger than in rural area.
 Statistically non-significant An increase in unearned income offsets a decrease in earned income; whereby other-than death shocks in urban area are larger than in rural area..")
31
Urban Rural Effects on income per capita Effect of a death on per capita income Is statistically non-significant and is less than on household income.

32
Effects on medical expenditure (1) Urban Rural
 Urban Rural")
33
Effects on medical expenditure (2) Insured Uninsured
 Insured Uninsured")
34
Effects on food consumption Rural Urban Households cannot smooth their food consumption in the face of some health shocks!

35
Effects on non-food/non-medical consumption Urban Rural The evidence is more mixed!

36
Pr (y>0) E[ y| y>0] (Housing)
![Pr (y>0) E[ y| y>0] (Housing)](http://images.slideplayer.com/25/7905478/slides/slide_36.jpg "Pr (y>0) E[ y| y>0] (Housing)")
37
Health shocks Year 2004-05 (wave 1: N = 5,673) Year 2005-06 (wave 2: N = 5,495) % Dead: Any HH members0% 2.3% % Ill: Any HH members57.0%53.8% % Ill: HH head37.8%35.1% % Ill: Other than head19.1%18.7% % Ill: Working member43.4%40.7% % Hospitalized: Any HH members21.3%NA % Hospitalized: HH head10.3%NA % Hospitalized: Other than head11.0%NA % Hospitalized: Working member14.7%NA
 Year (wave 2: N = 5,495) % Dead: Any HH members0% 2.3% % Ill: Any HH members57.0%53.8% % Ill: HH head37.8%35.1% % Ill: Other than head19.1%18.7% % Ill: Working member43.4%40.7% % Hospitalized: Any HH members21.3%NA % Hospitalized: HH head10.3%NA % Hospitalized: Other than head11.0%NA % Hospitalized: Working member14.7%NA")
38
Economic consequences Year 2005-06 (wave 2) Year 2006-07 (wave 3) Mean Unearned income (Baht) 911 992 Mean Earned income (Baht) 4,357 4,664 Mean Total income (Baht) 5,269 5,656 % Catastrophic health exp. (>10% total exp.)3.3% % Positive health exp.57.3%51.0% Mean Health exp. (Baht), given positive 98 104 Mean Food expenditure (Baht) 1,173 1,260 Mean Nonfood/non-health exp. (Baht) 1,867 2,186 % Positive education exp.56.2%55.8% Mean Education exp. (Baht), given positive 269 289
3.3% % Positive health exp.57.3%51.0% Mean Health exp. (Baht), given positive Mean Food expenditure (Baht) 1,173 1,260 Mean Nonfood/non-health exp. (Baht) 1,867 2,186 % Positive education exp.56.2%55.8% Mean Education exp. (Baht), given positive")
39
Covariates for adjustment Year 2006Year 2007 % Urban 29.1%31.7% % Rural 70.9%68.3% % Bangkok 15.8%17.1% % Central 16.9%17.4% % North 19.1%19.4% % Northeast 35.2%35.0% % South 12.9%11.1% Mean Age (years) 51.551.8 % Male 70.1% % Couple 73.9%75.2% % Primary educated 73.9%71.2% % Secondary educated 14.2%15.2% % Higher educated11.8%13.6% Household head
 % Male 70.1% % Couple 73.9%75.2% % Primary educated 73.9%71.2% % Secondary educated 14.2%15.2% % Higher educated11.8%13.6% Household head")
40
Effect on per capita income Thailand –whole country Health shock UnearnedEarnedTotal Dead: Any HH members 0.778-0.3330.053 Ill: Any HH members0.5560.2590.073 Ill: HH head0.5750.3010.208 Ill: Other than head0.040-0.027-0.175 Ill: Working member0.3570.1430.083 Hospitalized: Any HH members0.4880.0970.223 Hospitalized: HH head0.641-0.2010.219 Hospitalized: Other than head0.2350.3550.176 Hospitalized: Working member0.380-0.0200.184

41
Effect on per capita income Thailand –urban vs. rural Health shock UnearnedEarnedTotal Dead: Any HH members 0.745-0.943-0.393 Hospitalized: Any HH members0.652-0.153-0.037 Hospitalized: HH head0.536-0.4380.017 Hospitalized: Other than head0.6170.142-0.078 Hospitalized: Working member0.280-0.118-0.027 Dead: Any HH members 0.751-0.1060.177 Hospitalized: Any HH members0.4480.1830.334 Hospitalized: HH head0.698-0.1390.289 Hospitalized: Other than head0.1080.4440.299 Hospitalized: Working member0.414-0.0230.233 Rural Urban

42
Effect on per capita health spending (W2) Thailand –whole country Health shock (W1) Catast. exp. Positive exp. Exp. if positive Overall exp. Ill: Any HH members0.0090.0880.1360.767 Ill: HH head0.0070.0700.1080.611 Ill: Other than head0.0040.0340.0460.302 Ill: Working member0.0110.0890.1350.775 Hospitalized: Any HH members0.0170.0530.1540.517 Hospitalized: HH head0.0170.0520.2080.528 Hospitalized: Other than head0.0140.0420.0660.390 Hospitalized: Working member0.0180.0490.1700.488

43
Effect on per capita health spending (W2) Thailand –urban vs. rural Health shock (W1) Catast. exp. Positive exp. Exp. if positive Overall exp. Hospitalized: Any HH members 0.0200.0390.2270.478 Hospitalized: HH head 0.0260.0240.3060.407 Hospitalized: Other than head 0.0090.0440.1070.439 Hospitalized: Working member 0.0030.0150.0700.176 Hospitalized: Any HH members 0.0170.0580.1300.530 Hospitalized: HH head 0.0130.0620.1740.569 Hospitalized: Other than head 0.0160.0420.0540.371 Hospitalized: Working member 0.0230.0590.2080.580 Rural Urban
 Catast. exp. Positive exp. Exp. if positive Overall exp. Hospitalized: Any HH members Hospitalized: HH head Hospitalized: Other than head Hospitalized: Working member Hospitalized: Any HH members Hospitalized: HH head Hospitalized: Other than head Hospitalized: Working member Rural Urban.")
44
Effect on per capita health spending (W3) Thailand –CS vs. SS vs. UC Health shock (W2) Catast. exp. Positive exp. Exp. if positive Overall exp. Ill: Any HH members 0.0240.1220.2101.092 Ill: HH head 0.00070.0420.2130.435 Ill: Any HH members 0.0170.0700.1670.655 Ill: HH head 0.0040.0700.1820.627 Ill: Any HH members 0.0160.0680.2920.695 Ill: HH head 0.0180.0470.3260.549 UC SS CS
 Catast. exp. Positive exp. Exp. if positive Overall exp. Ill: Any HH members Ill: HH head Ill: Any HH members Ill: HH head Ill: Any HH members Ill: HH head UC SS CS.")
45
Effect on per capita non-health spending Thailand –whole country Health shock FoodNonfood Dead: Any HH members-0.1240.216 Ill: Any HH members-0.0300.005 Ill: HH head0.0260.059 Ill: Other than head-0.079-0.073 Ill: Working member-0.00040.062 Hospitalized: Any HH members-0.098-0.073 Hospitalized: HH head-0.058-0.009 Hospitalized: Other than head-0.114-0.116 Hospitalized: Working member-0.0800.005

46
Effect on per capita non-health spending Thailand –urban vs. rural Health shock FoodNonfood Dead: Any HH members-0.115-0.324 Hospitalized: Any HH members-0.104-0.215 Hospitalized: HH head0.024-0.099 Hospitalized: Other than head-0.198-0.275 Hospitalized: Working member-0.032-0.083 Dead: Any HH members-0.1200.415 Hospitalized: Any HH members-0.100-0.026 Hospitalized: HH head-0.0900.017 Hospitalized: Other than head-0.086-0.060 Hospitalized: Working member-0.0990.029 Rural Urban

47
Effect on per capita education spending Thailand –whole country Health shock Positive exp. Exp. if positive Overall exp. Dead: Any HH members-0.043-0.164-0.432 Ill: Any HH members-0.0260.028-0.214 Ill: HH head-0.0360.057-0.304 Ill: Other than head0.012-0.0290.098 Ill: Working member-0.0570.062-0.465 Hospitalized: Any HH members-0.024-0.057-0.248 Hospitalized: HH head-0.0260.063-0.198 Hospitalized: Other than head-0.017-0.144-0.239 Hospitalized: Working member-0.0480.070-0.385

48
Effect on per capita education spending Thailand –urban vs. rural Health shock Positive exp. Exp. if positive Overall exp. Dead: Any HH members-0.045-0.426-0.608 Hospitalized: Any HH members-0.073-0.318-0.832 Hospitalized: HH head-0.058-0.236-0.614 Hospitalized: Other than head-0.072-0.331-0.852 Hospitalized: Working member-0.098-0.149-0.991 Dead: Any HH members-0.039-0.109-0.345 Hospitalized: Any HH members-0.0070.020-0.037 Hospitalized: HH head-0.0140.147-0.052 Hospitalized: Other than head0.002-0.089-0.015 Hospitalized: Working member-0.0290.129-0.166 Rural Urban

49
VHLSS (Vietnam Household Living Standards Survey) Coping Strategies Source: VHLSS 2006 Report
 Coping Strategies Source: VHLSS 2006 Report")
50
Paper 5

51
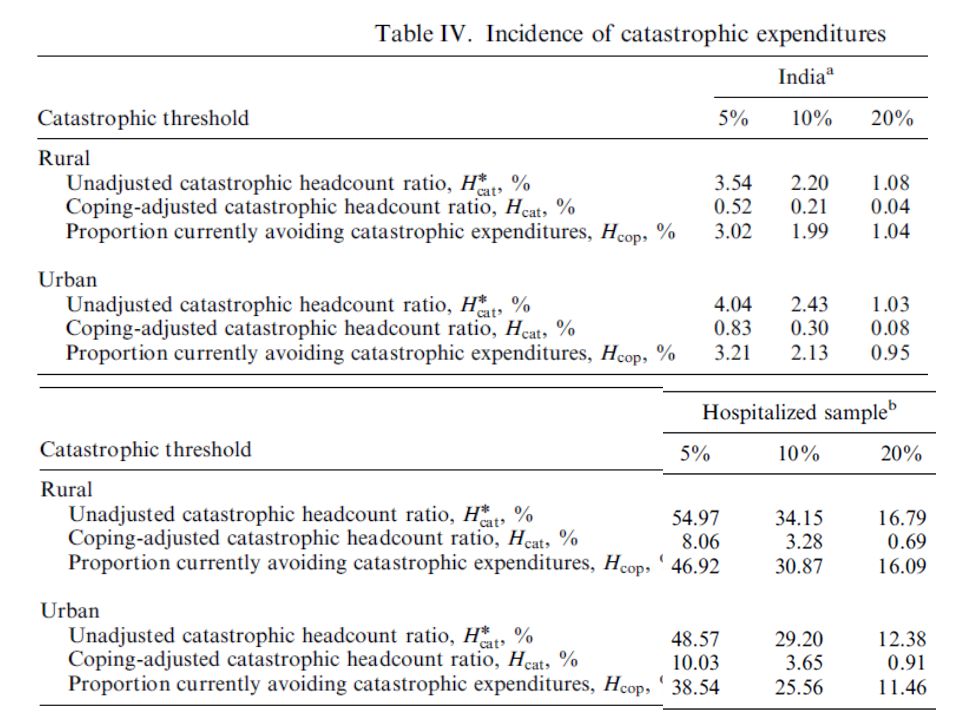
(coping strategies) C = 2,580/2,760 = 0.93 Mean of proportion of exp. financed by coping Coping-adjusted health expenditure ratio (P) (High spending households) P = unadjusted C
 (High spending households) P = unadjusted C.")
52
Cumulative distributions of health expenditure ratios w = Unadjusted; P = Coping-adjusted (w) (P)
 (P)")
Similar presentations


>")


 Conducted by The National Bureau of Statistics.>")
 Sarah Bales Public Policy in Asia,>")


