Download presentation
Presentation is loading. Please wait.

1
Epi 712 – Intermediate Epidemiology Patty Kissinger, Ph.D. (Prof) Jeff Kopicko, MSPH (TA) Meg O’Brien, MPH (TA)
 Jeff Kopicko, MSPH (TA) Meg O’Brien, MPH (TA).")
2
Objectives To discuss course logistics To review the basics of Epidemiology To describe the difference between descriptive and analytic epidemiology To discuss the basic study designs To discuss criteria for causality Readings: Szklo and Nieto Chapter 1

3
Definition of Epidemiology The study of the distribution and determinants of health-related states or events in specified populations and the application of this study to control health problems.

4
Classifications of Epidemiology Descriptive – –Used to describe person, place and time –Used to generate hypotheses Analytic –Used to test hypotheses

5
Uses of Epidemiology Determine etiologic or causal factors Describe factors associate with adverse conditions Community diagnosis of distribution of diseases Predicting disease occurrence, impact and distribution Estimating individuals risk of disease

6
Uses of Epidemiology (con’t) Evaluating therapeutic and intervention activities Measurement of efficacy of health measures Studying of historical disease Identifying disease syndromes Planning for current health needs Predicting future needs.
 Evaluating therapeutic and intervention activities Measurement of efficacy of health measures Studying of historical disease Identifying disease syndromes Planning for current health needs Predicting future needs.")
7
Person, Place, Time Person - age, sex, race/ethnicity, martial status, occupation, education, socio- economic status Place - hospital-based, community- based, regional Time - seasonal, secular, am/pm/noc

8
Examples of descriptive epidemiologic findings

9
Gonorrhea (cases per 100,000) The Hidden Epidemic, Institute of Medicine, 1997
 The Hidden Epidemic, Institute of Medicine, 1997")
10
Possible interpretations May be confounded by detection bias (i.e. More people get tested in U.S and policy in Europe is to just treat syndromically and not test) May be reporting bias (gonorrhea is not reported as well in countries other than the U.S.) The U.S. people are more likely to have unprotected sex.
 May be reporting bias (gonorrhea is not reported as well in countries other than the U.S.) The U.S. people are more likely to have unprotected sex..")
11
Abnormal Pap results by age (U.S., 1991-1993, NBCCEDP)
")
12
Possible interpretations Interpretation is difficult because we don’t know if it is a rate or just cases reported If it is cases, then it is not interpretable without know the population distribution (i.e. denominator information) If it is rates, then women < 30 are at highest risk (maybe due to Human Papillomavirus)
 If it is rates, then women < 30 are at highest risk (maybe due to Human Papillomavirus).")
13
By 12th grade, nearly 70 percent of high school students have had sexual intercourse (YRBS, 1993)
")
14
Possible Interpretation Again, we don’t know if it is rates or cases It is prevalence data, and we don’t know when the first sexual act occurred, but we know that 38% of the 9 th graders already had sex so, sex education starting at high school is too late.

15
Definitions Endemic - a persistent level of occurrence with low to moderate disease level Hyper-endemic - persistently high level of occurrence Sporadic - irregular Epidemic (outbreak)- occurrence of disease is in excess of expected levels Pandemic - epidemic spreads over several countries or continents
- occurrence of disease is in excess of expected levels Pandemic - epidemic spreads over several countries or continents")
16
Role of an Epidemiologist Surveillance Outbreak investigation Hypothesis testing Evaluation Communication

17
Surveillance

18
The importance of surveillance for Management Purposes of surveillance setting of priorities planning and allocating resources for service defining population subgroups and risky behaviors for targeted interventions directing public health policy informing diagnostic and therapeutic practice evaluation of interventions stimulating further research

19
Characteristics of Surveillance Purpose is to monitor trends of disease Usually large data sets Can be used to identify persons at risk for a disease

21
Possible Interpretations This is a better slide because we know it is rates. We can probably draw a conclusion that the risk of breast cancer increases with age.

23
Possible interpretations We know that the rates of diabetes is going up, we assume it is type II or adult onset. We don’t what factors are related but we could hypothesis that obesity is increasing or there is an aging of the cohort since these are not age adjusted

26
Possible interpretations If you look at the last two slides and imagine them being super-imposed upon one another you can see that physical inactivity and cardiovascular disease co-vary. You could hypothesis that physical inactivity may be associated with cardio- vascular disease

28
Possible interpretations There does seem to be a trend for an increase in smoking among teenagers A statistical test, such as a Chi-square test for trends would better help you to decide.

30
Possible interpretations We should probably be most worried about the heterosexual community because it is steadily increasing and it is a broader base of the population (~90% of the population) This does not tell us anything about incidence, it is only a description of prevalence.
 This does not tell us anything about incidence, it is only a description of prevalence.")
31
Confounding E D C E=exposure C=confounder D=disease

32
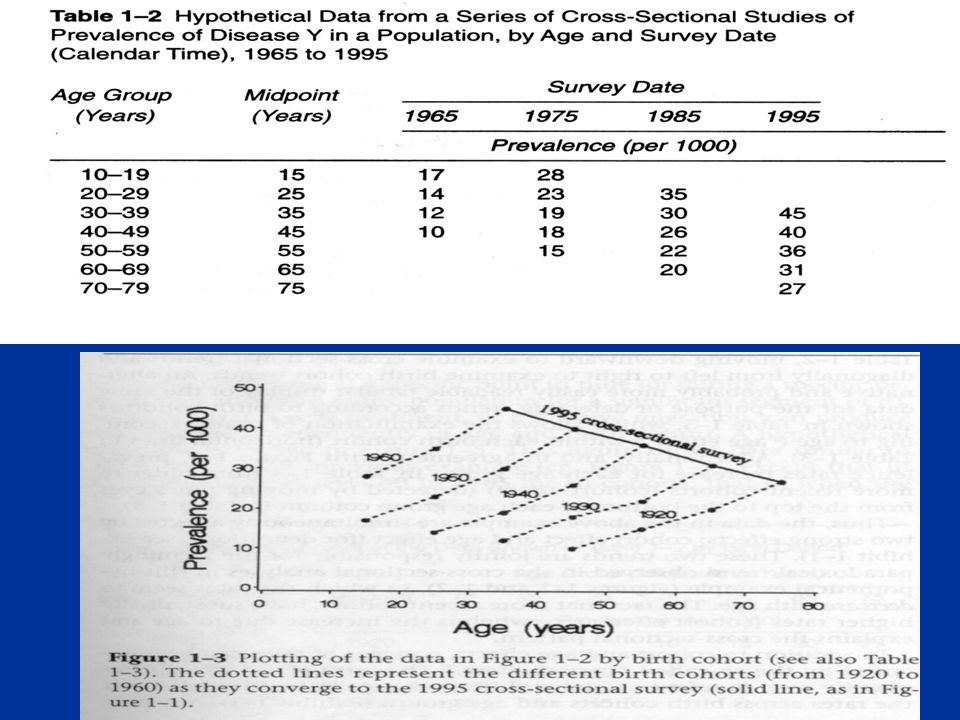
Birth Cohorts Age is a strong risk factor for many health outcomes For many diseases, exposures have a cumulative effect that are expressed over long periods of time.

39
Definitions Age effect – Change in the rate of a condition according to age irrespective of birth cohort and calendar time. Cohort effect – Change in the rate of a condition according to year of birth, irrespective of age and calendar time. Period effect – Change in the rate of a condition affecting an entire population at some point in time, irrespective of age and cohort effect

40
Surveillance Systems Are active or passive Can be for a whole population or for a selected group (sentinel)
")
41
Outbreak Investigation

42
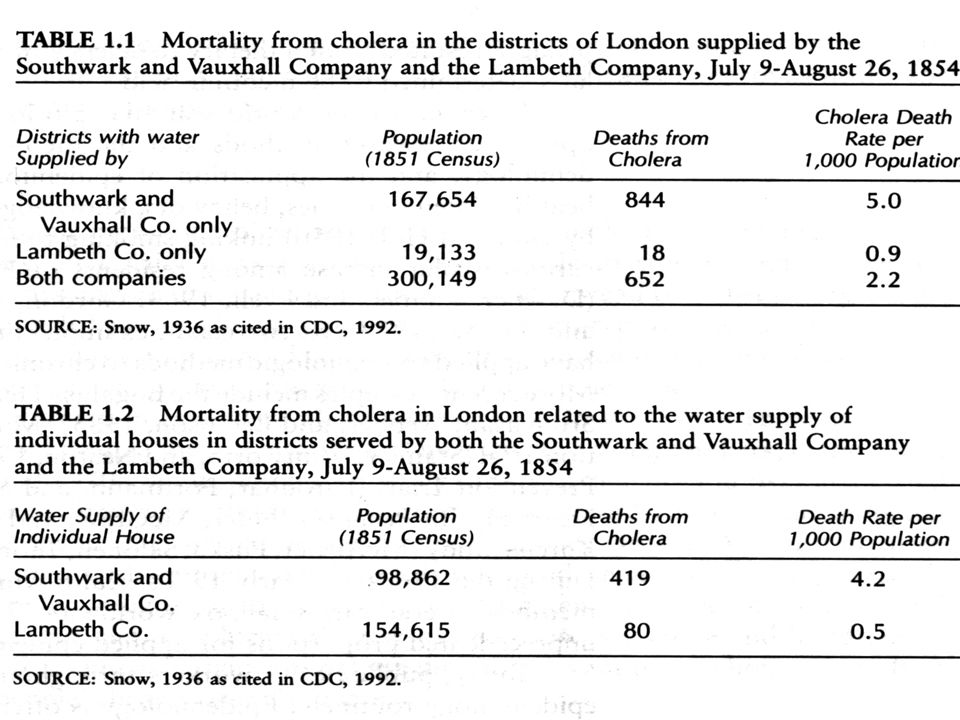
John Snow (The Father of Field Epidemiology) Cholera Outbreak Investigation 1854
 Cholera Outbreak Investigation 1854")
45
Possible Interpretations For both the community water sources (representing the poorer community) and individual home water sources (representing the higher socio-economic groups), Southwark rates were greater. Intervention should be started there.

47
Outbreak investigations A good idea to plot out the cases (better rates) and then determine when interventions were implemented to see if any helped.
 and then determine when interventions were implemented to see if any helped.")
48
Criteria for Causality Strength of association - larger ratio between diseased and non diseased greater the likelihood of causation Biological credibility – the association has to make sense biologically Consistency of findings - association found in one study is found in others. Dose-response - with increasing levels of exposure to the factor, a corresponding rise in occurrence of disease occurs Specificity - The extent to which the occurrence of a variable can be used to predict the occurrence of an outcome. Time sequence- exposure precedes the disease

49
Study Designs DescriptiveAnalytic Experimental correlational case report/ case series cross-sectional case control cohort clinical trial community trial

Similar presentations


 Betty C. Jung, RN, MPH, CHES.>")
 Impacts personal decisions about our lifestyles Affects government, public health agency and.>")


