Download presentation
Presentation is loading. Please wait.

1
October 2011

2
Math/Science Goals Complying with No Child Left Behind requirements, all students in Grades 3-8 and Grade 11 will meet or exceed “proficiency” on the MCA in math all students in Grades 5, 8, and 10 will meet or exceed “proficiency” on the MCA in science

3
Baseline/Trend Data Plainview and Elgin-Millville School Districts consolidated in the fall of 2006. We’ve taken 5 rounds of standardized testing as P-E-M. We’re finally establishing some useful trend data.

6
2011 MCA-II Scores MathReading Science GradePEMStatePEMState PEMState 378.470.185.378.5 -- 454.267.268.875.2 -- 549.553.679.680.3 51.746.0 666.450.384.575.1 -- 752.951.769.769.6 -- 871.753.287.668.1 74.044.4 9 (Writing) 92.789.1 10-- 75.275.3 84.653.8 1155.059.2-- (blue = above state average, red = below)
 (blue = above state average, red = below)")
7
Results over time (Math MCA-II) Tested in ↓ Class of 2013 Class of 2014 Class of 2015 Class of 2016 Class of 2017 Class of 2018 Class of 2019 Class of 2020 Spring of 3rd grade -- 22 -3 8 Spring of 4 th grade -- 184-7 -9 -13 Spring of 5th grade --12 1-6 -4 Spring of 6th grade 612216 16 Spring of 7th grade 5716 1 Spring of 8th grade 69 19 Current 11 th Current 10 th Current 9 th Current 8 th Current 7 th Current 6 th Current 5 th Current 4 th Percentage Difference in MATH Proficiency: PEM vs. State Average

8
Results over time (Science MCA-II) Percentage Difference in SCIENCE Proficiency: PEM vs. State Average Class of 2010 Class of 2011 Class of 2012 Class of 2013 Class of 2014 Class of 2015 Class of 2016 Class of 2017 Tested in Spring 2008 26 (69/43) -- 13 (51/38) -- 14 (53/39) -- Tested in Spring 2009 -- 22 (72/50) -- 5 (48/43) -- 5 (50/45) -- Tested in Spring 2010 -- 19 (71/52) -- 6 (54/48) -- -2 (44/46) Tested in Spring 2011 31 (85/54) 30 (74/44) 6 (52/46) Grad 2010 Grad 2011 Current 12 th Current 11 th Current 10 th Current 9 th Current 8 th Current 7 th Current 6 th
 (51/38) (53/39) -- Tested in Spring (72/50) -- 5 (48/43) -- 5 (50/45) -- Tested in Spring (71/52) -- 6 (54/48) (44/46) Tested in Spring (85/54) 30 (74/44) 6 (52/46) Grad 2010 Grad 2011 Current 12 th Current 11 th Current 10 th Current 9 th Current 8 th Current 7 th Current 6 th.")
9
Results over time (Reading MCA-II) Tested in ↓ Class of 2014 Class of 2015 Class of 2016 Class of 2017 Class of 2018 Class of 2019 Class of 2020 Spring of 3rd grade -- 5-4 0 6 Spring of 4 th grade --152-4 -3 -6 Spring of 5th grade 81741 0 Spring of 6th grade 12201 10 Spring of 7th grade 19 0 Spring of 8th grade 1 20 Current 10 th Current 9 th Current 8 th Current 7 th Current 6 th Current 5 th Current 4 th Percentage Difference in READING Proficiency: PEM vs. State Avg.

10
Comparative Data 11th Grade Math Proficiency 2010-2011 74% Byron 64% Zumbrota-Mazeppa 63% Dover-Eyota 63% Kasson-Mantorville 60% Rochester 52% Stewartville 51% Pine Island Note: Test not currently required for graduation Results taken from MDE’s Educator Portal 50% Kingsland 49% State Average 45% Triton 41% P-E-M 41% Chatfield 31% Hayfield

11
Comparative Data High School Science Proficiency 2010-2011 85% P-E-M 69% Stewartville 68% Byron 65% Kasson-Mantorville 65% Dover-Eyota 64% Zumbrota-Mazeppa 60% Chatfield Note: Test not currently required for graduation (Typically tested at the end of 10 th grade year) Results taken from MDE’s Educator Portal 59% Rochester 54% Pine Island 54% State Average 50% Triton 48% Hayfield 47% Kingsland
 Results taken from MDE’s Educator Portal 59% Rochester 54% Pine Island 54% State Average 50% Triton 48% Hayfield 47% Kingsland")
12
Comparative Data 10 th Grade Reading Proficiency 2010-2011 88% Kasson-Mantorville 87% Dover-Eyota 87% Stewartville 84% Byron 81% Zumbrota-Mazeppa 81% Chatfield 80% Pine Island Note: Test required for graduation Results taken from MDE’s Educator Portal 78% Rochester 77% Hayfield 77% Triton 75% P-E-M 75% State Average 69% Kingsland

13
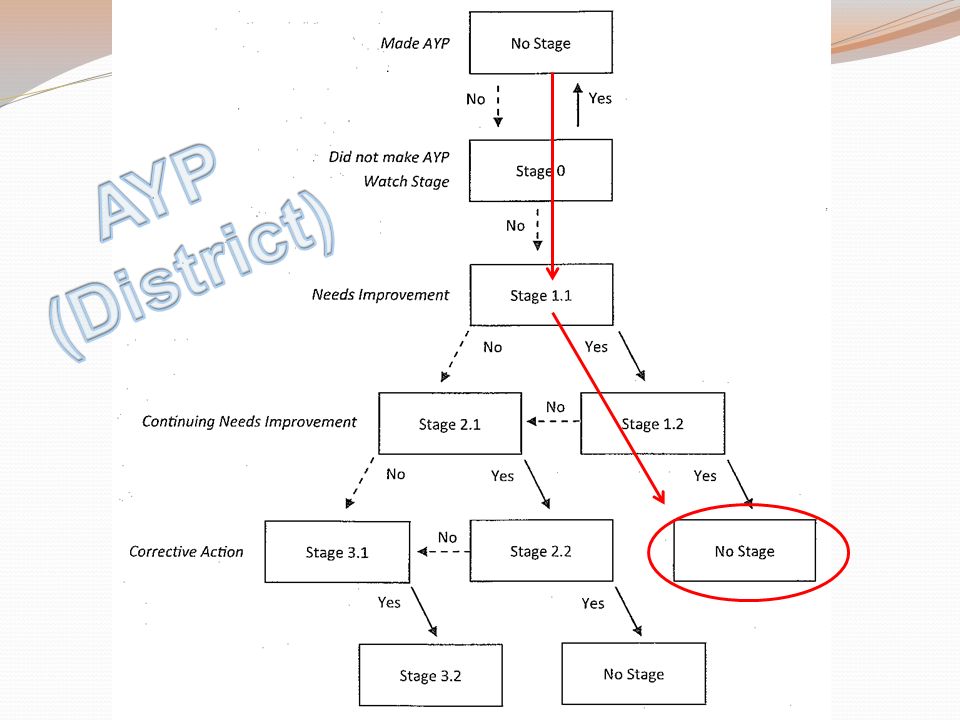
Lead Indicators District made Adequate Yearly Progress for two years in a row (a.k.a. now off the ‘Not Making AYP’ list) Our scores still remain consistent overall. We’re addressing grade-level assessment score anomalies (steep growth/dips).
 Our scores still remain consistent overall. We’re addressing grade-level assessment score anomalies (steep growth/dips)..")
14
Next Steps Currently in the midst of multi-school Professional Learning Community consortium. This has been well received by the district thus far. New reading series implemented 2011-2012.

15
Lessons Learned/Best Practices Curriculum sharing between schools is a must. P-E-M’s 10th grade science scores have remained high, and now 8 th and 5 th grade science scores are following suit. Taking time to focus on the standards has been key to producing results.

16
Summary Science scores very high. Reading and math scores tend to hover near the state average. District-wide Staff Development 2011-2012 is on learning about, establishing and sustaining Professional Learning Communities.

Similar presentations


>")
>")


