Download presentation
Presentation is loading. Please wait.

1
Utility Scale Wind Energy Prof. Park UTI-111 Essex County College

2
Wind Turbine Economics At present, the most economical application of wind turbines is in groups of large machines installed on wind farm. Wind farm range in size from a few megawatts to hundreds of megawatts. Wind farms can be made larger or smaller as needed. Turbines can be added as electricity demand grows. Currently a 100-MW wind farm can be erected in 6 to 12 months. This does not include the time needed for measuring the wind and obtaining construction permits.

3
Wind Power Cost Wind power cost have fallen since wind turbine installation began in 1980’s. Larger machines have produced economies of scale and technology advances have lowered many component costs. However recant change in overall economy have caused cost to start to rise again.

4
Wind Power Cost per kWMinimumAverageMaximum 2006$1,150$1,480$2,240 2005$1,260

5
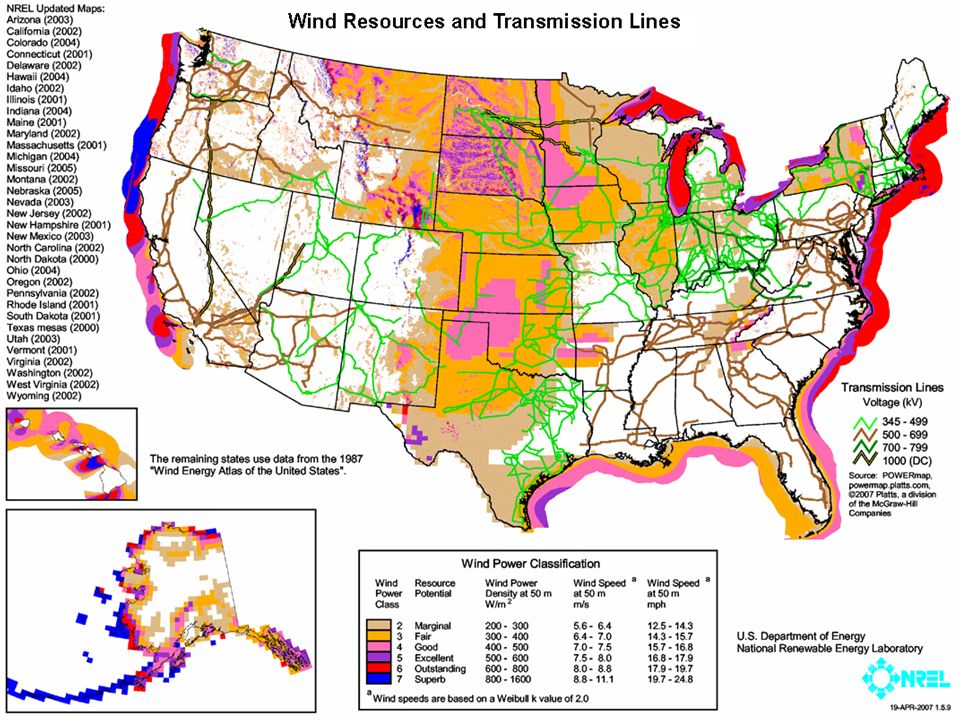
Table 1-1 Classes of wind power density at 10 m and 50 m(a) Wind Power Class 10 m (33 ft)50 m (164 ft) Wind Power Density (W/m 2) Speed (b) m/s (mph) Wind Power Density (W/m 2) Speed (b) m/s (mph) 1 000 1004.4 (9.8)2005.6 (12.5) 2 1505.1 (11.5)3006.4 (14.3) 3 2005.6 (12.5)4007.0 (15.7) 4 2506.0 (13.4)5007.5 (16.8) 5 3006.4 (14.3)6008.0 (17.9) 6 4007.0 (15.7)8008.8 (19.7) 7 10009.4 (21.1)200011.9 (26.6)
 Wind Power Class 10 m (33 ft)50 m (164 ft) Wind Power Density (W/m 2) Speed (b) m/s (mph) Wind Power Density (W/m 2) Speed (b) m/s (mph) (9.8) (12.5) (11.5) (14.3) (12.5) (15.7) (13.4) (16.8) (14.3) (17.9) (15.7) (19.7) (21.1) (26.6)")
9
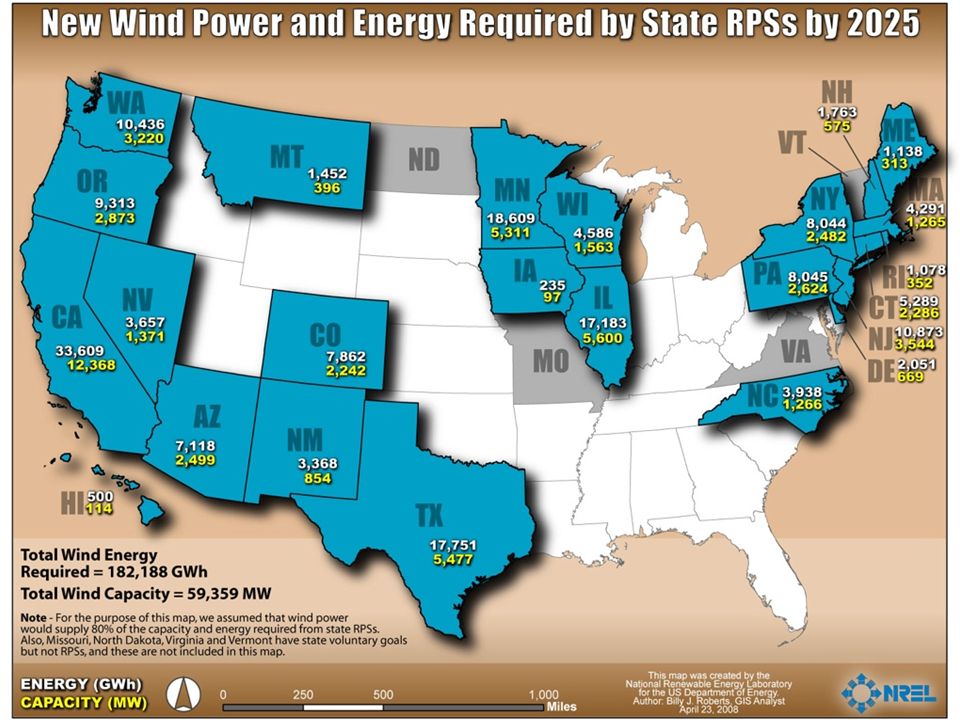
Wind and solar PV energy development in the United States is experiencing explosive growth. According to the American Wind Energy Association (AWEA), 5,244 megawatts (MW) of new wind capacity was added in the United States in 2007, which increased total wind power capacity by 45% in a single year and injected more than $9 billion into the U.S. economy. Total installed capacity at the end of 2007 was 16,818 MW, and projected wind capacity installations in the United States in 2008 are expected to total more than 5,000 MW. This is more than twice the 2,400 megawatts (MW) of new wind capacity that was added to the system in 2006 at a cost of $4 billion (2007$). Note that more wind power capacity was installed and made operational in 2007 than was developed in the United States between 1981-2002.
, 5,244 megawatts (MW) of new wind capacity was added in the United States in 2007, which increased total wind power capacity by 45% in a single year and injected more than $9 billion into the U.S. economy. Total installed capacity at the end of 2007 was 16,818 MW, and projected wind capacity installations in the United States in 2008 are expected to total more than 5,000 MW. This is more than twice the 2,400 megawatts (MW) of new wind capacity that was added to the system in 2006 at a cost of $4 billion (2007$). Note that more wind power capacity was installed and made operational in 2007 than was developed in the United States between")
11
New Jersey annual average wind power

12
The formula for calculating the power from a wind turbine Power = k Cp 1/2 ρ A V3 Where: P = Power output, kilowatts Cp = Maximum power coefficient, ranging from 0.25 to 0.45, dimension less (theoretical maximum = 0.59) ρ = Air density, lb/ft3 A = Rotor swept area, ft2 or π D2/4 (D is the rotor diameter in ft, π = 3.1416) V = Wind speed, mph k = 0.000133 A constant to yield power in kilowatts. AEO = 0.01328 D2 V3 Where: AEO = Annual energy output, kWh/year D = Rotor diameter, feet V = Annual average wind speed, mph

13
Average wind speeds increase with height.

14
Installed windpower capacity (MW) # Nation 2005 2006 2007 2008 [1] [1] - European Union 40,72248,12256,61465,255 1 United States 9,14911,60316,81825,237 2 Germany 18,41520,62222,24723,933 3 Spain 10,02811,61515,14516,543 4 China 1,2602,6046,05012,121 5 India 4,4306,2708,0009,655 World total (MW)59,09174,22393,849121,188
![Installed windpower capacity (MW) # Nation [1] [1] - European Union 40,72248,12256,61465,255 1 United States 9,14911,60316,81825,237 2 Germany 18,41520,62222,24723,933 3 Spain 10,02811,61515,14516,543 4 China 1,2602,6046,05012,121 5 India 4,4306,2708,0009,655 World total (MW)59,09174,22393,849121,188](http://images.slideplayer.com/25/7892651/slides/slide_14.jpg "Installed windpower capacity (MW) # Nation [1] [1] - European Union 40,72248,12256,61465,255 1 United States 9,14911,60316,81825,237 2 Germany 18,41520,62222,24723,933 3 Spain 10,02811,61515,14516,543 4 China 1,2602,6046,05012,121 5 India 4,4306,2708,0009,655 World total (MW)59,09174,22393,849121,188")
Similar presentations


 Make Oklahoma a national leader in renewable energy Mission Accomplished!>")
 Blue font and lines – need to know.>")


 www.REVermont.org.>")

 According to the US Department of Energy, Wind & Hydropower Technologies Program, wind turbines.>")


, kilowatts (kW), or horsepower Power is an.>")
