Download presentation
Presentation is loading. Please wait.

1
Bridgepoint Education Authorized Labels for Information: Applied Materials Confidential. Applied Materials Confidential Restricted/Modifier Applied Materials Confidential/Modifier External Use R 255 G 255 B 204 R 202 G 222 B 233 Light Background Palette R 255 G 121 B 1 R 124 G 165 B 0 R 208 G 0 B 30 Bingo Color Palette R 102 G 102 B 255 R 75 G 75 B 75 R 192 G 192 B 192 R 255 G 255 B 41 R 128 G 0 B 0 R 72 G 2 B 94 R 173 G 217 B 0 Secondary Color Palette Main Color Palette R 0 G 204 B 255 R 0 G 153 B 204 R 0 G 51 B 102 R 255 G 121 B 1 R 208 G 0 B 30 R 167 G 17 B 103 R 0 G 153 B 0 Building Business Acumen ®

2
5 Business Drivers Cash Assets Growth Profit People

3
5 Business Drivers Cash

4
Cash is _____! “Cash is more important than your mother.” Al Shugart Former Seagate CEO “Cash is a company’s oxygen supply.” Ram Charan

5
Cash – Bridgepoint “As of September 30, 2011, the company had cash, cash equivalents and marketable securities of $344.7 million.”.

6
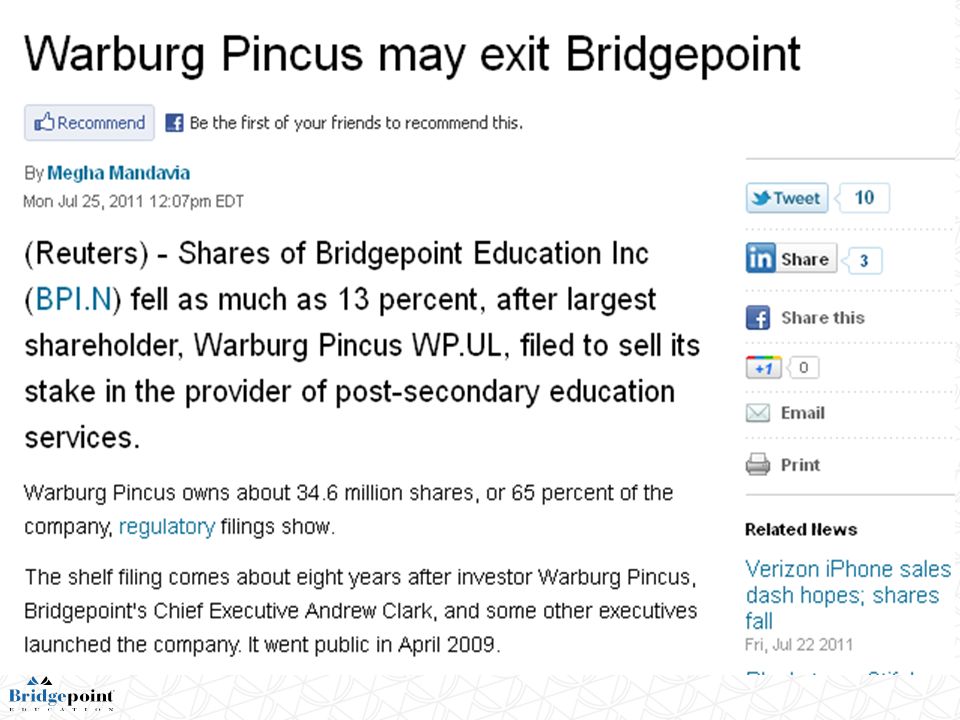
In 2010, we repurchased 3 million shares at an average cost of $14.05 per share, for a total purchase price of $42.2 million. For the first 9 months of the 2011, the company has spent $88 million in buying back stock which brings to an end the current stock buy-back authorized by the board of directors. Buying back stock:

7
Companies ought to keep just enough cash to cover their interest, expenses and capital expenditures; plus they should hold a little bit more in case of emergencies. Investopedia How Much Cash Should You Have?

8
Cash – Bridgepoint 8% 26% 38% 42%

9
Bridgepoint / Benchmark Companies 42% 26% 21% 17% 15% 12%

10
Cash – Bridgepoint “Cash From Operating Activities for the first 9 months of 2011 = $149 million..

11
Bridgepoint / Benchmark Companies

12
5 Business Drivers Cash Profit

13
Revenue (Sales)$100 100 100 - Instr. costs & ser.$ 26 26 30 - Marketing & Promo$ 30 27 26 - General & Admin.$ 14 14 12.5 = Operating Income$ 30 33 32 + Interest Income net$ 1 - = Net Income$ 18 21 - Income Tax $ 13 13 2010 2011 Target YTD

14
Revenue (Sales) $100 21% - Instructional costs & ser. $ 26.3 - Marketing & Promotion $ 26.7 - General & Administrative $ 14 = Operating Income $ 33 + Interest Income net $ - = Net Income $ 21 - Income Tax $ 13 - Profit & Loss Statement (First 9 months 2012) - 33%
 - 33%.")
15
High Profit Margins S&P Average is:13% Who has much higher profit margins? Qualcomm30% Oracle24% Apple 22% Facebook 20% Coca Cola20% Why the high margins?

16
Low Profit Margins S&P Average is:13% Who has much lower profit margins? Exxon Mobile 8% Ford 5% Wal-Mart3.5% Whole Foods 3.4% Costco1.8% Amazon 1.3% Why the low margins?

17
Profit – Bridgepoint First 9 month of 2011: Operating Margin = 33% Net Income Margin = 21%

18
Bridgepoint / Benchmark Companies

19
5 Business Drivers Cash Assets Profit

20
Assets (read from page 16) Balancing… Asset Strength Asset Utilization & Cash, ratings, property plan & equipment
 Balancing… Asset Strength Asset Utilization & Cash, ratings, property plan & equipment")
21
Assets – Bridgepoint First 9 month of 2011: Return on Assets = 26.5% Equity Ratio = 57%

22
Bridgepoint / Benchmark Companies

23
5 Business Drivers Cash Assets Growth Profit

24
Growth – Bridgepoint Revenue in Q3 growing due to the 5% tuition increase on April 1 st of 2011 and increased enrollment.

25
Guidance for 2011: -Total student enrollment of 83,000 to 85,000 -Revenue of $920 to $926 million -Net income of $168.5 to $170.3 million -Diluted EPS of $2.95 to $2.98.

26
(i)The continued availability of Title IV funds to finance student tuition payments, (ii) Increased demand for postsecondary education resulting from a deteriorating labor market and (iii) Efficiencies in advertising costs. Page 72, 10-K We believe that the performance of our company has been resilient in the current economic environment due to:

27
Bridgepoint / Benchmark Companies

28
5 Business Drivers Cash Assets Growth Profit People Customers & Employees

29
Employees “A’s hire A+’s and B’s hire C’s” The #1 reason a person will leave their job? 38% of current employees believe they will be somewhere else in 18 months. Airplane

30
People – Bridgepoint Enrollment forecasted to be 83,000 to 85,000 students for year-end 2011.

31
Bridgepoint / Benchmark Companies

32
“He skates to where the puck is going to be…” Walter Gretzky Anticipation “If I would have asked my customers what they wanted, they would have said a faster horse” Henry Ford

33
5 Business Drivers Cash Assets Growth Profit People

35
Description Includes the Notes

36
5 Business Drivers Cash Assets Growth Profit People Statement of Cash Flows Profit & Loss Balance Sheet

37
Becomes Cash < 1 year Most Liquid Least Liquid Due First Due Last Due in < 1 year Asset Strength Balance Assets = Liabilities + Equity Equity ratio = 51% Current ratio = 1.7

38
1.Plenty of cash 2.Current ratio at 1.7 3.Trends are good 4.Strong equity position, 51%. Strong Balance Sheet

39
For Title IV, one financial responsibility standard is based on the institution's composite score, which is derived from a formula established by the Department that is a weighted average of three financial ratios: equity ratio, which measures the institution's capital resources, financial viability and ability to borrow; primary reserve ratio, which measures the institution's ability to support current operations from expendable resources; and net income ratio, which measures the institution's ability to operate at a profit or within its means. The composite score is a number between negative 1.0 and positive 3.0 and it must be at least 1.5. We expect our scores for 2010 to be 3.0. Financial responsibility section, Item 1, Form 10-K

40
Net Income / Number of Shares Profit (P&L) Top Line Bottom Line Sales –Expenses =Net Income 57% 189% 56% 45% -8% 33% - Operating Margin = 30% Net Profit Margin = 18% 175% 165% 26% 30% 14% 09-10 Var.
 Top Line Bottom Line Sales –Expenses =Net Income 57% 189% 56% 45% -8% 33% - Operating Margin = 30% Net Profit Margin = 18% 175% 165% 26% 30% 14% Var.")
41
Increase Sales by 100K +100 26 + 44 18 for taxes + 26 30 56 + 44

42
If your team cuts $100 thousand from the “General and Administrative” line item, what would be the impact on the P&L? Assume quality is the same. Work Team Impact on the 5 Elements (Table Activity)
.")
43
Decrease by 100K - 100 + 100 41 for taxes + 59 + 100 - 100

44
Which is better, increasing sales by $100K or cutting costs by $100K ? Increasing sales increases Net Income by $26K. Cutting costs increases Net Income by $59K. What are the other considerations of increasing sales vs. cutting costs? Work Team Impact on the 5 Elements

45
Cash from Operations + Cash from Investing + Cash from Financing = Change in Cash

46
Cash Flow

47
Bridgepoint Education Authorized Labels for Information: Applied Materials Confidential. Applied Materials Confidential Restricted/Modifier Applied Materials Confidential/Modifier External Use R 255 G 255 B 204 R 202 G 222 B 233 Light Background Palette R 255 G 121 B 1 R 124 G 165 B 0 R 208 G 0 B 30 Bingo Color Palette R 102 G 102 B 255 R 75 G 75 B 75 R 192 G 192 B 192 R 255 G 255 B 41 R 128 G 0 B 0 R 72 G 2 B 94 R 173 G 217 B 0 Secondary Color Palette Main Color Palette R 0 G 204 B 255 R 0 G 153 B 204 R 0 G 51 B 102 R 255 G 121 B 1 R 208 G 0 B 30 R 167 G 17 B 103 R 0 G 153 B 0 INCOME STATEMENT Revenues $713,233 - COGS = Gross Margin - Operating Costs = Operating Income - Interest & Taxes Net Income $ 127,580 CASH FLOW STATEMENT Net Income $ 127,580 + Non-cash transactions = Cash from Ops +/- Cash from Investing +/- Cash from Financing = Change in Cash + Beginning Cash Balance Cash & Cash Equivalents $ 188,518 BALANCE SHEET Cash & Cash Equivalents $ 188,518 + Other Assets = Total Assets Total Liabilities Total Equity $ 238,241 STARTS with Customers This statement shows how much the company generated in sales (revenues) from it’s customers. Then expenses are subtracted, and Net Income is shown. STARTS with Customers This statement shows how much the company generated in sales (revenues) from it’s customers. Then expenses are subtracted, and Net Income is shown. ENDS with Owners This statement shows what the company owns (assets), what the company owes (liabilities), and how much equity the owners have (owners’ equity), at a specific point in time. ENDS with Owners This statement shows what the company owns (assets), what the company owes (liabilities), and how much equity the owners have (owners’ equity), at a specific point in time. Expenses This statement shows how much cash actually flowed into the company (cash inflows) and the cash that flowed out of the company (cash outflows) during the statement year, and finally the cash amount left over at the end of the year. Financial Statements: Inter-relationship
 from it’s customers. Then expenses are subtracted, and Net Income is shown. STARTS with Customers This statement shows how much the company generated in sales (revenues) from it’s customers. Then expenses are subtracted, and Net Income is shown. ENDS with Owners This statement shows what the company owns (assets), what the company owes (liabilities), and how much equity the owners have (owners’ equity), at a specific point in time. ENDS with Owners This statement shows what the company owns (assets), what the company owes (liabilities), and how much equity the owners have (owners’ equity), at a specific point in time. Expenses This statement shows how much cash actually flowed into the company (cash inflows) and the cash that flowed out of the company (cash outflows) during the statement year, and finally the cash amount left over at the end of the year. Financial Statements: Inter-relationship.")
48
Finding our performance on the 5 Drivers Cash Assets Growth Profit People

49
299 190 713 Cash + Marketable Securities 128 30 18 27 51 57 175 189 77,892

50
1) What is the role of the stock market? 2) Why did Bridgepoint go public? 3) Who cares about your stock price and why? a. Investors b. Analysts The Role of the Stock Market
 Who cares about your stock price and why. a. Investors b. Analysts The Role of the Stock Market.")
51
Analyst Ratings

52
1) What is the role of the stock market? 2) Why did you go public? 3) Who cares about your stock price and why? a. Investors b. Analysts c. Andrew Clark d. Employees 4) What are the benefits of a higher stock price? The Role of the Stock Market
 Who cares about your stock price and why. a. Investors b. Analysts c. Andrew Clark d. Employees 4) What are the benefits of a higher stock price. The Role of the Stock Market.")
53
1) Treasury stock worth more. 2) Secondary offering brings more cash. 3) Better credit ratings = more access to cash at a cheaper rate. 4) More acquisition power. 5) Can attract talented people. 6) More expensive in a buy-out. 6 Benefits of a Higher Stock Price: (Page 41)
 Better credit ratings = more access to cash at a cheaper rate. 4) More acquisition power. 5) Can attract talented people. 6) More expensive in a buy-out. 6 Benefits of a Higher Stock Price: (Page 41).")
54
Market Cap = Share Price X Number of Shares

55
P rice (of one share of stock) E arnings Per Share (for last 12 months) Price $ 25.95 EPS $ 3.05 = 8.5 P/E ratio The P/E Ratio (Page 42, 43)
 E arnings Per Share (for last 12 months) Price $ EPS $ 3.05 = 8.5 P/E ratio The P/E Ratio (Page 42, 43)")
56
P/E Ratios

57
External Factors – Stock price

59
External Factors—Stock price vs. Dow and S&P

60
Engage your teams: People will work hard for a paycheck, harder for a person, and hardest for a reason.

Similar presentations