Download presentation
Presentation is loading. Please wait.

1
2012 KYTC Transportation-GIS Conference Kentucky Transportation Cabinet Office Building 200 Mero St., Frankfort, KY 40601 Thursday March 29, 2012 Pavement Perspectives from the Air: LiDAR Intensity Images: Demetrio P. Zourarakis, PhD, GISP, CMS-RS, CMS-GIS/LIS Remote Sensing and GIS Analyst, Kentucky Division of Geographic Information

2
Background Rapidly accumulating LiDAR datasets LiDAR standards continuously improving – more complex and rich data (LAS 1.4) A diverse range of products delivered: –Point clouds –TINs –Breaklines –DEMs –Intensity images –Etc., etc., etc.
 A diverse range of products delivered: –Point clouds –TINs –Breaklines –DEMs –Intensity images –Etc., etc., etc.")
3
Background (continued) LiDAR “point clouds” contain information on surface cover properties: –“top of objects” (structures) –“canopy” (vegetation) –“bare earth” OR “ground” LiDAR return intensity images and elevation differences are thought of as additional “layers” for image interpretation and classification Kentucky Aerial Photography and Elevation program Leaf – off, near infrared aerial orthophotography (yeah!)
 LiDAR point clouds contain information on surface cover properties: – top of objects (structures) – canopy (vegetation) – bare earth OR ground LiDAR return intensity images and elevation differences are thought of as additional layers for image interpretation and classification Kentucky Aerial Photography and Elevation program Leaf – off, near infrared aerial orthophotography (yeah!)")
4
LiDAR= ACTIVE remote sensing SOURCE ---------------- RECEPTOR

5
http://www.tetonconservation.org/index.cfm?id=lidar

6
Often, “oblique LiDAR”

8
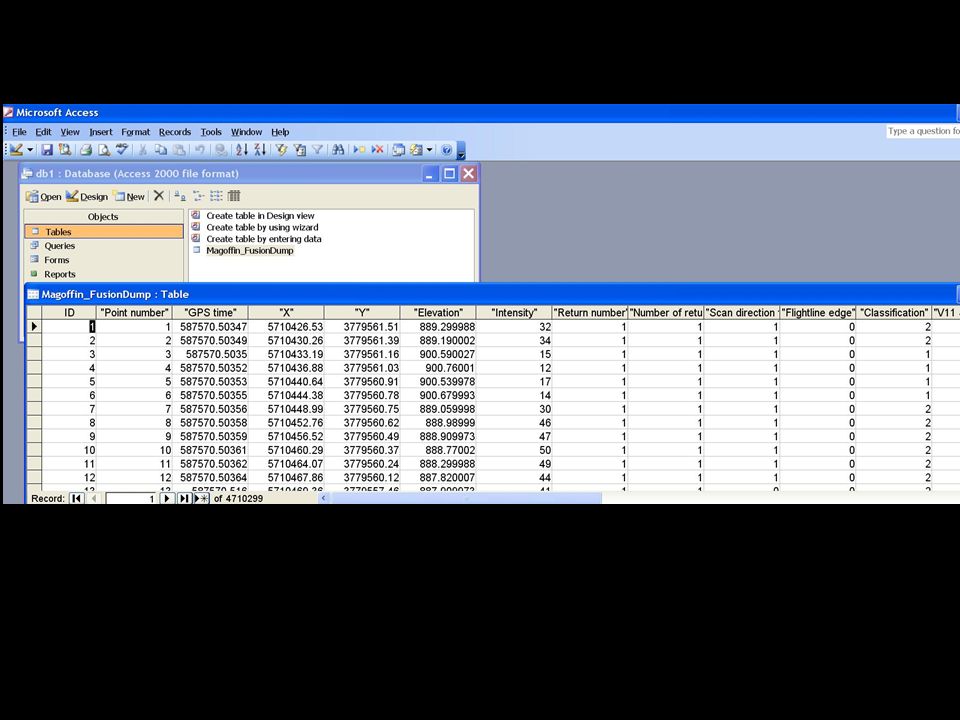
LAS Binary Data Format (v. 1.2) (Source: ASPRS (http://www.asprs.org)http://www.asprs.org The LAS file is intended to contain LiDAR point data records. The Binary Data Format includes: Point Data: X, Y, Z, Intensity, Scan Direction Flag, Edge of Flight Line, Classification, etc.
 (Source: ASPRS ( The LAS file is intended to contain LiDAR point data records. The Binary Data Format includes: Point Data: X, Y, Z, Intensity, Scan Direction Flag, Edge of Flight Line, Classification, etc..")
9
ASPRS Standard LIDAR Point Classes Classification Value 0 Created, never classified 1 Unclassified 2 Ground 3 Low Vegetation 4 Medium Vegetation 5 High Vegetation 6 Building 7 Low Point (noise) 8 Model Key-point (mass point) 9 Water 10 Reserved for ASPRS Definition 11 Reserved for ASPRS Definition 12Overlap Points 13- 31 Reserved for ASPRS Definition
 8 Model Key-point (mass point) 9 Water 10 Reserved for ASPRS Definition 11 Reserved for ASPRS Definition 12Overlap Points Reserved for ASPRS Definition")
10
Viewing, identifying, … accessing, exporting … Freeware –LAS Reader –LP360 Viewer –Quick Terrain Reader –USFS “Fusion” Commercial –LP360 –Microstation –ArcGIS Desktop 10.1

11
Data Types (Esri) ObjectID Text Date Geometry Raster (Long Integer) Short Integer Long Integer Float (Single) Double (Float) Binary Large Object: BLOB = LiDAR DATA
 ObjectID Text Date Geometry Raster (Long Integer) Short Integer Long Integer Float (Single) Double (Float) Binary Large Object: BLOB = LiDAR DATA")
12
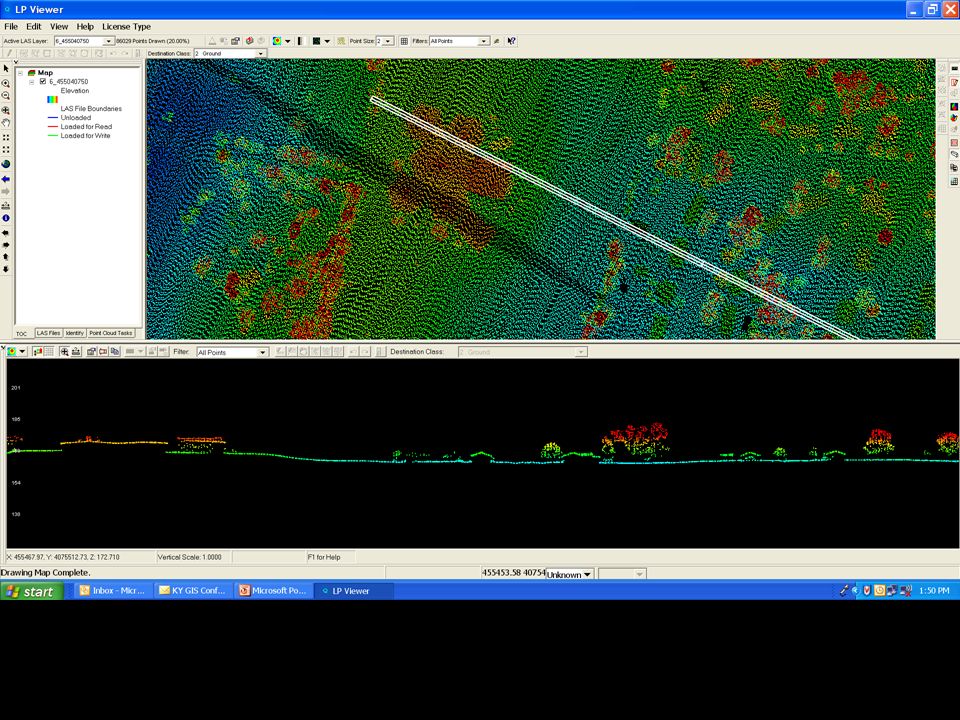
LP360 Viewer

15
“Intensity Image= can be a complex” A composite of intensities in 3D space: 1 st, 2 nd, 3 rd, 4 th … –FIRST or LAST of multiple returns (classes= unclassified/bare earth) –Hence, multiple ELEVATIONS A composite of classes (2= Bare Earth; 1=Unclassified) –LAST of MULTIPLE returns (2) –FIRST=LAST if it is ONLY return and NOT a structure (2) Otherwise: –FIRST of MULTIPLE returns (1) –FIRST if a structure (1) A composite of intensities in 2D space (POINT to SURFACE) –Point to TIN –Point to Raster –TIN to Raster And what about that pesky quantization issue? –Intensity image delivered to 8-bit (0-255) –.las intensity is delivered by sensor at 12-bit (0-4095) –A few extremely high intensities are filtered out before rescaling
 –.las intensity is delivered by sensor at 12-bit (0-4095) –A few extremely high intensities are filtered out before rescaling.")
16
LiDAR in KY – Datasets Currently Available

17
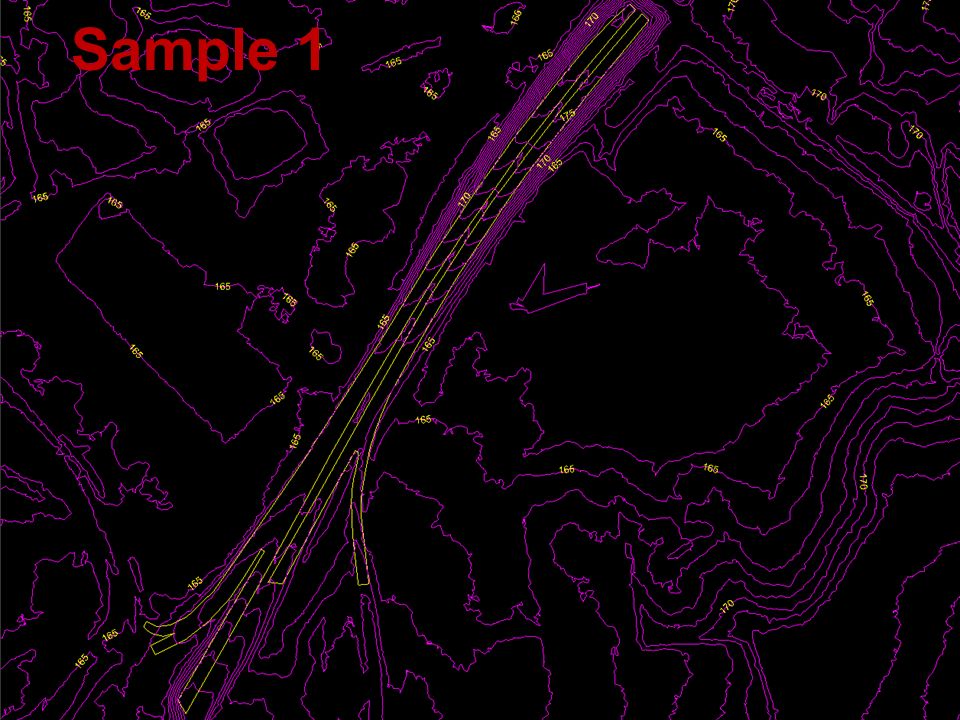
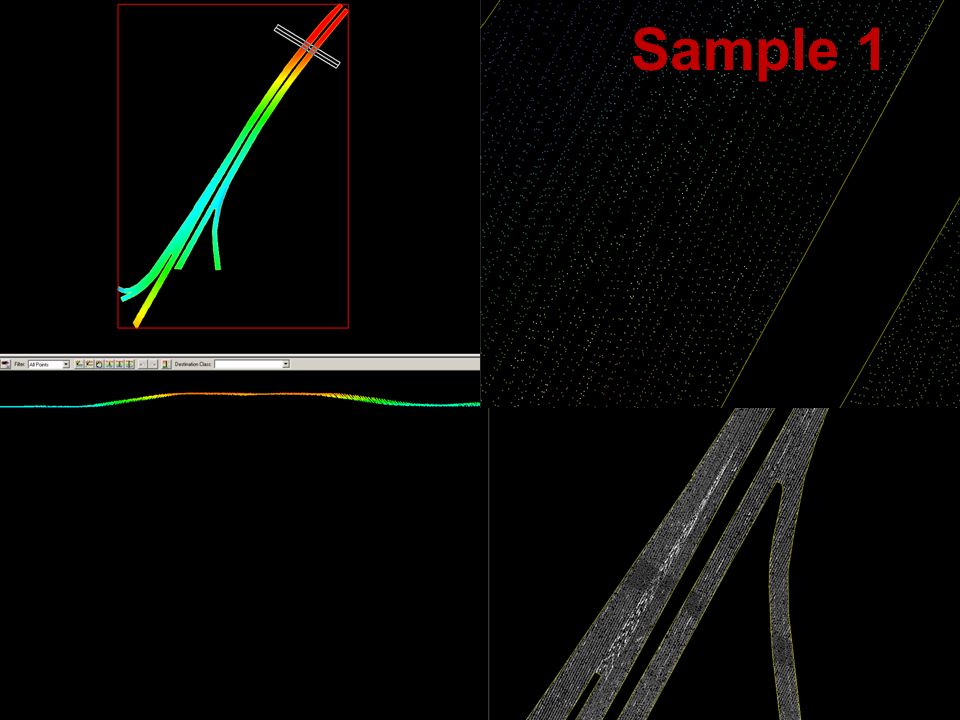
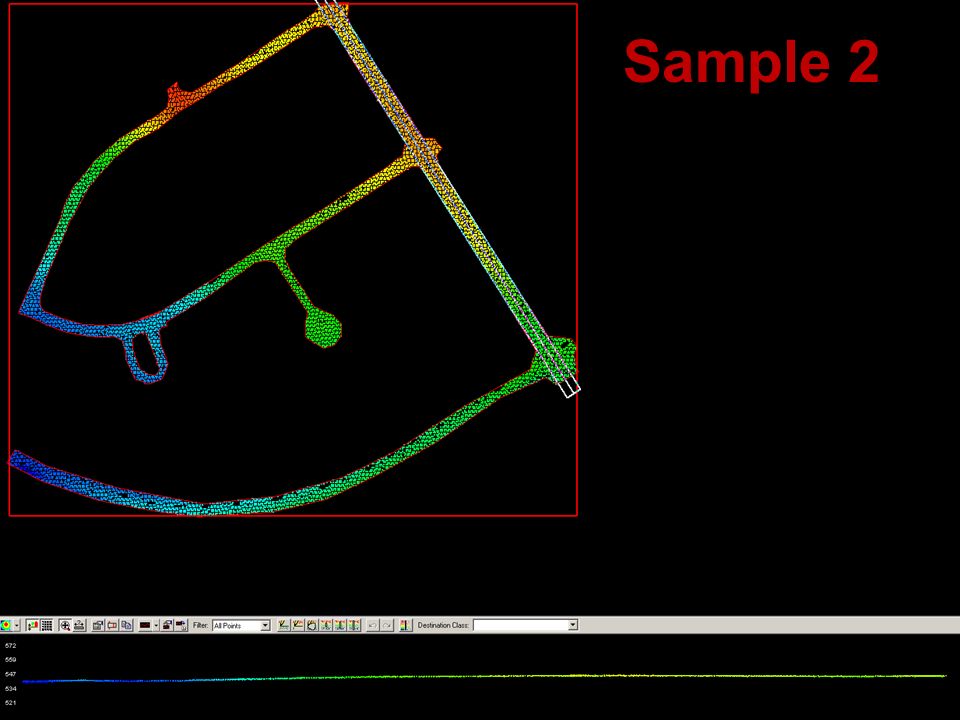
Data Provenance SAMPLE 1SAMPLE 2SAMPLE 3 AGENCY USDA-NRCS LOJIC FEMA-DOW PHOTOGRAMMETRY AERO-METRIC, INC. WOOLPERT, INC. PHOTO SCIENCE, INC. NOMINAL PULSE SPACING 0.7 meter 1 meter 1 point/sq. meter ACQUISITION DATE 4/13/2010 08/04/09 5/8/2007

18
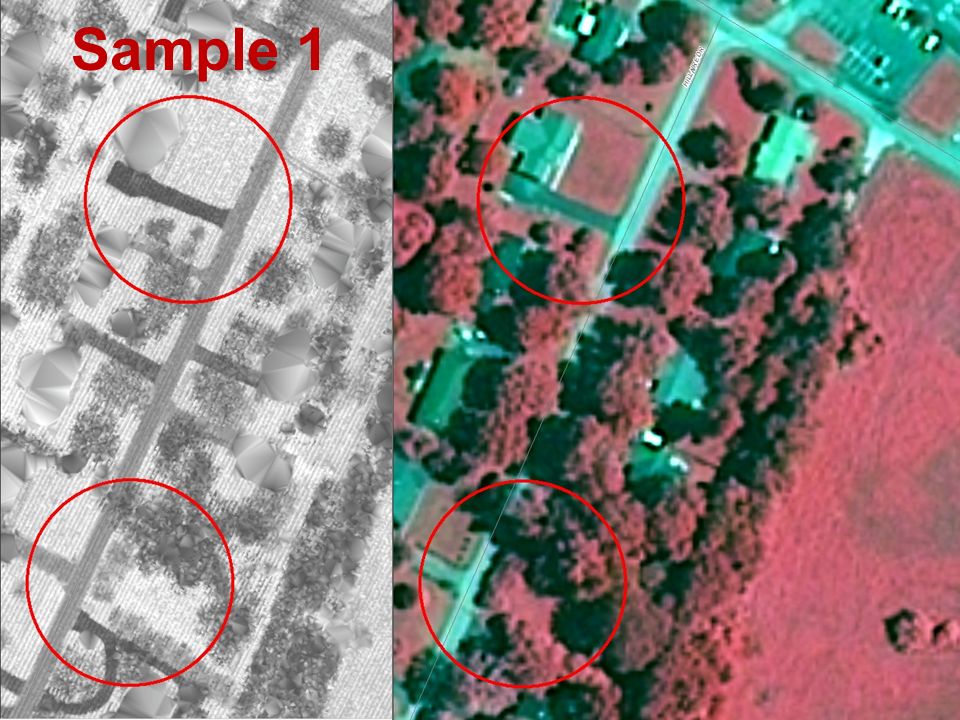
Sample 1

22
0.5-foot post spacing1.0-foot post spacing 2.0-foot post spacing

23
Sample 2

25
Sample 3

26
SAMPLE 1SAMPLE 2SAMPLE 3 POINT COUNT107802728511976 CLASSGROUND RETURNS TOTAL232 1ST.107697724011975 2ND.105401 3RD.05 AREA49084469979391487873 POINT DENSITY0.02200.00730.0080 ELEVATION AVERAGE169.4543.7600.5 MINIMUM165.3536.6566.9 MAXIMUM177.2550.3628.4 STD. DEV.3.33.413.4 COEFF. VAR.1.90.62.2 INTENSITY AVERAGE13.651.173.7 MINIMUM1.06.01.0 MAXIMUM188.0251.0255.0 STD. DEV.14.339.232.5 COEFF. VAR.105.176.844.2

27
-LiDAR data model different from usual “vector” and “raster -Contains both point and surface (image) information -INTENSITY more variable than ELEVATION - relates to surface properties and condition -Intensity surfaces can be fused with other data – leaf off CIR -3-D visualization exercises and products Summary/Conclusions
 information -INTENSITY more variable than ELEVATION - relates to surface properties and condition -Intensity surfaces can be fused with other data – leaf off CIR -3-D visualization exercises and products Summary/Conclusions")
28
Contact Information Demetrio P. Zourarakis demetrio.zourarakis@ky.gov 502-564-6246 http://gis.ky.gov

Similar presentations


>")