Download presentation
Presentation is loading. Please wait.

1
Dr BE Mostert Geneticist SA Stud Book The Genetics of Longevity… A Quantitative Perspective

2
Are there really genetic differences between cows ???

3
Production increased tremendously since 1930 NutritionNutrition ManagementManagement Genetic PotentialGenetic Potential

4
Genetic Potential Successful freezing of semen – AI industrySuccessful freezing of semen – AI industry Technology : Computers + GenomicsTechnology : Computers + Genomics Genetic Evaluations Breeding Values Accurate Selection

5
Milk : 62 kg / year Butterfat : 1.82 kg / year Protein : 1.99 kg / year

6
Selection for Milk Production had a negative effect on : Solid percentagesSolid percentages ReproductionReproduction HealthHealth Feed EfficiencyFeed Efficiency Intake CapacityIntake Capacity LongevityLongevity

7
Countries start to include secondary traits in TMIs Average Number of Lactations of SA Dairy Breeds Holstein : 2.92 Holstein : 2.92 Guernsey : 3.05 Guernsey : 3.05 Ayrshire : 3.13 Ayrshire : 3.13 Jersey :3.27 Jersey :3.27

8
Canada – Lifetime Profit Index

9
Germany-Austria-Luxembourg – Relativ Zuchtwert Gesamt

10
The Netherlands

11
New Zealand – Breeding Worth

12
Increased longevity - associated with decreased costs for raising or purchasing replacement females Proportion of mature cows increase as longevity increases - increase in the average production level in herds Economic importance of Herd Life is second to Production and therefore higher than that of other Functional or Non-productive traits Economic Importance of Longevity

13
Longevity is a measure of the success of a cow to survive either voluntary or involuntary culling Voluntary - Productive Longevity / Herd Life - Breeder decides – production, likability - Breeder decides – production, likability Involuntary - Functional Longevity / Herd Life - Longevity adjusted for production - Longevity adjusted for production - Cow determines moment of culling – - Cow determines moment of culling – - Diseases, poor reproduction, functional problems, death - Diseases, poor reproduction, functional problems, death

14
Statistically difficult to handle : Binary Trait : Dead / AliveBinary Trait : Dead / Alive Takes a long time to measureTakes a long time to measure Record complete only when cow diedRecord complete only when cow died Heritability is low (Literature : 0.01 – 0.13) Countries differ in definition and methodology Countries differ in definition and methodology Genetic Evaluation for Longevity
 Countries differ in definition and methodology Countries differ in definition and methodology Genetic Evaluation for Longevity")
15
Linear type traits are easy to measure, measured early in life, are moderate to highly heritable and known to be used as predictors for cow survival. Other traits, for example Somatic Cell Score and Fertility also play a key role in the survival of cows. These traits are often included in the genetic evaluation of Longevity, to increase the accuracy of prediction of Longevity EBVs. Direct – Survival Measurements Indirect – Indicator Traits

16
Lactation records up to 4 th parity, since 1975 Trait definition : HL1 : Survival up to 120 dim 1 st Lactation HL2 : Survival up to 240 dim 1 st Lactation HL3 : Survival up to 2 nd Lactation HL4 : Survival up to 3 rd Lactation HL5 : Survival up to 4 th Lactation Indicator traits included : SCS, FA & UD Indicator traits included : SCS, FA & UD Genetic Evaluation for FHL in SA

17
Genetic Parameters : Jerseys HL1HL2HL3HL4HL5SCSFAUD HL10.0040.9960.5090.6270.525-0.1900.0800.190 HL20.0070.5300.6290.529-0.1900.0760.191 HL30.0270.9560.983-0.2070.0630.366 HL40.0420.983-0.2410.0960.406 HL50.037-0.2180.0790.390 SCS0.0630.073-0.166 FA0.1110.473 UD0.125

18
Genetic Parameters : Jerseys HL1HL2HL3HL4HL5SCSFAUD HL10.0040.9960.5090.6270.525-0.1900.0800.190 HL20.0070.5300.6290.529-0.1900.0760.191 HL30.0270.9560.983-0.2070.0630.366 HL40.0420.983-0.2410.0960.406 HL50.037-0.2180.0790.390 SCS0.0630.073-0.166 FA0.1110.473 UD0.125

19
Genetic Parameters : Jerseys HL1HL2HL3HL4HL5SCSFAUD HL10.0040.9960.5090.6270.525-0.1900.0800.190 HL20.0070.5300.6290.529-0.1900.0760.191 HL30.0270.9560.983-0.2070.0630.366 HL40.0420.983-0.2410.0960.406 HL50.037-0.2180.0790.390 SCS0.0630.073-0.166 FA0.1110.473 UD0.125

20
Genetic Parameters : Jerseys HL1HL2HL3HL4HL5SCSFAUD HL10.0040.9960.5090.6270.525-0.1900.0800.190 HL20.0070.5300.6290.529-0.1900.0760.191 HL30.0270.9560.983-0.2070.0630.366 HL40.0420.983-0.2410.0960.406 HL50.037-0.2180.0790.390 SCS0.0630.073-0.166 FA0.1110.473 UD0.125

21
Genetic Parameters : Jerseys HL1HL2HL3HL4HL5SCSFAUD HL10.0040.9960.5090.6270.525-0.1900.0800.190 HL20.0070.5300.6290.529-0.1900.0760.191 HL30.0270.9560.983-0.2070.0630.366 HL40.0420.983-0.2410.0960.406 HL50.037-0.2180.0790.390 SCS0.0630.073-0.166 FA0.1110.473 UD0.125

22
Cows with high SCS are less likely to survive than cows with low SCS Importance of SCS in influencing culling decisions increase with parity Cows with extremely low scores for UD (deep udders) are at much higher risk of culling than cows with high scores (shallow udders) Cows with low FA scores more likely to be culled – not as important as UD
 are at much higher risk of culling than cows with high scores (shallow udders) Cows with low FA scores more likely to be culled – not as important as UD")
23
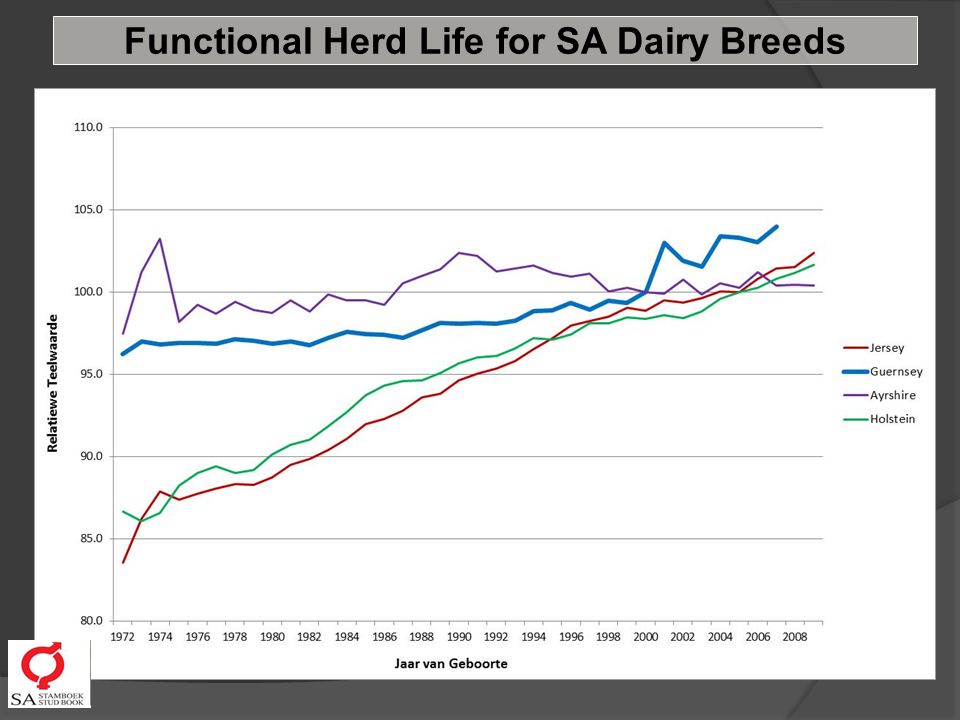
Functional Herd Life for SA Dairy Breeds

26
Holsteins : 0.41 / year

27
Functional Herd Life for SA Dairy Breeds Jerseys : 0.46 / year

28
Logix Milk GE system – Validated by INTERBULL Participation in Direct Longevity Interbull Evaluations : 6 Dairy Breeds 21 Countries International Participation

29
AUSCANDFSNLDNZLUSAGBRZAF AUS1446546342334150141 CAN0.41492414021311091 DFS0.700.64619410411177 NLD0.530.710.6960686153 NZL0.610.360.570.45349164150 USA0.690.820.78 0.60176200 GBR0.450.860.730.670.440.81121 ZAF0.300.580.530.580.300.620.88 International Participation Genetic Correlations and common sires for the Jersey breed amongst cnts

30
AUSCANDFSNLDNZLUSAGBRZAF AUS1446546342334150141 CAN0.41492414021311091 DFS0.700.64619410411177 NLD0.530.710.6960686153 NZL0.610.360.570.45349164150 USA0.690.820.78 0.60176200 GBR0.450.860.730.670.440.81121 ZAF0.300.580.530.580.300.620.88 International Participation Genetic Correlations and common sires for the Jersey breed amongst cnts

31
AUSCANDFSNLDNZLUSAGBRZAF AUS1446546342334150141 CAN0.41492414021311091 DFS0.700.64619410411177 NLD0.530.710.6960686153 NZL0.610.360.570.45349164150 USA0.690.820.78 0.60176200 GBR0.450.860.730.670.440.81121 ZAF0.300.580.530.580.300.620.88 International Participation Genetic Correlations and common sires for the Jersey breed amongst cnts

32
AUSCANDFSNLDNZLUSAGBRZAF AUS1446546342334150141 CAN0.41492414021311091 DFS0.700.64619410411177 NLD0.530.710.6960686153 NZL0.610.360.570.45349164150 USA0.690.820.78 0.60176200 GBR0.450.860.730.670.440.81121 ZAF0.300.580.530.580.300.620.88 International Participation Genetic Correlations and common sires for the Jersey breed amongst cnts

33
Variation in Functional Herd Life EBVs HolsteinJersey BullsCowsBullsCows Min75797762 Max121119127122 Avg101.499.9103.2101.4 SD6.24.76.16.0

34
To Conclude … Longevity do have a genetic component Progress slow Included in SA TMIs : Jersey SAINET 10 % Jersey SAINET : 10 % Holstein LMI : 20% Ayrshire LMI : 21% Guernsey LMI : 20%

35
THANK YOU !!!!!

Similar presentations


 Beef Butterfat Cattle by-products Crossbreeding Culling Dairy Herd Improvement.>")

 Historical examination of culling of dairy cows from herds in the United States H. DUANE NORMAN, E. HARE, and J.R. WRIGHT.>")

 production and physical characteristics.>")


 H.D. NORMAN* ( 301-504-8334 ), R.H. MILLER, P.M. V AN RADEN, and J.R. WRIGHT Animal Improvement Programs.>")
 2005 Status of Dairy Cattle Breeding in the United States Dr. H. Duane Norman Animal Improvement Programs Laboratory Agricultural Research Service,>")

