Download presentation
Presentation is loading. Please wait.

1
Appraisal, Extraction and Pooling of Quantitative Data for Reviews of Effects - from experimental, observational and descriptive studies JBI/CSRTP/2013-14/0002

2
Introduction Recap of Introductory module – Developing a question (PICO) – Inclusion Criteria – Search Strategy – Selecting Studies for Retrieval This Module considers how to appraise, extract and synthesize evidence from experimental, observational and descriptive studies.
 – Inclusion Criteria – Search Strategy – Selecting Studies for Retrieval This Module considers how to appraise, extract and synthesize evidence from experimental, observational and descriptive studies.")
3
Program Overview Day 1 TimeSessionGroup Work 0900Introductions and overview of Module 3 0930Session 1: The Critical Appraisal of Studies 1000Morning Tea 1030 Session 2: Appraising RCTs and experimental studies Group Work 1: Critically appraising RCTs and experimental studies. Report back 1145Session 3: Appraising observational Studies 1230Lunch 1330 Group Work 2: Critically appraising observational studies. Report back 1415Session 4: Study data and data extraction 1515Afternoon tea 1530Group Work 3: Data extraction. Report back 1600Session 5: Protocol developmentProtocol development 1700End

4
Program Overview Day 2 TimeSessionGroup Work 0900Overview of Day 1 0915Session 6: Data analysis and meta-analysis 1030Morning Tea 1100 Session 7: Appraisal extraction and synthesis using JBI MAStARI Group Work 4: MAStARI trial. Report back 1230Lunch 1330Session 8: Protocol DevelopmentProtocol development 1415Session 9: AssessmentMCQ Assessment 1445Afternoon tea 1500Session 10: Protocol PresentationsProtocol Presentations 1700End

5
Session 1: The Critical Appraisal of Studies

6
Why Critically Appraise? Combining results of poor quality research may lead to biased or misleading estimates of effectiveness 1004 references 832 references Scanned Ti/Ab 172 duplicates 117 studies retrieved 715 do not meet Incl. criteria 82 do not meet Incl. criteria 35 studies for Critical Appraisal

7
The Aims of Critical Appraisal To establish validity – to establish the risk of bias

8
Internal & External Validity Internal Validity External Validity Relationship between IV and EV? Used locally?

9
Strength & Magnitude Strength Magnitude & Precision How internally valid is the study? How large is the effect?

10
Clinical Significance and Magnitude of Effect Pooling of homogeneous studies of effect or harm Weigh the effect with cost/resource of change Determine precision of estimate

11
Assessing Methodological Quality Numerous tools are available for assessing methodological quality of clinical trials and observational studies. JBI requires the use of a specific tool for assessing risk of bias in each included study. ‘High quality’ research methods can still leave a study at important risk of bias (e.g. when blinding is impossible). Some markers of quality are unlikely to have direct implications for risk of bias (e.g. ethical approval, sample size calculation).
. Some markers of quality are unlikely to have direct implications for risk of bias (e.g. ethical approval, sample size calculation)..")
12
Sources of Bias Selection; Performance; Detection; and Attrition.

13
Selection Bias Systematic differences between participant characteristics at the start of a trial. Systematic differences occur during allocation to groups. Can be avoided by concealment of allocation of participants to groups.

14
Type of biasQuality assessment Population Allocation SelectionAllocation concealment TreatmentControl

15
Performance Bias Systematic differences in the intervention of interest, or the influence of concurrent interventions. Systematic differences occur during the intervention phase of a trial. Can be avoided by blinding of investigators and/or participants to group.

16
Type of biasQuality assessment Population Allocation SelectionAllocation concealment TreatmentControl PerformanceBlindingExposed to intervention Not exposed

17
Detection Bias Systematic differences in how the outcome is assessed between groups. Systematic differences occur at measurement points during the trial. Can be avoided by blinding of outcome assessor.

18
Type of biasQuality assessment Population Allocation SelectionAllocation concealment TreatmentControl PerformanceBlindingExposed to intervention Not exposed DetectionBlindingPopulation

19
Attrition Bias Systematic differences in withdrawals and exclusions between groups. Can be avoided by: – Accurate reporting of losses and reasons for withdrawal – Use of ITT analysis

20
Type of biasQuality assessment Population Allocation SelectionAllocation concealment TreatmentControl PerformanceBlindingExposed to intervention Not exposed DetectionBlindingPopulation AttritionITT follow upFollow up

21
Ranking the “Quality” of Evidence of Effectiveness To what extent does the study design minimize bias/demonstrate validity. Generally linked to actual study design in ranking evidence of effectiveness. Thus, a “hierarchy” of evidence is most often used, with levels of quality equated with specific study designs.

22
JBI Levels of Evidence - Effectiveness Level of Evidence Effectiveness E (1-4) 1SR (with homogeneity) of experimental studies (e.g. RCT with concealed allocation) OR 1 or more large experimental studies with narrow confidence intervals 2One or more smaller RCTs with wider confidence intervals OR Quasi-experimental studies (e.g. without randomisation) 33a. Cohort studies (with control group) 3b. Case-controlled 3c. Observational studies (without control groups) 4Expert opinion, or based on physiology, bench research or consensus
 OR 1 or more large experimental studies with narrow confidence intervals 2One or more smaller RCTs with wider confidence intervals OR Quasi-experimental studies (e.g. without randomisation) 33a. Cohort studies (with control group) 3b. Case-controlled 3c. Observational studies (without control groups) 4Expert opinion, or based on physiology, bench research or consensus.")
23
The Critical Appraisal Process Every review must set out to use an explicit appraisal process. Essentially, – A good understanding of research design is required in appraisers; and – The use of an agreed checklist is usual.

24
Session 2: Appraising RCTs and experimental studies

25
RCTs RCTs and quasi (pseudo) RCTs provide the most robust form of evidence for effects – Ideal design for experimental studies They focus on establishing certainty through measurable attributes They provide evidence related to: – whether or not a causal relationship exists between a stated intervention, and a specific, measurable outcome, and – the direction and strength of the relationship These characteristics are associated with the reliability and generalizability of experimental studies
 RCTs provide the most robust form of evidence for effects – Ideal design for experimental studies They focus on establishing certainty through measurable attributes They provide evidence related to: – whether or not a causal relationship exists between a stated intervention, and a specific, measurable outcome, and – the direction and strength of the relationship These characteristics are associated with the reliability and generalizability of experimental studies")
26
Randomized Controlled Trials Evaluate effectiveness of a treatment/therapy/ intervention. Randomization critical. Properly performed RCTs reduce bias, confounding factors, and results by chance.

27
Experimental studies Three essential elements – Randomization (where possible). – Researcher-controlled manipulation of the independent variable. – Researcher control of the experimental situation.

28
Other experimental studies Quasi-experiments without a true method of randomization to treatment groups Quasi experiments – Quasi-experimental designs without control groups – Quasi-experimental designs that use control groups but not pre-tests – Quasi-experimental designs that use control groups and pre-tests

29
Sampling Selecting participants from population. Inclusion/exclusion criteria. Sample should represent the population.

30
Sampling Methods Probabilistic (Random) sampling Consecutive Systematic Convenience
 sampling Consecutive Systematic Convenience")
31
Randomization

32
Randomization Issues Simple methods may result in unequal group sizes – Tossing a coin or rolling a dice – Block randomization Confounding factors due to chance imbalances – stratification – prior to randomization – ensures that important baseline characteristics are even in both groups

33
Block Randomization All possible combinations ignoring unequal allocation 1 AABB4 BABA 2 ABAB5 BAAB 3 ABBA6 BBAA Use table of random numbers and generate allocation from sequence e.g. 533 2871 Minimize bias by changing block size

34
Stratified Randomization

35
Blinding Method to eliminate bias from human behaviour Applies to participants, investigators, assessors etc Blinding of allocation Single, double and triple blinded

36
Schulz, 2002 Blinding

37
Intention to Treat ITT analysis is an analysis based on the initial treatment intent, not on the treatment eventually administered. Avoids various misleading artifacts that can arise in intervention research. – E.g. if people who have a more serious problem tend to drop out at a higher rate, even a completely ineffective treatment may appear to be providing benefits if one merely compares those who finish the treatment with those who were enrolled in it. Everyone who begins the treatment is considered to be part of the trial, whether they finish it or not.

38
Minimizing Risk of Bias Randomization; Allocation; Blinding; and Intention to treat (ITT) analysis.
 analysis.")
39
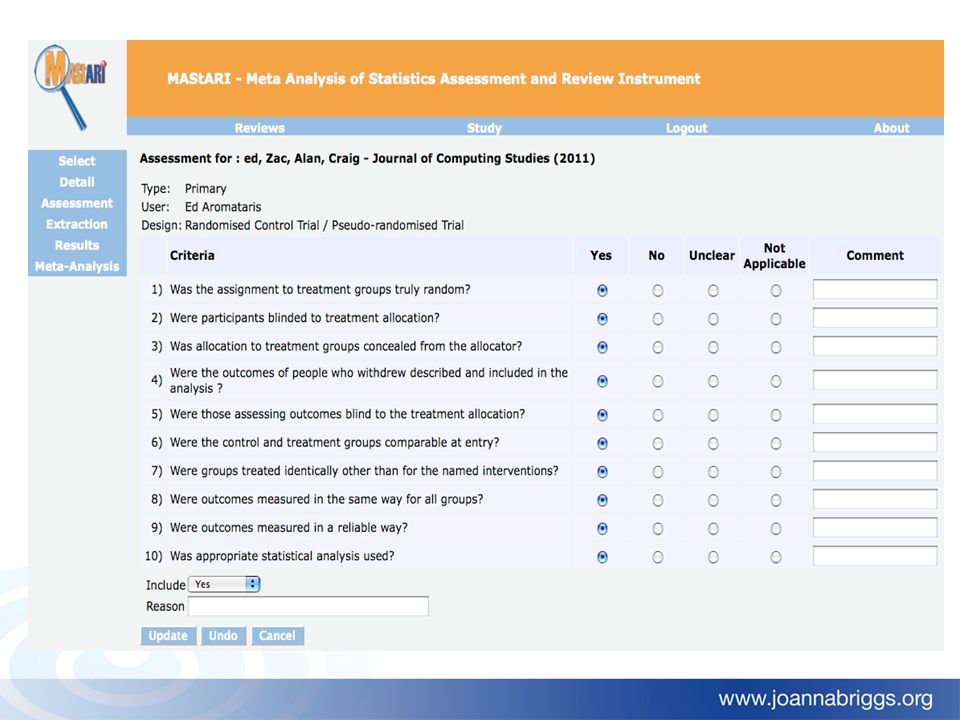
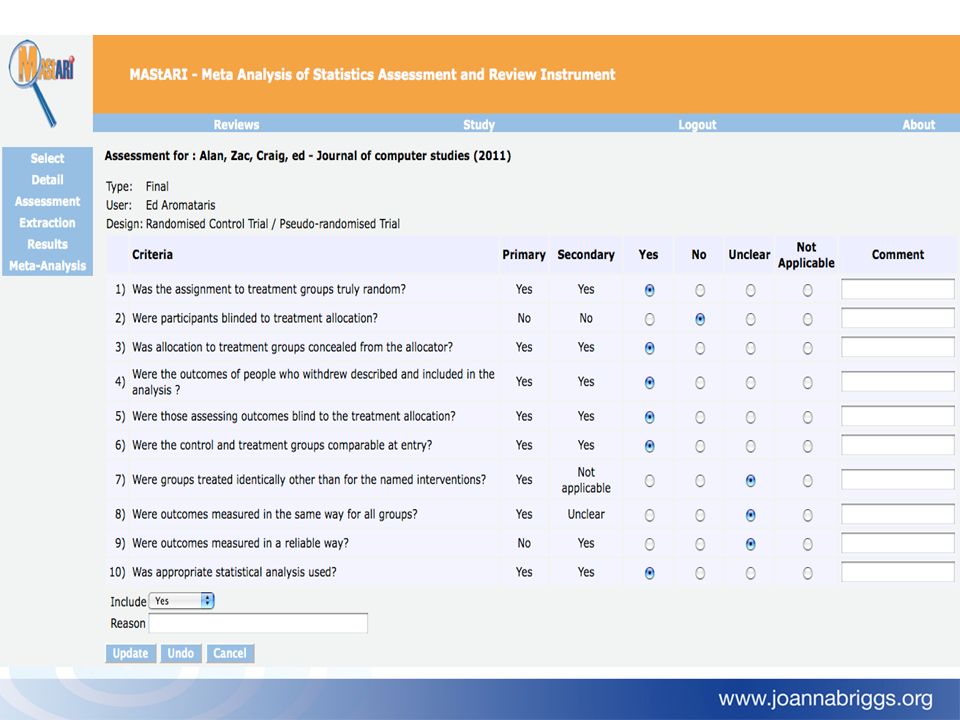
Appraising RCTs/quasi experimental studies JBI-MAStARI Instrument

40
Assessing Study Quality as a Basis for Inclusion in a Review Included studies Excluded studies poor quality cut off point high quality

41
Group Work 1 Working in pairs, critically appraise the two papers in your workbook Reporting Back

42
Session 3: Appraising Observational Studies

43
Rationale and potential of observational studies as evidence Account for majority of published research studies Need to clarify what designs to include Need appropriate critical appraisal/quality assessment tools Concerns about methodological issues inherent to observational studies – Confounding, biases, differences in design – Precise but spurious results

44
Appraisal of Observational Studies Critical appraisal and assessment of quality is often more difficult than RCTs. Using scales/checklists developed for RCTs may not be appropriate. Specific tools are available to appraise observational research.

45
Confounding Factors The apparent effect is not the true effect. May be other factors relevant to outcome in question. Can be important threat to validity of results. Adjustments for confounding factors can be made – E.g. has multivariate analysis been conducted? Authors often look for plausible explanation for results.

46
Bias Selection bias – differ from population with same condition. Follow up bias – attrition may be due to differences in outcome. Measurement/detection bias – knowledge of outcome may influence assessment of exposure and vice versa.

47
Observational Studies - Types Cohort studies Case-control studies Case series/case report Cross-sectional studies

48
Cohort Studies Group of people who share common characteristic. Useful to determine natural history and incidence of disorder or exposure. Two types – prospective (longitudinal) – retrospective (historic) Aid in studying causal associations.
 – retrospective (historic) Aid in studying causal associations..")
49
Prospective Cohort Studies Taken from Tay & Tinmouth, 2007

50
Prospective Cohort Studies Longitudinal observation through time Allows investigation of rare diseases or long latency Expensive Increased likelihood of attrition Long time to see useful data

51
Retrospective Cohort Studies Taken from Tay & Tinmouth, 2007

52
Retrospective Cohort Studies Mainly data collection No follow up through time Cheaper, faster

53
Case-Control Studies Cases’ already have disease/condition Controls’ don’t have disease/condition Otherwise matched to control confounders Frequently used Rapid means of study of risk factors Sometimes referred to as retrospective study

54
Case-Control Studies Biomedical Library, University of Minnesaota, 2002

55
Case-Control Study Inexpensive Little manpower required Fast No indication of absolute risk

56
Case series/Case reports Tracks patients given similar treatment – prospective Examines medical records for exposure and outcome – retrospective Detailed report of individual patient May identify new diseases and adverse effects

57
Case series/Case reports

58
Cross-sectional Studies Takes ‘slice’ or ‘snapshot’ of target group Frequency and characteristics of disease/variables in a population at a point in time Often use survey research methods Also called prevalence studies

59
Appraising comparable Cohort and Case- control studies JBI-MAStARI Instrument

60
Appraising descriptive/case series studies JBI-MAStARI Instrument

61
Group Work 2 Working in pairs: – critically appraise the cohort study in your workbook – critically appraise the case control study in your workbook Reporting Back

62
Session 4: Study data and Data Extraction

63
Considerations in Data Extraction Source - citation and contact details Eligibility - confirm eligibility for review Methods - study design, concerns about bias Participants - total number, setting, diagnostic criteria Interventions - total number of intervention groups Outcomes - outcomes and time points Results - for each outcome of interest: sample size, etc Miscellaneous - funding source, etc

64
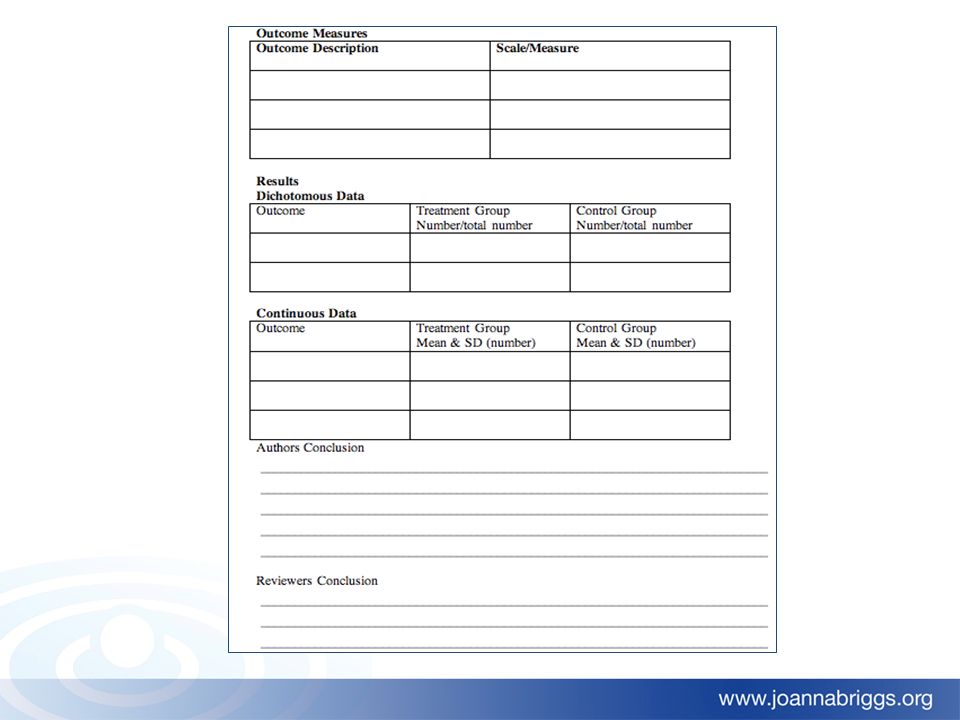
Quantitative Data Extraction The data extracted for a systematic review are the results from individual studies specifically related to the review question. Difficulties related to the extraction of data include : – different populations used – different outcome measures – different scales or measures used – interventions administered differently – reliability of data extraction (i.e: between reviewers)
.")
65
Minimizing Error in Data Extraction Strategies to minimize the risk of error when extracting data from studies include: – utilizing the standard JBI data extraction form. – pilot testing the extraction form prior to commencement of the review. – training and assessing data extractors

66
Data most frequently extracted 1004 references 832 references Scanned Ti/Ab 172 duplicates 117 studies retrieved 715 do not meet Incl. criteria 82 do not meet Incl. criteria 35 studies for Critical Appraisal 26 studies incl. in review 9 excluded studies

67
Outcome Data: Effect of Treatment or Exposure Dichotomous – Effect/no effect – Present/absent Continuous – Interval or ratio level data – BP, HR, weight, etc

68
What do you want to know? Is treatment X more effective than treatment Y? Is exposure to X more likely to result in an outcome or not? How many people need to receive an intervention before someone benefits or is harmed?

69
Risk Risk= # times something happens # opportunities for it to happen “Risk” of birthing baby boy? – One boy is born for every 2 opportunities: 1/2 =.5 That is: 50% probability (risk) of having a boy One of every 100 persons treated with aspirin for a headache, has a side-effect, 1/100 =.01
 of having a boy One of every 100 persons treated with aspirin for a headache, has a side-effect, 1/100 =.01.")
70
Relative Risk (RR) Ratio of risk in exposed group to risk in not exposed group – The RR of feeling better with treatment with i.m. magnesium injection for chronic fatigue syndrome = the risk of improvement for chronic fatigue patients treated with i.m. magnesium divided by those patients treated with placebo.

71
‘Risk’ of improvement on magnesium= 12/ 15 = 0.80 ‘Risk’ of improvement on placebo= 3/ 17 = 0.18 Relative risk (of improvement on Mg 2+ therapy vs placebo) = 0.80/0.18 = 4.5 Thus patients on magnesium therapy are 4 times more likely to feel better on magnesium rather than placebo RR example A trial examined whether patients with chronic fatigue syndrome improved 6 weeks after treatment with i.m. magnesium. The group who received the magnesium were compared to a placebo group and the outcome was feeling better

72
Interpreting Relative Risk What does a relative risk of 1 mean? – That there is no difference in risk in the two groups. – In the magnesium example it would mean that patients are as likely to “feel better” on magnesium as on placebo – If there was no difference between the groups the confidence interval would include 1 It is important to know whether relative or absolute risk is being presented as this influences the way in which it is interpreted

73
Treatment ATreatment B Success Failure 0.96 0.04 0.99 0.01 Issues with RR – defining success If the outcome of interest is success then RR=0.96/0.99=0.97 If the outcome of interest is failure then RR=0.04/0.01=4

74
Absolute Risk Difference Is the absolute additional risk of an event due to an exposure. – Risk in exposed group minus risk in unexposed (or differently exposed group). Absolute risk reduction (ARR) = P exposed - P unexposed If the absolute risk is increased by an exposure we sometimes use the term Absolute Risk Increase (ARI)
. Absolute risk reduction (ARR) = P exposed - P unexposed If the absolute risk is increased by an exposure we sometimes use the term Absolute Risk Increase (ARI).")
75
ARR example From the previous example of comparing magnesium therapy and placebo: ‘ Risk’ of improvement on magnesium= 12/ 15 = 0.80 ‘Risk’ of improvement on placebo= 3/ 17 = 0.18 Absolute risk reduction = 0.80 - 0.18 = 0.62

76
Number Needed to Treat The additional number of people you would need to give a new treatment to in order to cure one extra person compared to the old treatment. For a harmful exposure, the number needed to harm is the additional number of individuals who need to be exposed to the risk in order to have one extra person develop the disease, compared to the unexposed group. – Number needed to treat= 1 / ARR – Number needed to harm= 1 / ARR, ignoring negative sign.

77
NNT example From the previous example of comparing magnesium therapy and placebo: ‘Risk’ of improvement on magnesium= 12/ 15 = 0.80 ‘Risk’ of improvement on placebo= 3/ 17 = 0.18 Absolute risk reduction = 0.80 - 0.18 = 0.62 Number needed to treat (to benefit) = 1 / 0.62 = 1.61 ~ 2 Thus on average one would give magnesium to 2 patients in order to expect one extra patient (compared to placebo) to feel better
 = 1 / 0.62 = 1.61 ~ 2 Thus on average one would give magnesium to 2 patients in order to expect one extra patient (compared to placebo) to feel better")
78
Odds Odds = # times something happens # times it does not happen What are the odds of birthing a boy? – For every 2 births, one is a boy and one isn’t 1/1 = 1 That is: odds are even One of every 100 persons treated with aspirin for a headache, has a side-effect, 1/99 =.0101

79
OR example From the previous example of comparing magnesium therapy and placebo: Odds of improvement on magnesium= 12/3 = 4.0 Odds of improvement on placebo= 3/14 = 0.21 Odds ratio (of Mg 2+ vs placebo) = 4.0 / 0.21 = 19.0 Therefore, improvement was 19 times more likely in the Mg 2+ group than the placebo group.
 = 4.0 / 0.21 = 19.0 Therefore, improvement was 19 times more likely in the Mg 2+ group than the placebo group.")
80
Relative Risk and Odds Ratio The odds ratio can be interpreted as a relative risk when an event is rare and the two are often quoted interchangeably This is because when the event is rare (b+d)→ d and (a+c)→c. – Relative risk = a(a+c) / b(b+d) – Odds ratio = ac / bd
 / b(b+d) – Odds ratio = ac / bd.")
81
Relative Risk and Odds Ratio For case-control studies it is not possible to calculate the RR and thus the OR is used. For cohort and cross-sectional studies, both can be derived. OR have mathematical properties which makes them more often quoted for formal statistical analyses

82
Continuous data Means, averages, change scores etc. – E.g. BP, plasma protein concentration, Any value often within a specified range Mean, Standard deviation, N Often only the standard error, SE, presented SD = SE x √ N

83
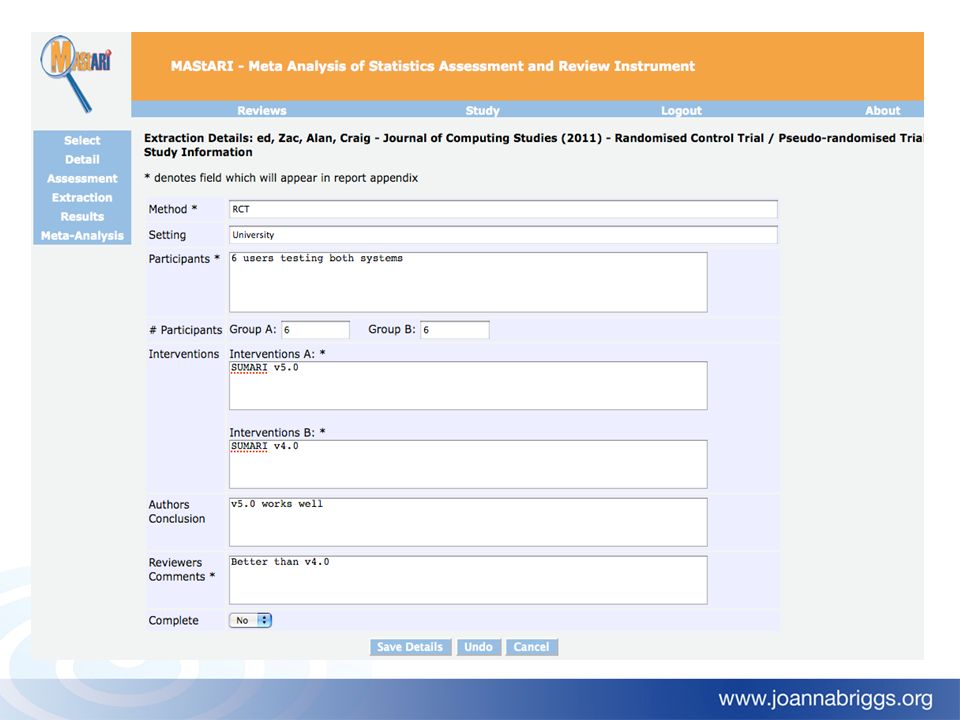
MAStARI Data Extraction Instrument

85
Group Work 3 Working in pairs: – Extract the data from the two papers in your workbook Reporting Back

86
Session 5: Protocol development

87
Program Overview Day 2 TimeSessionGroup Work 0900Overview of Day 1 0915Session 6: Data analysis and meta-analysis 1030Morning Tea 1100 Session 7: Appraisal extraction and synthesis using JBI MAStARI Group Work 4: MAStARI trial. Report back 1230Lunch 1330Session 8: Protocol DevelopmentProtocol development 1415Session 9: AssessmentMCQ Assessment 1445Afternoon tea 1500Session 10: Protocol PresentationsProtocol Presentations 1700End

88
Overview Recap Day 1 – Critical appraisal – Study design – Type of studies (experimental and observational) – Data extraction Today focus is on data analysis and synthesis.
 – Data extraction Today focus is on data analysis and synthesis.")
89
Session 6: Data Analysis and Meta- synthesis/Meta-analysis

90
General Analysis - What Can be Reported and How – What interventions/activities have been evaluated; – The effectiveness/appropriateness/feasibility of the intervention/activity; – Contradictory findings and conflicts; – Limitations of study methods; – Issues related to study quality; – The use of inappropriate definitions; – Specific populations excluded from studies; and – Future research needs.

91
Meta Analysis 1004 references 832 references Scanned Ti/Ab 172 duplicates 117 studies retrieved 715 do not meet Incl. criteria 82 do not meet Incl. criteria 35 studies for Critical Appraisal 26 studies incl. in review 6 studies incl. in meta analysis 20 studies incl. in narrative 9 excluded studies

92
Statistical methods for meta-analysis Quantitative method of combining results of independent studies Aim is to increase precision of overall estimate Investigate reasons for differences in risk estimates between studies Discover patterns of risk amongst studies

93
When is meta-analysis useful? If studies report different treatment effects. If studies are too small (insufficient power) to detect meaningful effects. Single studies rarely, if ever, provide definitive conclusions regarding the effectiveness of an intervention.
 to detect meaningful effects. Single studies rarely, if ever, provide definitive conclusions regarding the effectiveness of an intervention..")
94
When meta-analysis can be used Meta analysis can be used if studies: – have the same population – use the same intervention administered in the same way. – measure the same outcomes Homogeneity – studies are sufficiently similar to estimate an average effect.

95
Calculating an Overall Effect Estimate Odds Ratio – for dichotomous data e.g. the outcome present or absent – 51/49 = 1.04 – (no difference between groups = 1) Weighted mean difference – Continuous data, such as weight – (no difference between groups = 0) Confidence Interval – The range in which the real result lies, with the given degree of certainty
 Weighted mean difference – Continuous data, such as weight – (no difference between groups = 0) Confidence Interval – The range in which the real result lies, with the given degree of certainty.")
96
Confidence Intervals Confidence intervals are an indication of how precise the findings are Sample size greatly impacts the CI – the larger the sample size the smaller the CI, the greater the power and confidence of the estimate

97
CIs indicate: When calculated for OR, the CI provides the upper and lower limit of the odds that a treatment may or may not work If the odds ratio is 1, odds are even and therefore, not significantly different – recall the odds of having a boy

99
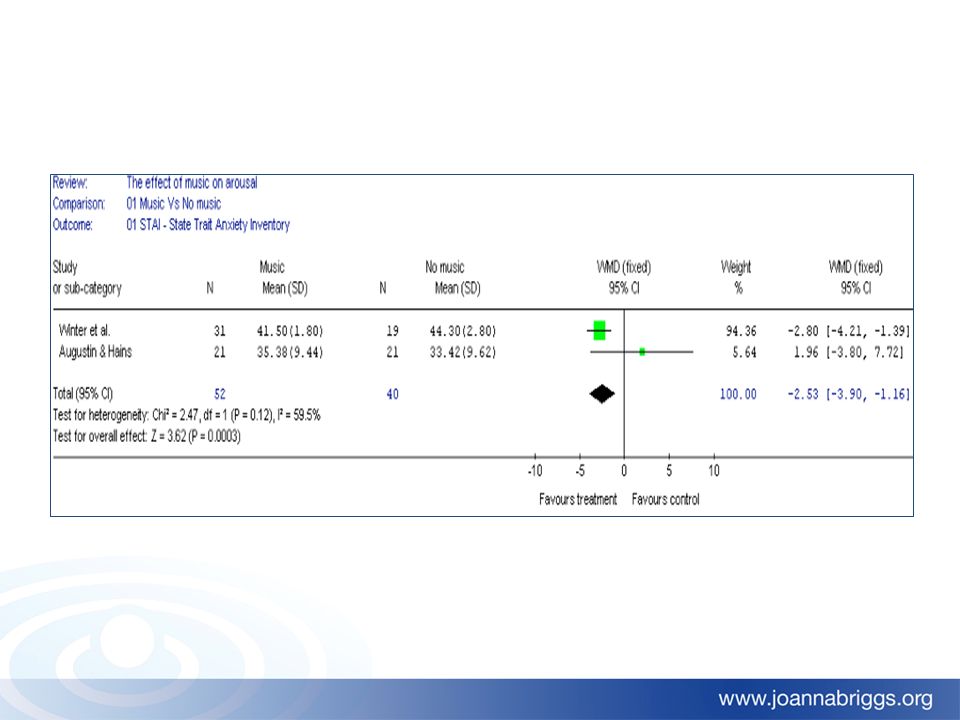
Favours treatmentFavours control No effect Results of different studies combined The Meta-view Graph

100
Heterogeneity Is it appropriate to combine or pool results from various studies? Different methodologies? Different outcomes measured? Problem greater in observational then clinical studies

101
Favours treatmentFavours control No effect Difference between studies Heterogeneity

102
Tests of Heterogeneity Measure extent to which observed study outcomes differ from calculated study outcome Visually inspect Forest Plot. Size of CI 2 Test for homogeneity or Q Test can be used – low power (use p < 0.1 or 0.2)
.")
103
Favours treatmentFavours control No effect Studies too small to detect any effect Insufficient Power

104
Meta-analysis Overall summary measure is a weighted average of study outcomes. Weight indicates influence of study. Study on more subjects is more influential. CI is measure of precision. CI should be smaller in summary measure.

105
Subgroup analysis Some participants, intervention or outcome you thought were likely to be quite different to the others Should be specified in advance in the protocol Only if there are good clinical reasons Two types Between trial – trials classified into subgroups Within trial – each trial contributes to all subgroups

106
Taken from Egger, M. et al. BMJ 1998;316:140-144 Example subgroup analysis

107
Sensitivity Analysis Exclude and/or include individual studies in the analysis Establish whether the assumptions or decisions we have made have a major effect on the results of the review ‘Are the findings robust to the method used to obtain them?’

108
Meta-analysis Statistical methods – Fixed effects model – Random effects model

109
Fixed Effects Model All included studies measure same outcome Assume any difference observed is due to chance – no inherent variation in source population – variation within study, not between studies Inappropriate where there is heterogeneity present CI of summary measure reflects variability between patients within sample

110
Random Effects Model Assumed studies are different and outcome will fluctuate around own true value – true values drawn randomly from population – variability between patients within study and from differences between studies Overall summary outcome is estimate of mean from which sample of outcomes was drawn More commonly used with observational studies due to heterogeneity

111
Random Effects Model Summary value will often have wider CI than with fixed effects model Where no heterogeneity results of two methods will be similar If heterogeneity present may be best to do solely narrative systematic review

112
Session 7: Appraisal, extraction and synthesis using JBI-MAStARI

113
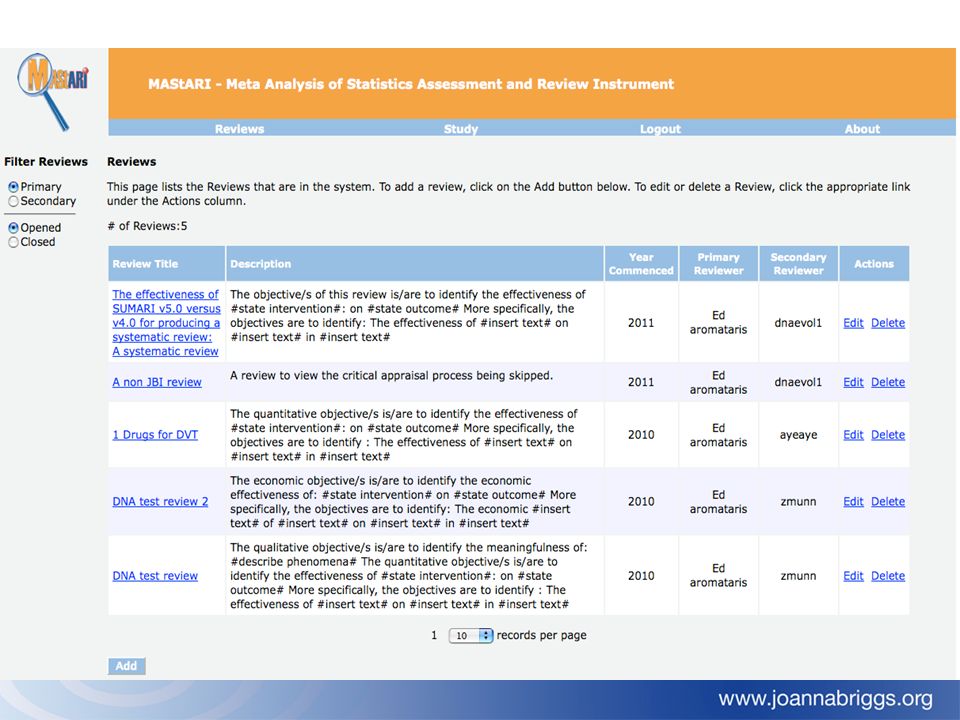
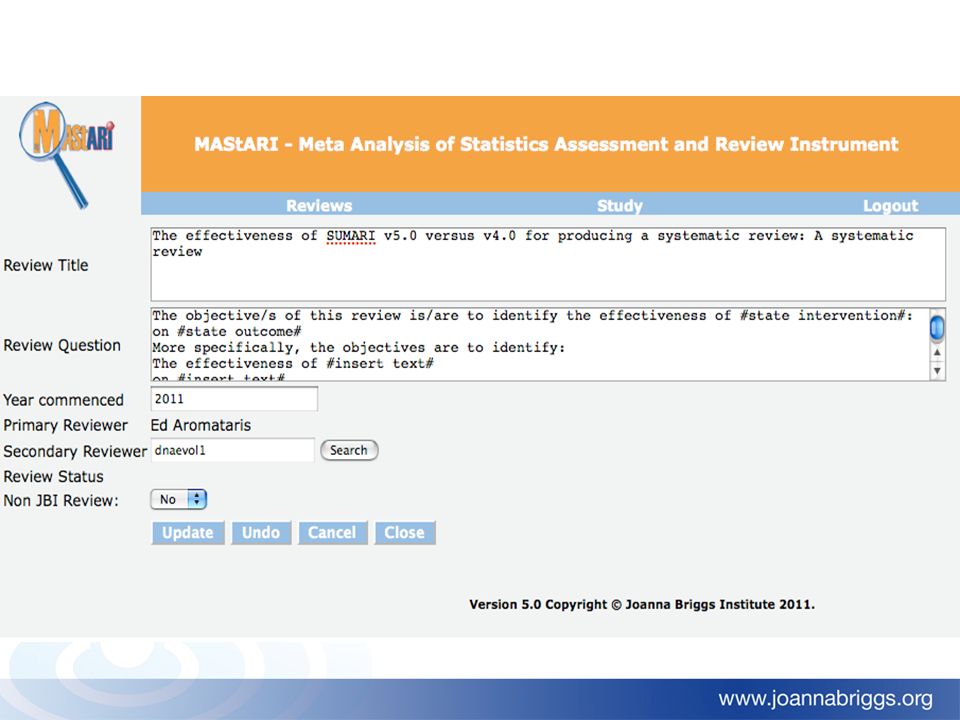
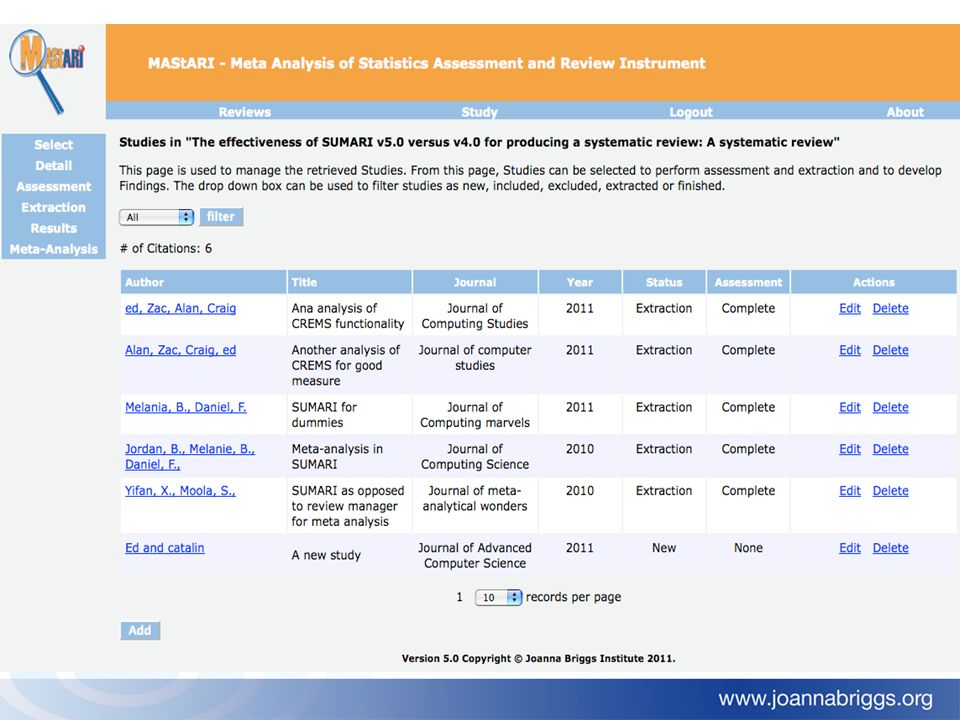
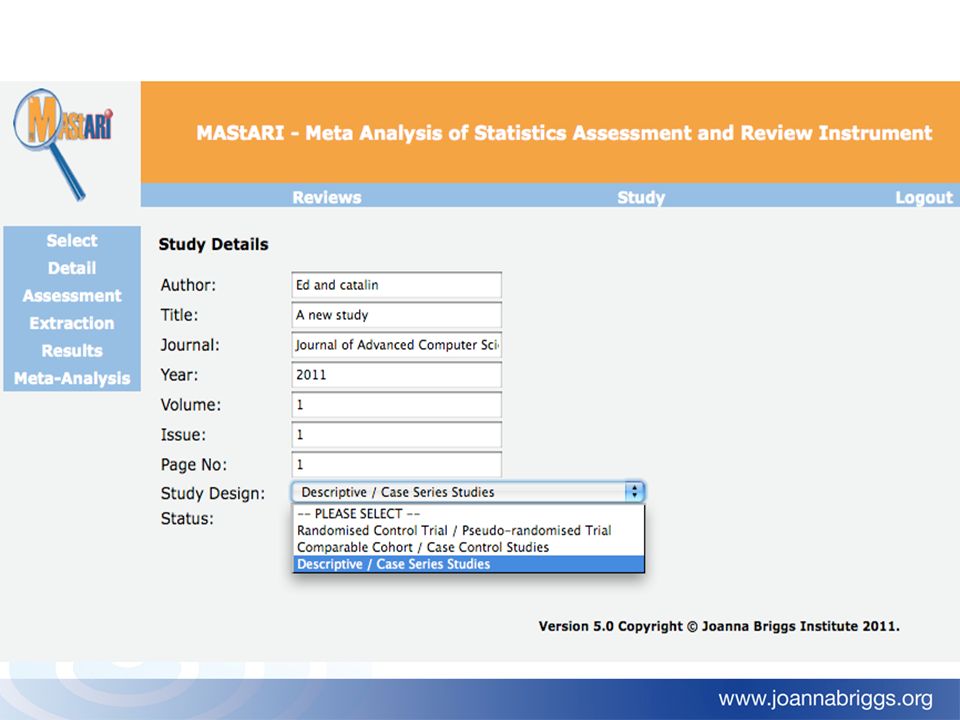
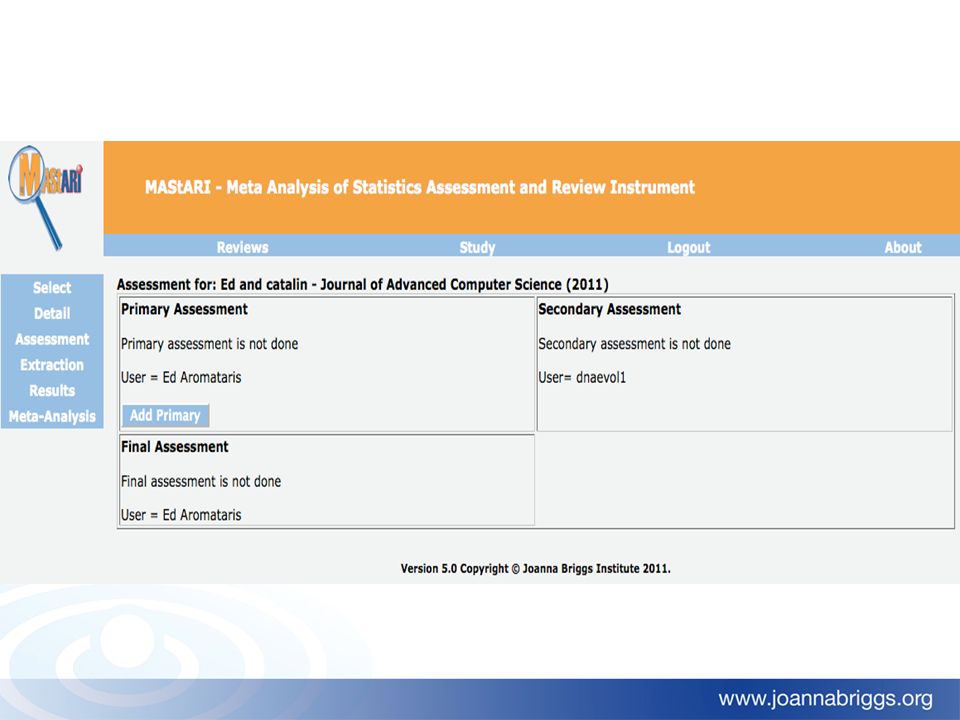
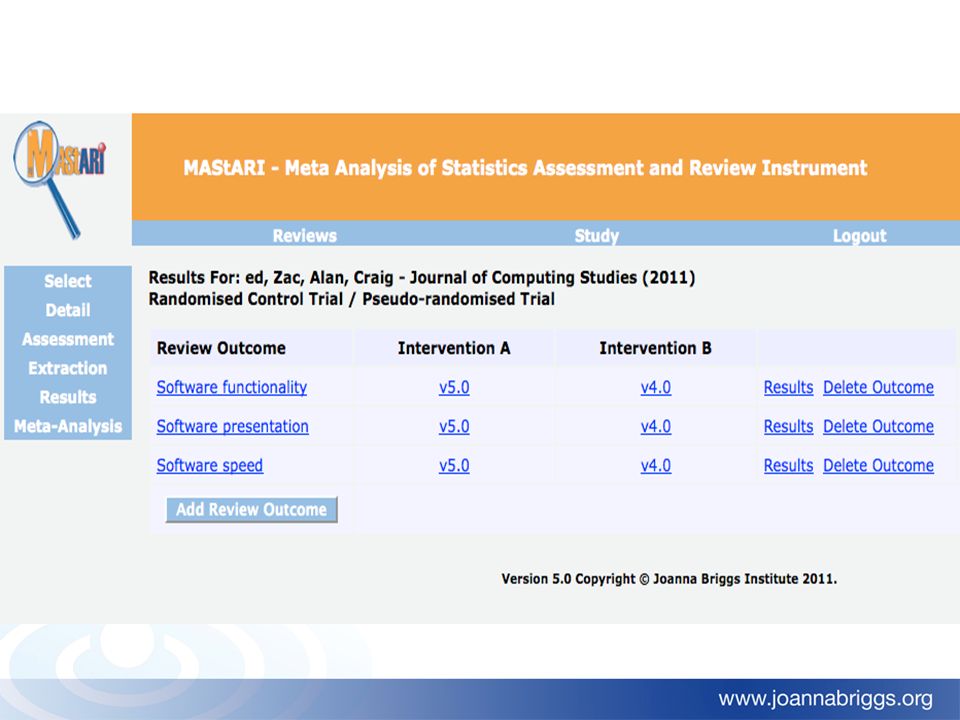
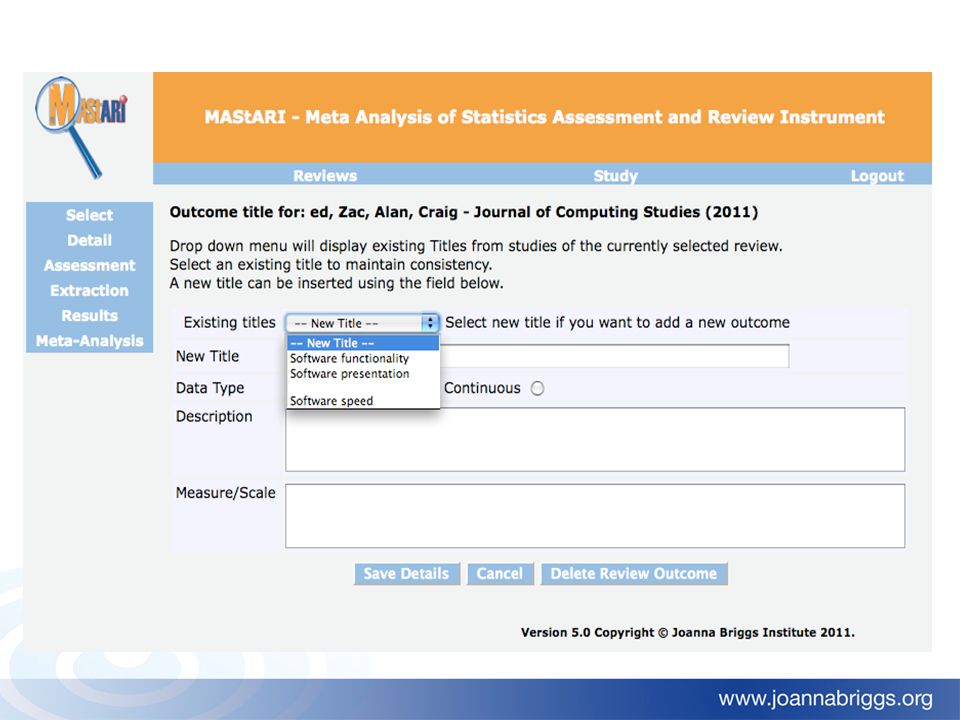
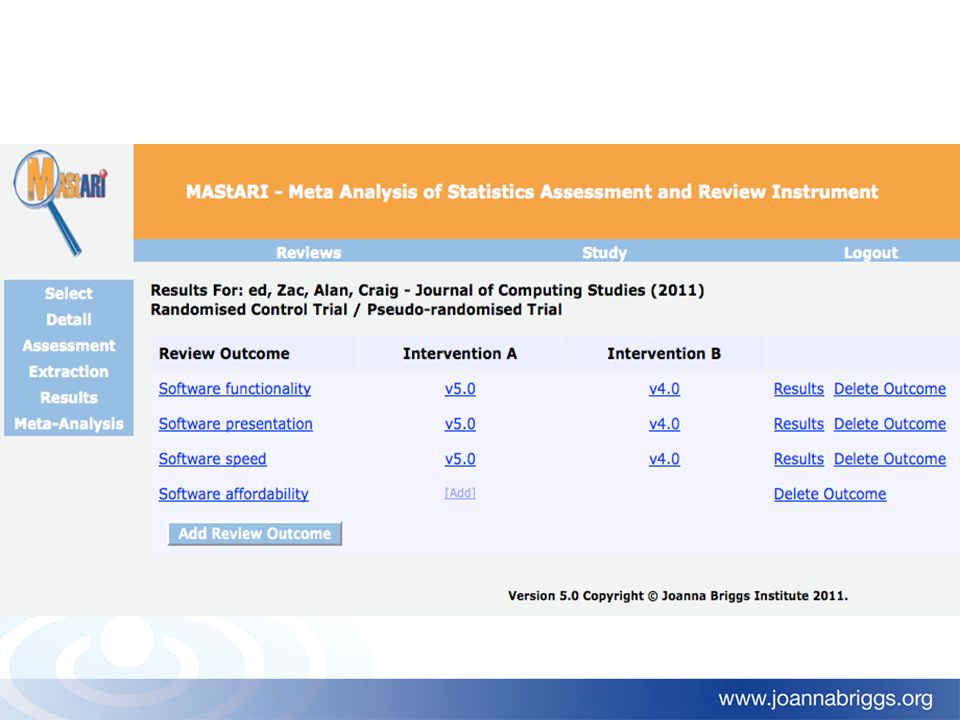
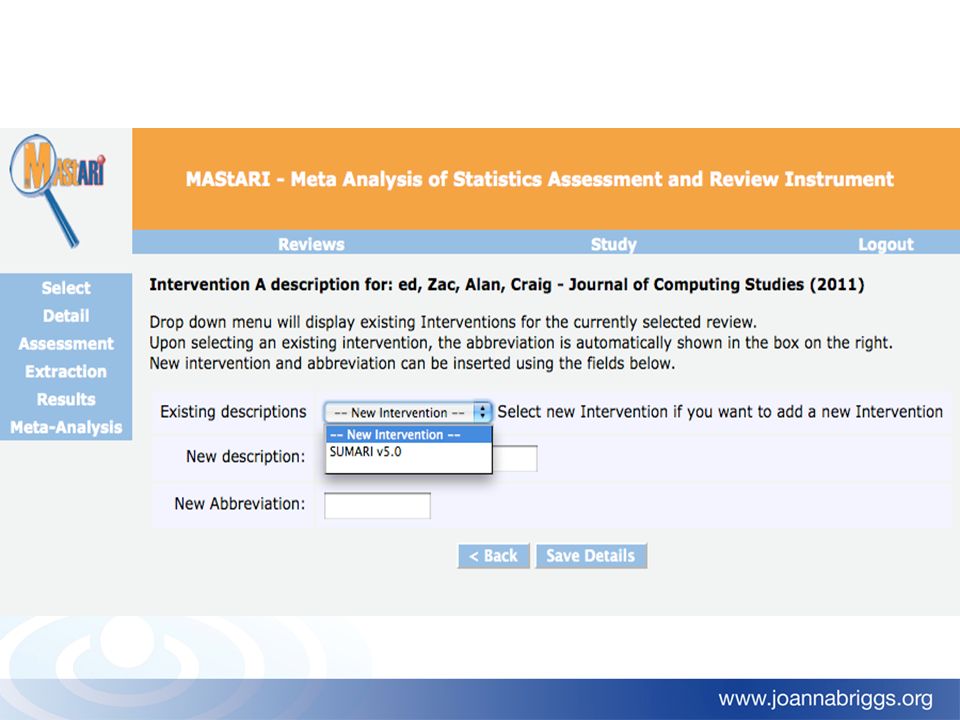
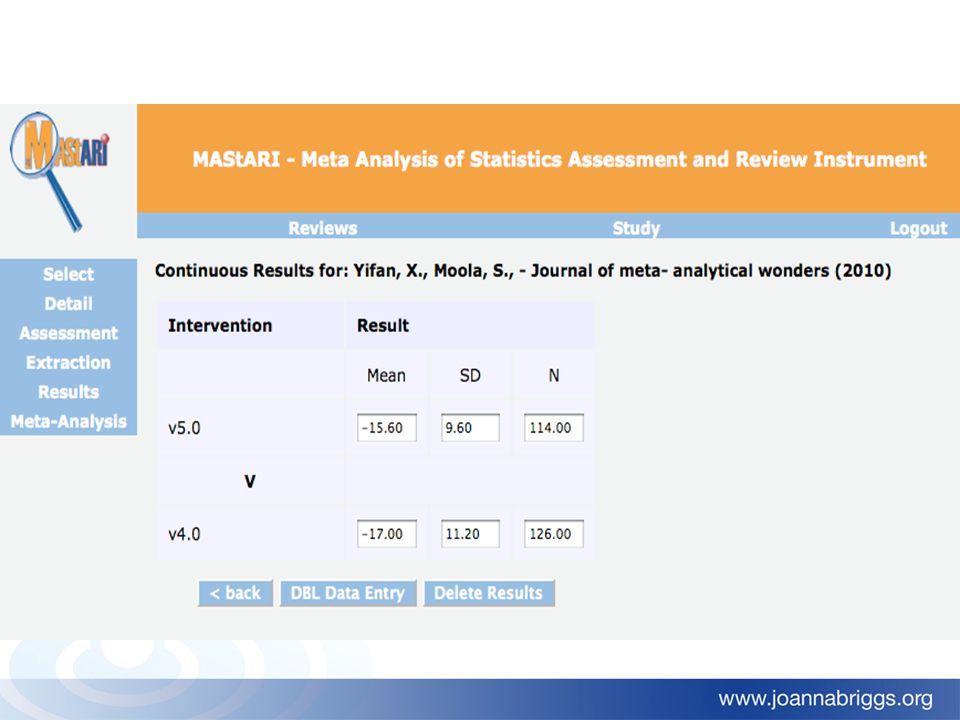
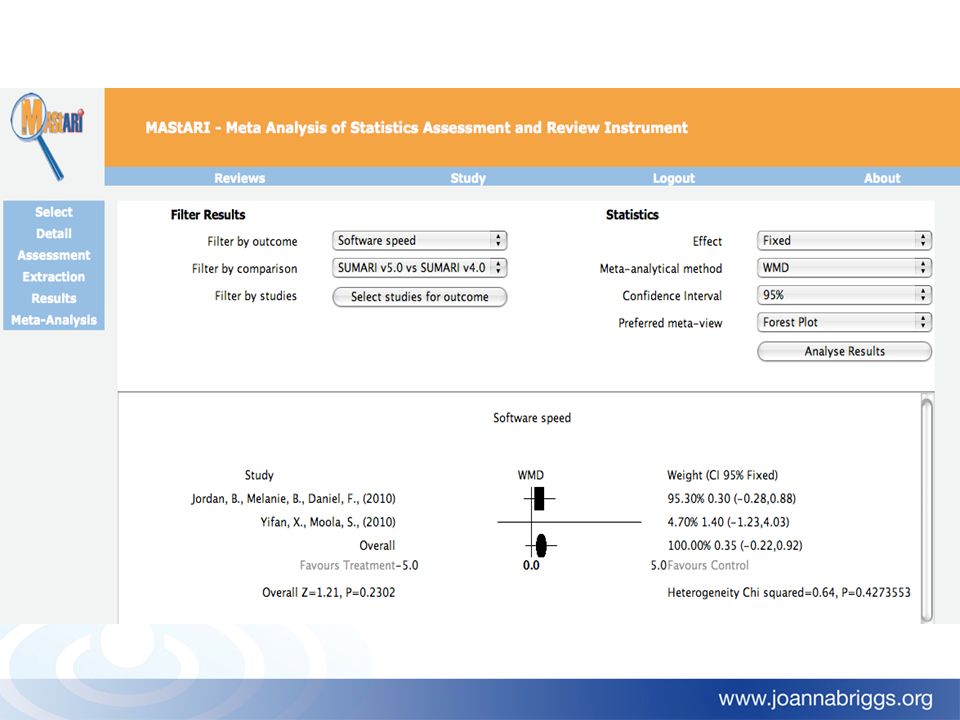
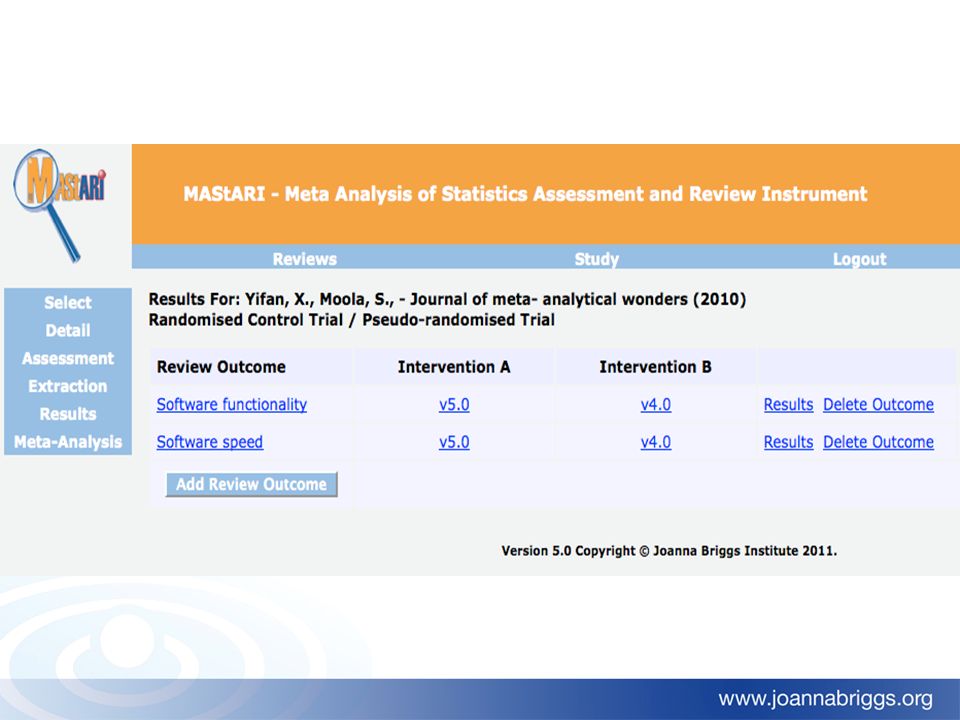
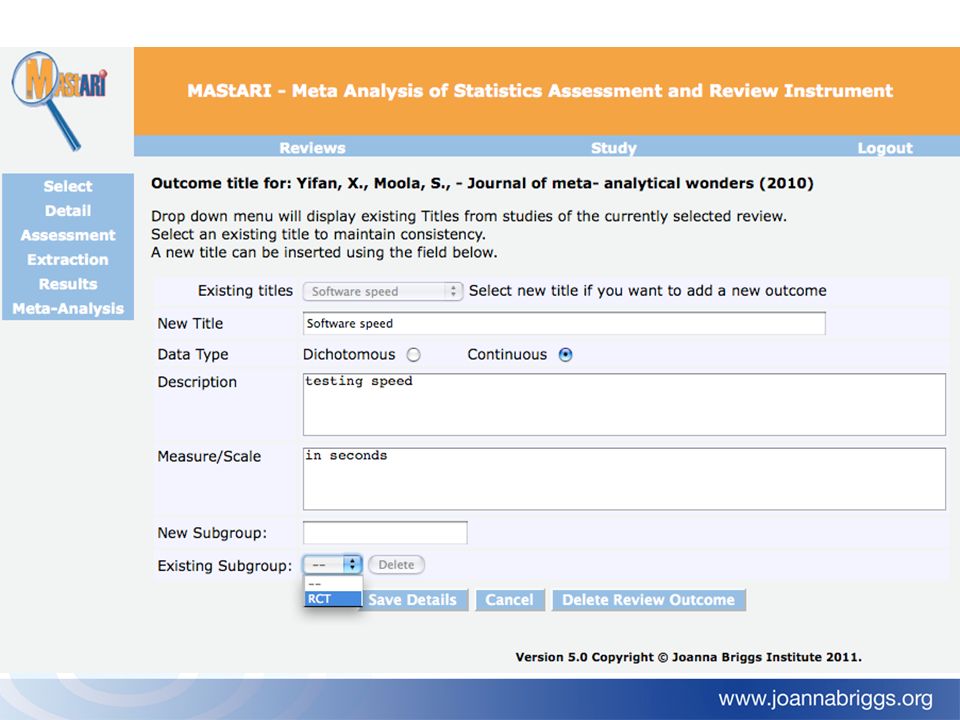
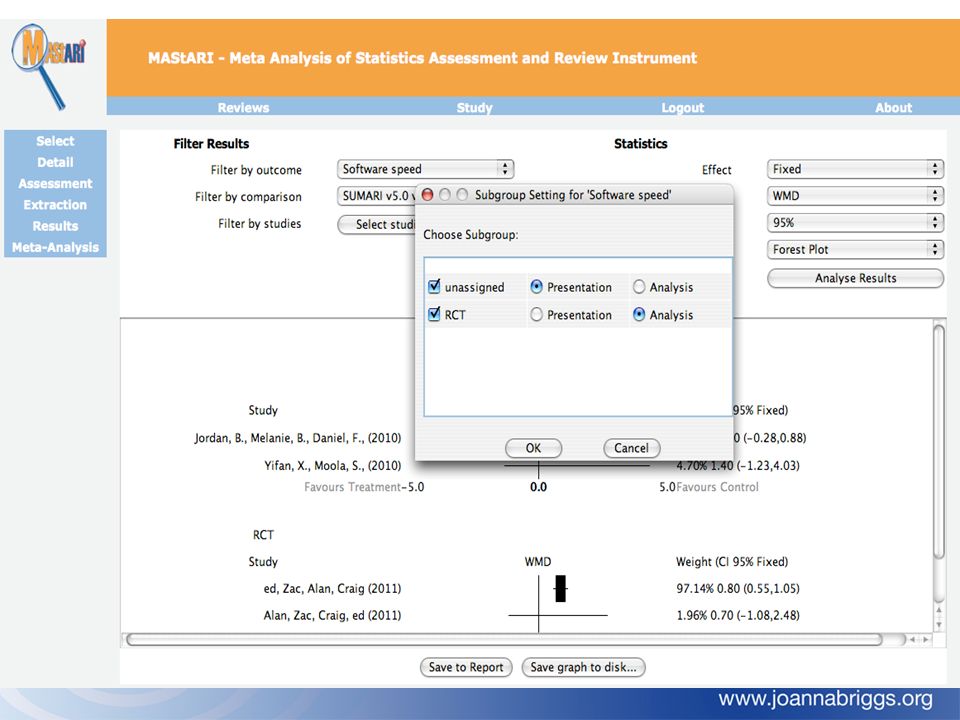
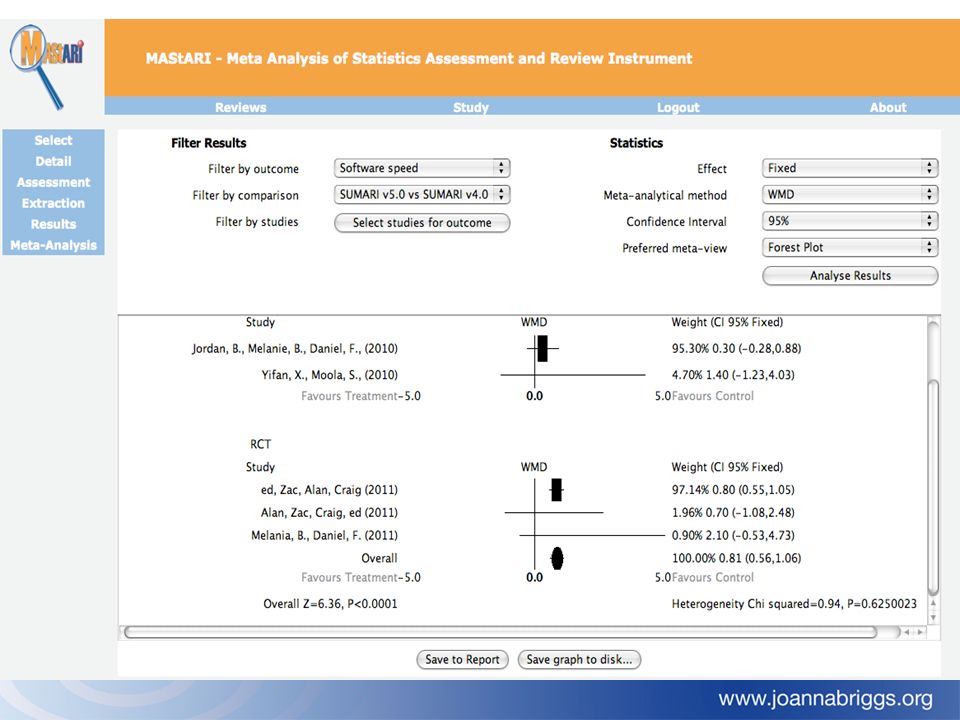
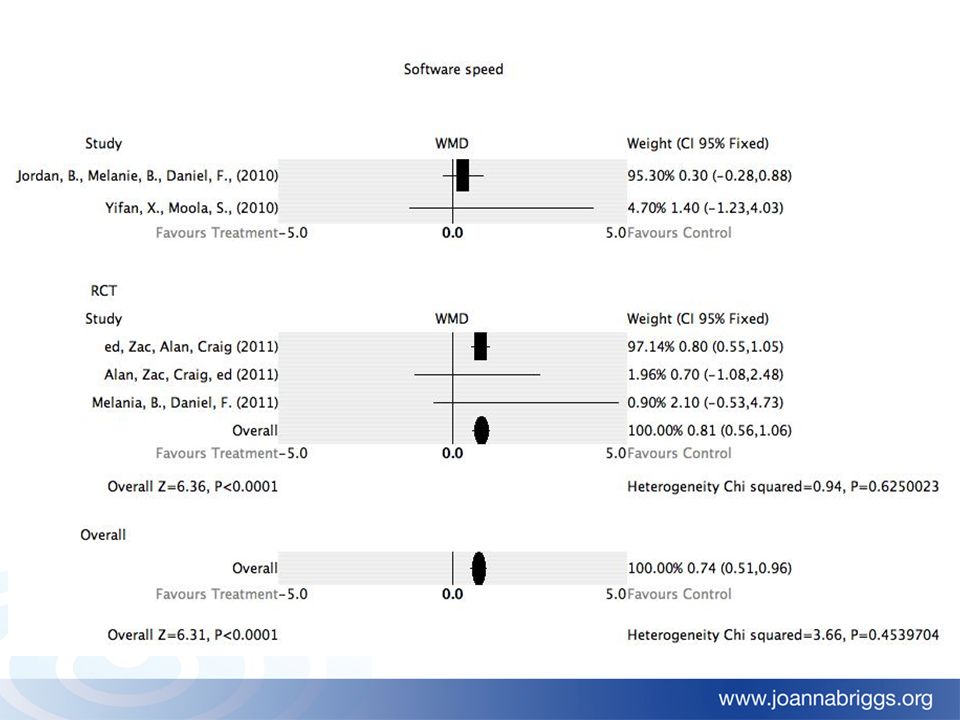
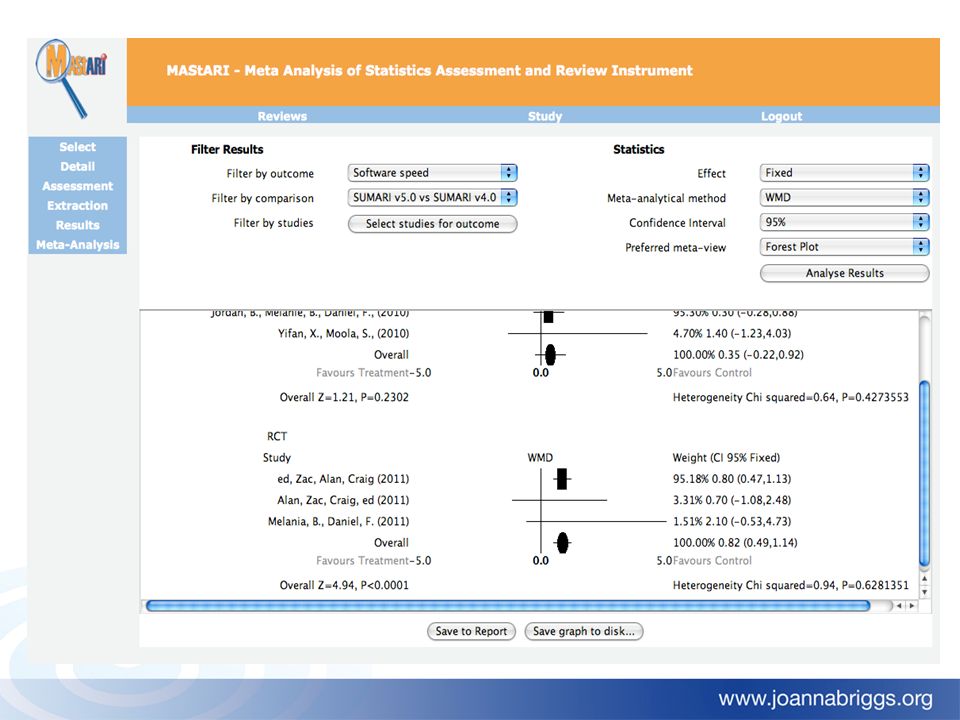
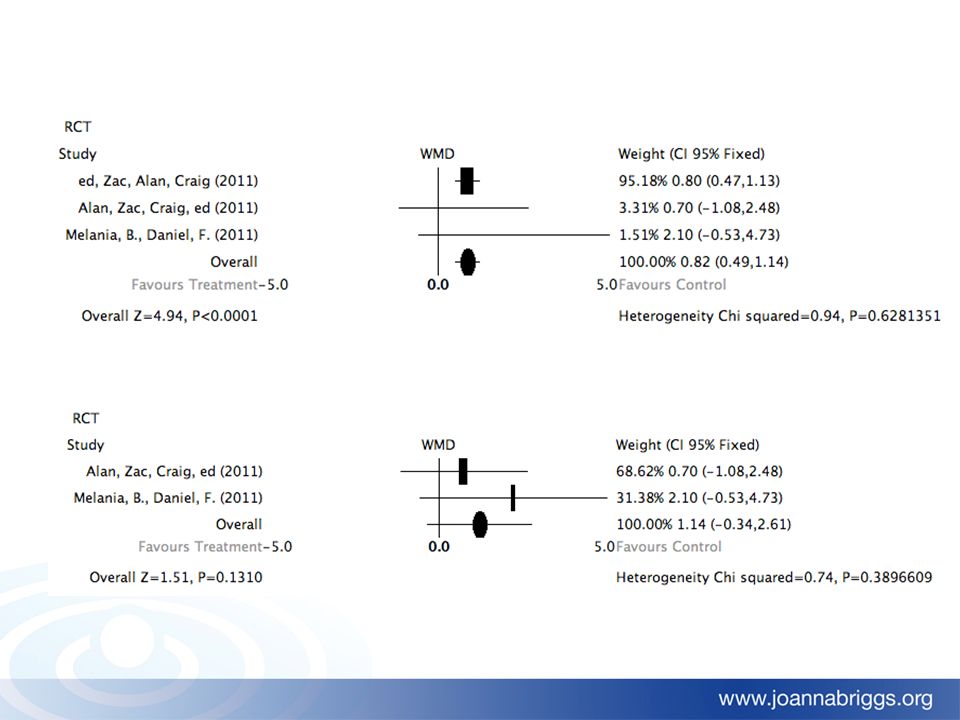
Meta Analysis of Statistics Assessment and Review Instrument (MAStARI)
")
140
Group Work 4 MAStARI Trial and Meta Analysis

141
Session 8: Protocol development

142
Session 9: Assessment

143
Session 10: Protocol Presentations

Similar presentations


, and the other of people with the same general characteristics.>")


