Download presentation
Presentation is loading. Please wait.

1
Utah’s Indicator-Based Information System for Public Health (IBIS-PH) Utah Department of Health Office of Public Health Assessment Lois M. Haggard, Ph.D., Director

2
UDOH Organizational Structure The UDOH executive director takes a personal interest in IBIS. The Center for Health Data is located in the Executive Director’s Office. It is important to have high-level sponsorship for the project to be successful.

3
http://ibis.health.utah.gov Utah’s IBIS-PH homepage provides access to all areas of the website and information on new features. This is a standard home page template, but states adopting IBIS can either modify the content only, or the whole page.

4
IBIS Information Dissemination Model: Most frequently-asked questions are answered in paper (.pdf) publications and in our Indicator Profile reports. Users who’d like more detailed analysis or sub-populations can use the interactive query system. If none of those systems answer their question, they must go to the “old” system of calling us on the phone.

5
IBIS has over 100 indicator profiles currently published. They are indexed in an alphabetical index (pictured here) and also in a categorical index that allows indicators to be placed in any of several categorization schemes, such as by program, by data source, or HP2010 focus area, etc.
 and also in a categorical index that allows indicators to be placed in any of several categorization schemes, such as by program, by data source, or HP2010 focus area, etc..")
6
Each indicator has a default graph that comes up on the indicator main page.

7
The main page also allows navigation to a table of numbers for the current graph, as well as access to additional graphs (if they exist). We also include the measure definition and a message on why it is an important construct in public health.

8
IBIS graphs are displayed using SVG (scalable vector graphics, a standard form of XML). They use commercial software from Elansoft that allows for interactive mouse-overs. Users must have an SVG-Viewer from Adobe (similar to Adobe Acrobat) installed on their computer to use the mouse-over capability. However, if a user does not have the SVG-Viewer installed, the IBIS system will produce a jpeg image and display the image in place of the SVG.
 installed on their computer to use the mouse-over capability. However, if a user does not have the SVG-Viewer installed, the IBIS system will produce a jpeg image and display the image in place of the SVG..")
9
How Are We Doing? Utah Versus U.S. What Is Being Done? Other Program Information Definition* Numerator* Denominator* Data Interpretation Issues Why Is This Important?* HP 2010 Objectives* Other Objectives Important facts about each measure include a number of fields. Not all fields are mandatory – mandatory fields are shown here with an asterisk.

10
The IBIS indicator profiles allow users to see how the current measure might be related to other measures.

11
For instance, an important health status outcome for binge drinking is motor vehicle crash injuries.

12
Programs can use IBIS to inform the general public of services and resources.

13
IBIS Indicator Reports Architecture web Indicator Reports IBIS XML, XSLT files Admin Interface JAVA server pages Admin DB MySQL DB IBIS System Garth Braithwaite

14
Admin DB, Relational DB Entities (Tables) Indicator View Values This is a (gross) oversimplification of the IBIS database structure. Certain information is stored at the indicator level, such as definition and HP2010 objectives. Each indicator may have one or more graphical data views. Each graph view has multiple data points (indicator view values).
..")
15
Indicator Attributes (Table Fields) Name, Title Definition Numerator & Denominator Important Facts (PH Context) Related Indicators Owner Status (open, completed, published) Etc… Here are some examples of fields in the Indicator table of the IBIS DB.
 Name, Title Definition Numerator & Denominator Important Facts (PH Context) Related Indicators Owner Status (open, completed, published) Etc… Here are some examples of fields in the Indicator table of the IBIS DB.")
16
Indicator View Attributes (Fields) Name Indicator Name Graph Title & Sub-Title Y-axis titles Data Notes Data Sources Category (X-axis) & Series (Legend) Labels Here are some examples of fields in the Indicator View table of the IBIS DB.
 Name Indicator Name Graph Title & Sub-Title Y-axis titles Data Notes Data Sources Category (X-axis) & Series (Legend) Labels Here are some examples of fields in the Indicator View table of the IBIS DB.")
17
Indicator View Value Attributes (Fields) Category Series Value Lower Confidence Limit Upper Confidence Limit Label Active Flag Here are some examples of fields in the Indicator View Value table of the IBIS DB.
 Category Series Value Lower Confidence Limit Upper Confidence Limit Label Active Flag Here are some examples of fields in the Indicator View Value table of the IBIS DB.")
18
IBIS Admin Site GUI Interface for DB Access Used by busy folks who do not necessarily have website publishing or DB data entry skills (with no interest in acquiring them) Must be user-friendly, follow good IS rules/heuristics Program staff from across the department use a website, called the “IBIS Admin site” to access the database and modify data records. Once an indicator has been set up, the maintenance is minimal, generally limited to annual update of numeric data and modification of text to reflect those changes.

19
Here are the first 18 records in the admin system. Since I am a “super-user,” my screen shot shows all 130 indicator records. But if I were a program person, I would only see those indicators that I have permission to modify. The Admin site is pretty simple to use, which is necessary if we are to get the cooperation we need.

20
This is the indicator main page, where we have provided text boxes to maintain some of the fields at the indicator level.

21
The four buttons near the bottom, Graph List, Graph Specifications, Graph Data Sources, and Graph Values, provide the ability to modify different graph views. This slide shows the list of graph views available for the Binge Drinking indicator. Notice that not all views are active (box on right). The indicator owner is still working on these views and has not made them available to the public yet.
. The indicator owner is still working on these views and has not made them available to the public yet..")
22
Here is the data entry page for the Binge Drinking by Age and Sex graph view. Eventually, we want to have a system that populates these data values from our query system. Right now, the data must be entered by hand.

23
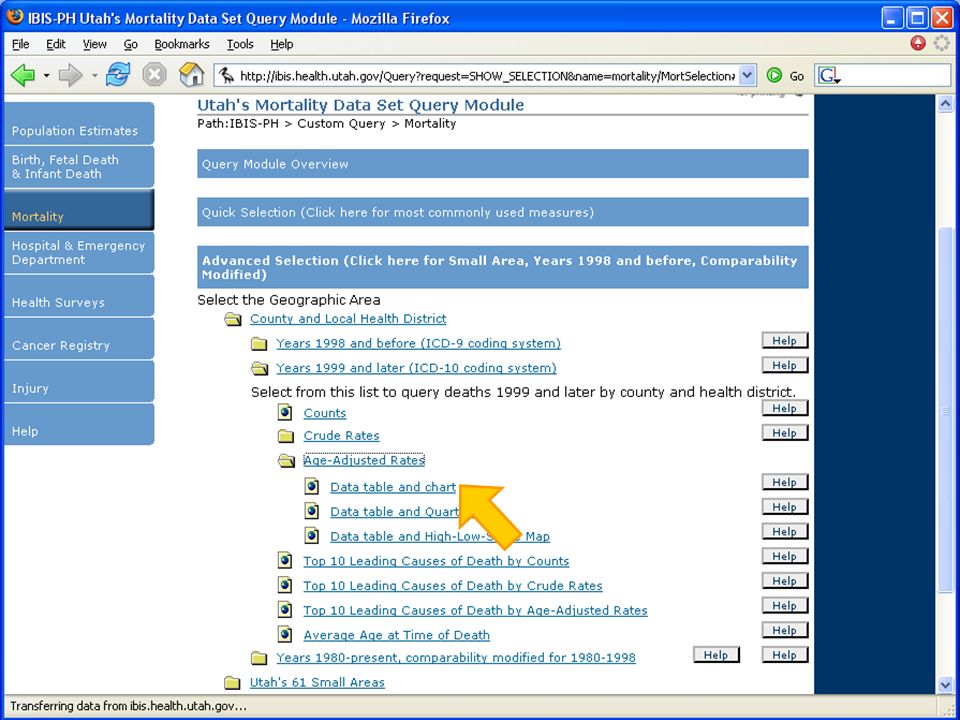
Custom Data Query Allows users to query health data sets directly General audience User-friendly GUI interface Sound epidemiology Help descriptions & instructions Bullet-proof – can’t confuse or give misleading answers, can’t allow users to do “stupid” things The IBIS Query system allows members of the general public to access several public health data sets and generate query results based on their specifications.

24
The custom query tab takes users to the IBIS-Q interactive data query system.

25
From the query entry page, users can go to tutorials, or request query modules for a variety of data sets, such as the BRFSS survey data.

26
Context-specific help buttons provide insights to questions we can anticipate. We can provide help text wherever we think it may be useful. These buttons can link to a help message, such as this one, or a help webpage.

27
The user goes through the steps and makes choices. We’ve found that our users really like the task to be organized into steps, so they can clearly see what is required of them.

28
The last step before submitting the request is choosing how to display the results. The system can do more than two dimensions, but, interestingly enough, our users told us they didn’t want that complexity!

29
After submitting the query request, the system returns a confirmation screen that allows the user to proceed, or go back and modify their query. This is one of the optional elements that experienced users may want to turn off to improve system performance.

30
The results page includes documentation of the query parameters. Here, the results have been displayed by age group for Salt Lake County. By clicking the “Output to Excel” button, users may also output the data directly to Excel.

31
IBIS can graph the results in several graphical formats.

32
A 2-D table provides results if two dimensions have been selected. We like to always present survey data with the percentage and its complement, to avoid user misinterpretation.

33
A data list (fact table) provides information in more detail than the 2-D table.
 provides information in more detail than the 2-D table.")
34
Meta-data (information about the data) can be customized for each query module and measure.
 can be customized for each query module and measure.")
35
The IBIS query system can also produce map views of data. Maps provide mouse- over information and zooming.

36
Thank you! Lois M. Haggard, Ph.D. Office of Public Health Assessment Utah Department of Health loishaggard@utah.gov (801) 538-9455
")
37
Custom Data Query IBIS interface (“view system”) Creates request URL from user selections Passes is to the C program C program Parses parameters Loads config, function, and label files and builds SAS code file Calls SAS
 Creates request URL from user selections Passes is to the C program C program Parses parameters Loads config, function, and label files and builds SAS code file Calls SAS")
38
Query – Architecture IBIS-Q Interface IBIS XML, XSLT files IBIS CGI app IBIS-Q CGI App SAS SAS for server Data SAS Data Sets web UDOH Web Server (Apache) IBIS System Garth Braithwaite Zhiwei Liu
 IBIS System Garth Braithwaite Zhiwei Liu")
39
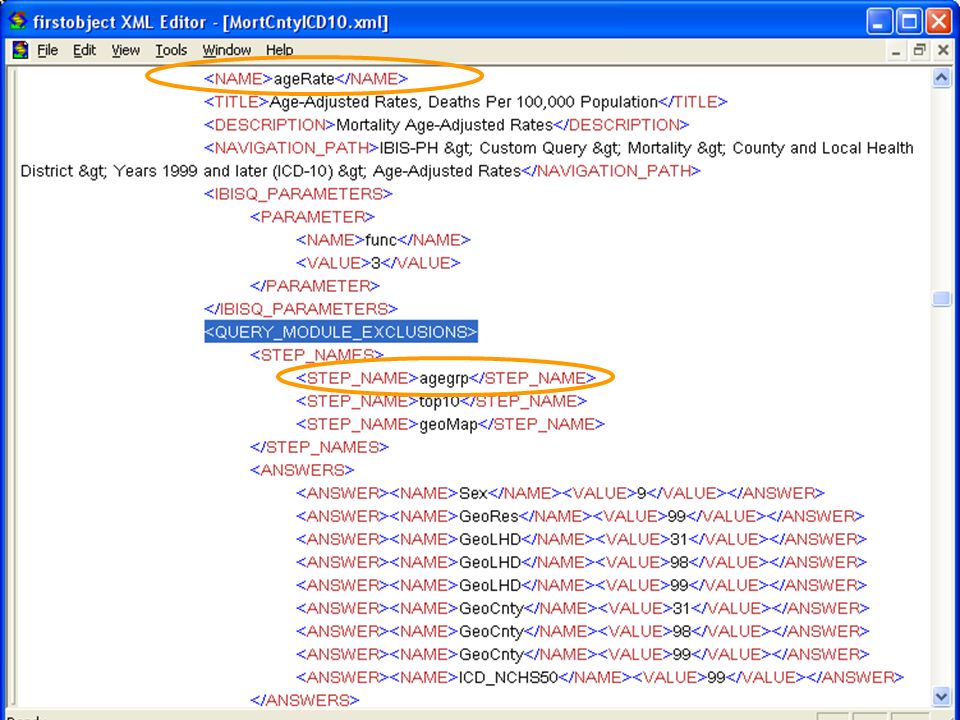
IBIS-Q Module Structure Left Nav Button Quick Select’n Ad- vanced Select’n Measure Query Module.xml Structure based on how users perceive the world Structure based on efficient programming Configuration Select’n Page

44
The Trade-Off More Module.xml files Shorter, simpler.xml files More files to maintain Fewer Module.xml files Longer, more complex.xml files Fewer files to maintain

Similar presentations


>")


