Download presentation
Presentation is loading. Please wait.

1
Identification of large-scale genomic rearrangements between closely related organisms Bob Mau 1,2, Aaron Darling 1,3, Fred Blattner 4,5, Nicole Perna 1,5 Departments of Animal Health and Biomedical Sciences 1, Oncology 2, Computer Science 3, Laboratory of Genetics 4, Genome Center University of Wisconsin – Madison

2
The Amazing Variety of Diseases caused by E.coli strains in Bacterial Pathogenesis: A Molecular Approach “… is due to the fact different strains have acquired different sets of virulence genes. Most strains of E.coli are avirulent because they lack these virulence genes. E.coli is an excellent example of the maxim that it is the set of virulence genes carried by an organsims that make it a pathogen, not its species or genus designation.”

4
Categories of Bacterial Genome Evolution Local Single Base Mutations Indels (Small insertions and deletions Global (Large-scale) Rearrangements Inversions, translocations, inverted translocations Gene Gain and Loss Horizontal or Lateral Transfer Transformation, Transduction, and Conjugation Phage Integration Mobile Elements Transposons and Insertion Sequences Gene Duplication ( Mediated by mobile elements )
 Rearrangements Inversions, translocations, inverted translocations Gene Gain and Loss Horizontal or Lateral Transfer Transformation, Transduction, and Conjugation Phage Integration Mobile Elements Transposons and Insertion Sequences Gene Duplication ( Mediated by mobile elements )")
5
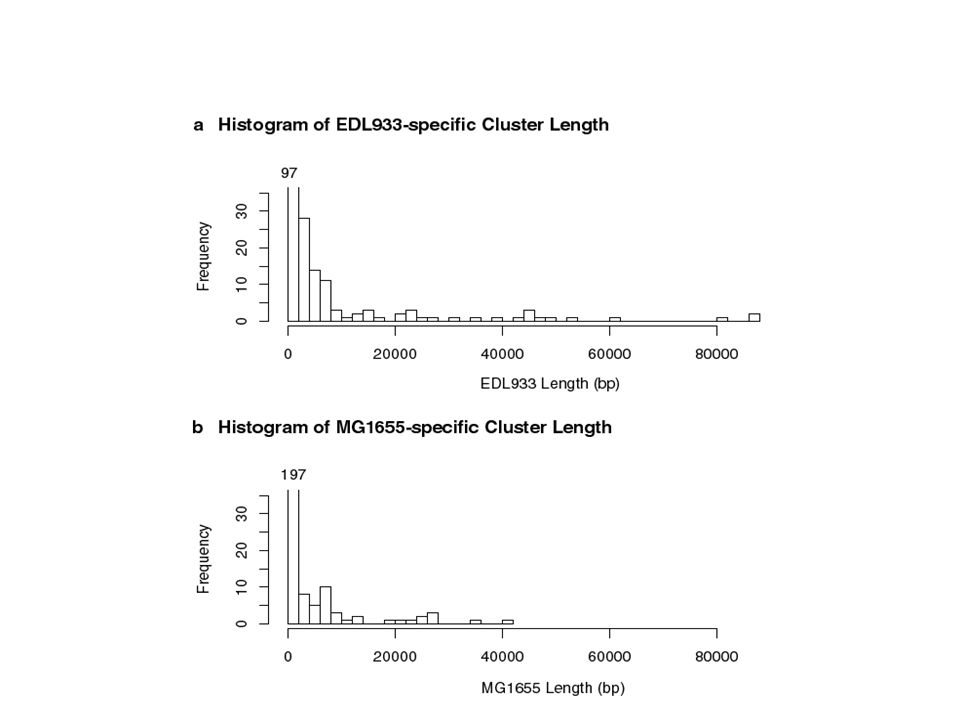
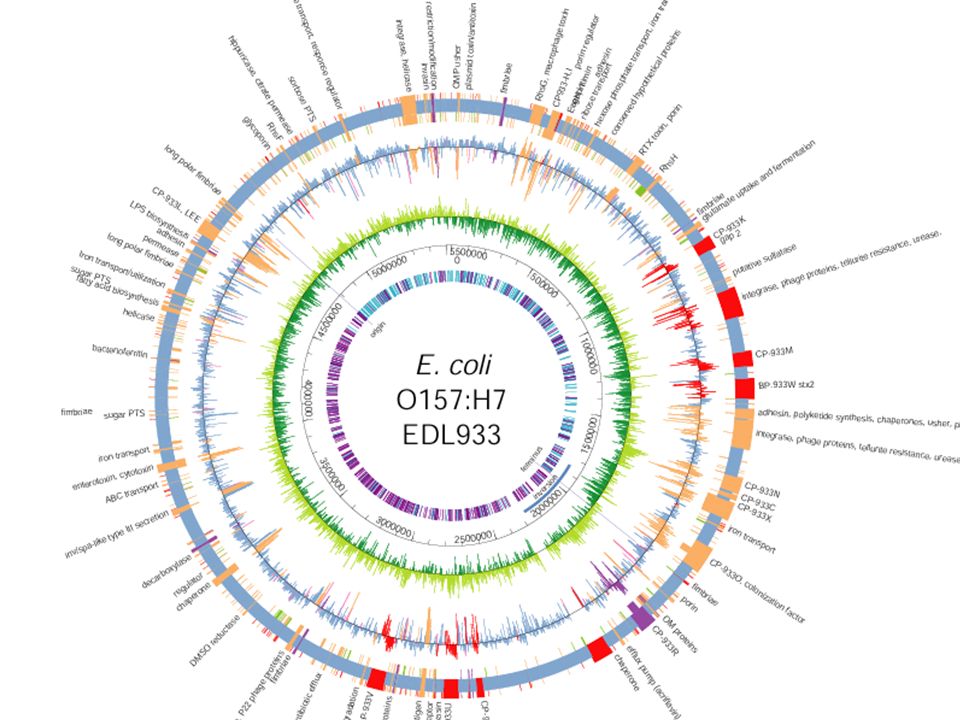
From the two E. coli genomes sequenced at the Blattner lab, we’ve identified: ~3900 genes common to both K-12 and O157:H7 528 genes unique to K-12 1387 genes unique to O157:H7 40 % of these genes are of unknown function. The primary reasons for these wholesale differences are: lateral transfer, phage integration, and one whopper of a duplication.

7
Strategy of Global Alignment of Two Highly Related Genomes: K O Partially Sorted Suffix Arrays STEP 1 Quickly find all 16-mer matches between genomes (K 1,O 1 ) : (K i,O i ) : (K n,O n ) STEP 2 Collapse consecutive pairs to form a collection of maximally exact matches. (MEMs) Use LIS algorithm to construct a collinear set of maximally ordered matches. STEP 3 Extend across intervening regions via anchored alignments from individual MEM endpoints Unique Insert Substitution
 Use LIS algorithm to construct a collinear set of maximally ordered matches. STEP 3 Extend across intervening regions via anchored alignments from individual MEM endpoints Unique Insert Substitution.")
8
K-12 vs O157:H7 MEM Stats 43,235 total MEMs ( 24 bps) 31,640 form maximal collinear subset The largest exact match is 2,632 bases 62 MEMs exceed 1000 bps Over 11,000 exceed 100 bps 18,212 single base differences (SNPs) Resulted in a segmentation of O157:H7 into 357 intervals of backbone or unique insert.
 31,640 form maximal collinear subset The largest exact match is 2,632 bases 62 MEMs exceed 1000 bps Over 11,000 exceed 100 bps 18,212 single base differences (SNPs) Resulted in a segmentation of O157:H7 into 357 intervals of backbone or unique insert.")
10
A Three-way Genomic Comparison: Parkhill et.al. Nature E. coli K-12 MG1655 S. Typhi CT18 S. Typhi- murium LT2

11
The “Traditional” WAY to view MEMs {(a 0,b 0 ),(a 1,b 1 ),…, (a K,b K )} for K+1 genomes For the reference genome G 0, a 0 < b 0 by convention. For the NON reference genomes, a k b k means the match occurs on the opposite strand (reverse complement)
.")
12
A novel approach, wherein: Extensibility: works just as well for N as it does for 2 genomes, provided there is sufficient sequence similarity. Automatically identifies inversions, translocations, and inverted translocations Determines a maximal collinear subset within each locally collinear region, without recourse to an LIS step Very space efficient and very fast

14
Multiple Oriented Offset For each non-reference genome, determine the polarity with respect to G 0 As well as the offset: The Multiple Oriented Offset is the N vector:

15
Canonical MEM Equivalence Classes By appending the interval in reference genome coordinates: (a 0, b 0 ) to the Moo, the MEM is completely specified. We aggregate MEMs by their generalized offset, inducing a partition on the set of MEMs. This defines a CMemEC: {Moo,{(a 0 1, b 0 1 ), (a 0 2, b 0 2 ),…, (a 0 M, b 0 M )}}
, (a 0 2, b 0 2 ),…, (a 0 M, b 0 M )}}.")
18
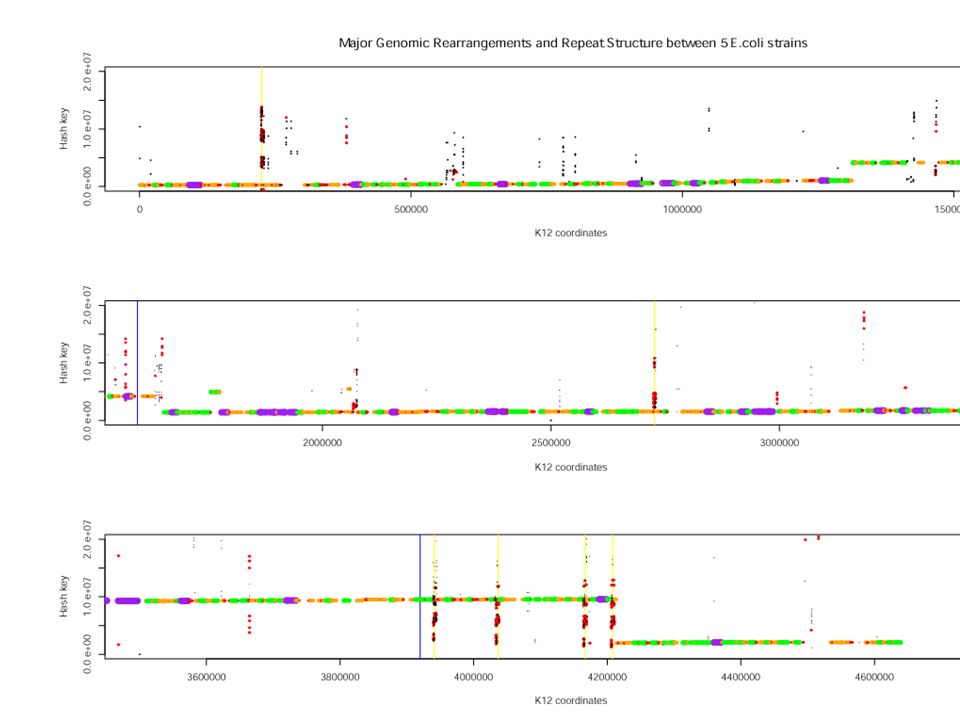
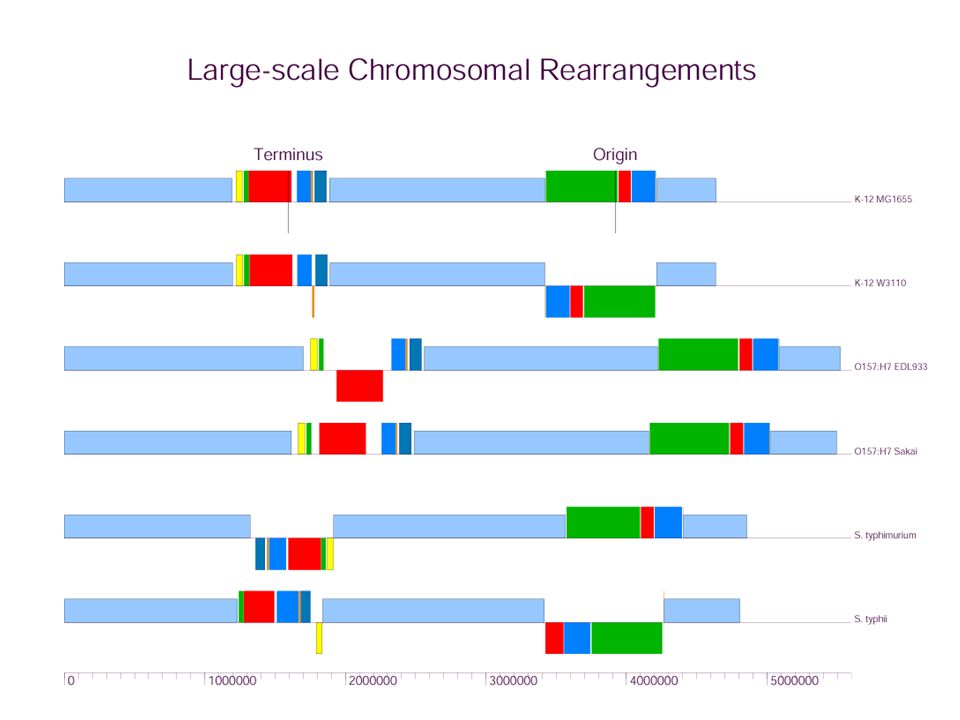
In this example, it’s abundantly clear from the plot that there are two large rearrangements, one around the origin and the other about the terminus of replication. We could probably get by with modest extensions of existing methods (MUMmer or our earlier algorithm) to account for the large amounts of laterally transferred lineage-specific sequence.
 to account for the large amounts of laterally transferred lineage-specific sequence..")
19
In this example, it’s abundantly clear from the plot that there are two large rearrangements, one around the origin and the other about the terminus of replication. We could probably get by with modest extensions of existing methods (MUMmer or our earlier algorithm) to account for the large amounts of laterally transferred lineage-specific sequence. But, hey, biology ain’t easy...
 to account for the large amounts of laterally transferred lineage-specific sequence. But, hey, biology ain’t easy....")
21
Figure 1: Simplest Block and Strip Diagram G 1 : Strip 1 G 2 : Strip 2 G 3 : Strip 3 1 2 3 4 5 6 7 G 4 : Strip 4 1 -7 5 6 4 3 2 -3 -2 -1 -7 5 6 4 -7 4 5 6 -3 -2 -1 1 -3 -2 4 5 6 7 G 0 : Reference Strip

22
1 2 3 4 5 6 7 Cut pt. Terminus Origin G 0 : Reference G 1 : Genome 1 1 2 -3 4 -6 -5 7 1 2 3 4 6 -5 7 G 2 : Genome 2 G 3 : Genome 3 1 -3 -2 4 5 6 7 G 5 : Genome 5 G 4 : Genome 4 1 2 -3 4 5 -6 7 1 2 3 4 5 6 7 Figure 2: Example with Variable Block Lengths

23
Figure 1: Large-scale Genomic Rearrangements Genome 2 Genome 1 Zero Pt. Terminus Origin Genome 3 Genome 4 Genome 5 Species Tree MRCA

24
Figure 3: Segmentation Graph S(G 0 )
")
25
LOOk at the Picture and

26
Sorted Merge Lists of Six Enterobacterial strains MG1655 W3110 EDL933 Sakai CT18 LT2 Six SMLs of bimers, one for each genome. A bimer is the lexicographically lesser of an n-mer (we use n=23) and its reverse complement, together with an orientation flag. K-12 O157:H7 Typhi Typhimurium Escherichia coli Salmonella Enterica
 and its reverse complement, together with an orientation flag. K-12 O157:H7 Typhi Typhimurium Escherichia coli Salmonella Enterica.")
32
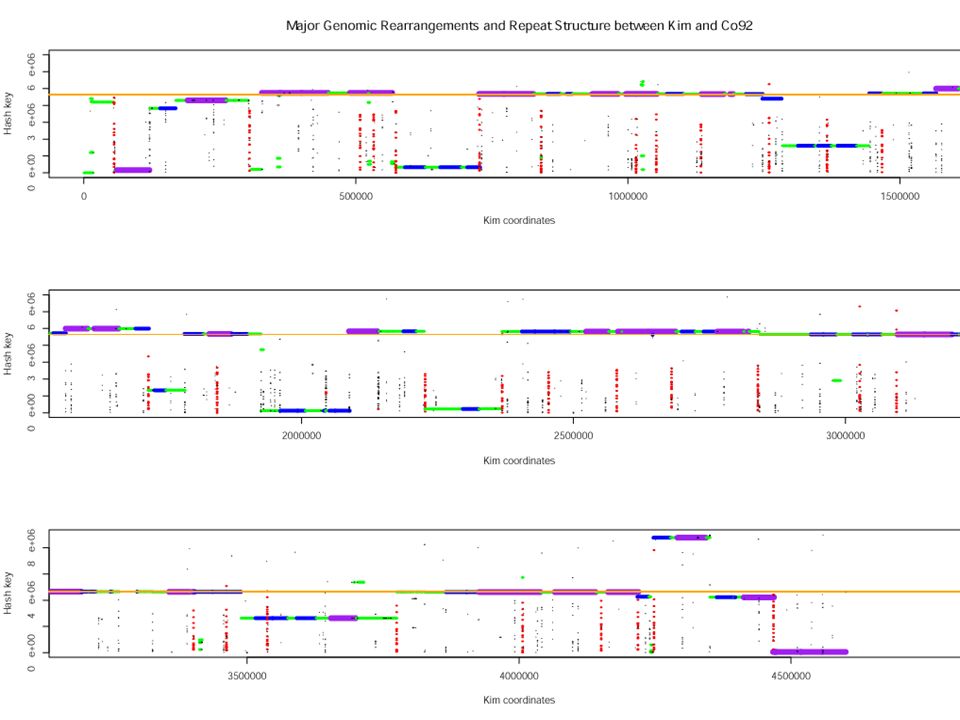
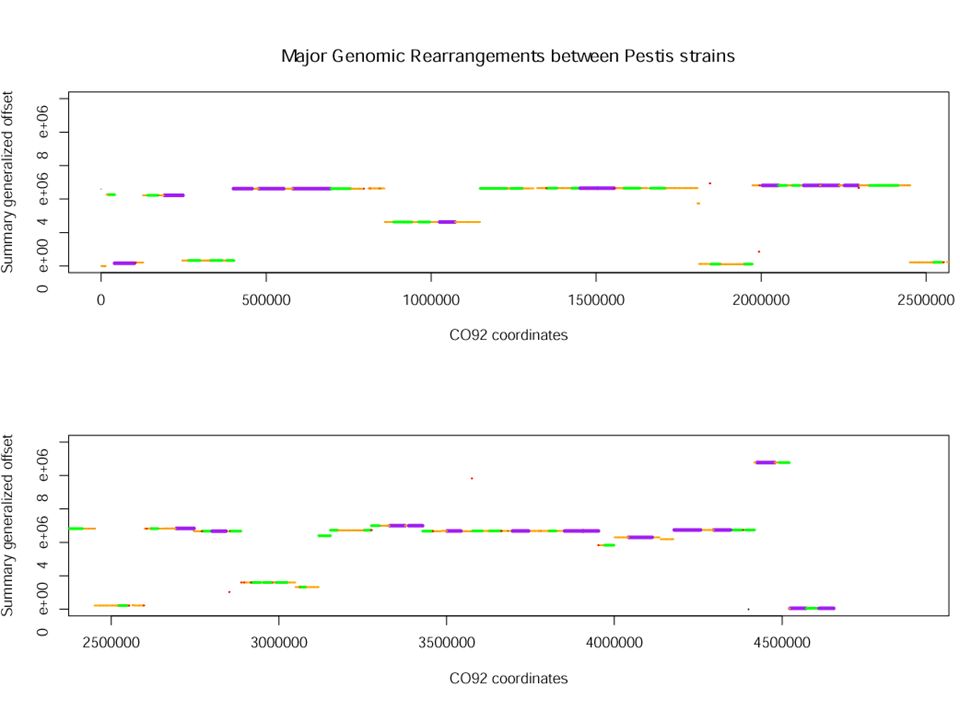
0 12 3 10 7 1 5 4 2 11 6 9 8 0 C20 C21 C22 C22.5 C23 C24 C25 C1 C2 C3 C4 C5 C6 C7 A Transformation of CO92 to KIM by Inversions Near the Origin 0 1 2 3 4 5 6 7 8 9 10 11 12 0 K5 K4 K3 K2 K1 K25 K24 K23 K22 K21 K20.5 K20 K19 K18 0 8 9 6 11 2 4 5 1 7 10 3 12 0 0 1 5 4 2 11 6 9 8 7 10 3 12 0 0 1 11 2 4 5 6 9 8 7 10 3 12 0 0 1 3 10 7 8 9 6 5 4 2 11 12 0 0 1 3 2 4 5 6 9 8 7 10 11 12 0

Similar presentations


,>")


 between bacteria through direct cell to cell contact, or through a bridge-like.>")


 * MGEs in the virulence.>")
