Download presentation
Presentation is loading. Please wait.

2
EDUCATION NEEDS TO BE VIEWED AS AN INVESTMENT NOT AN EXPENSE

3
District Expenditure Reduction Measures Impacting Annual Budget Projections ◦ Staff and Program Reductions 12 Full Time Teachers ◦ Support Staff Reductions 2 Bus Drivers, 1 Full Time Tech Support, 1 Full Time Custodian, 1 Full Time Aid ◦ Transportation Service Reductions ◦ Moved to a Traditional Schedule ◦ New and Increased Fees (Athletic, lunch, etc. )
.")
4
Energy Conservation Purchasing Program ◦ Ongoing Insurance Program Adjustments ◦ Reduced outside contractor fees. ◦ Eliminated Academic and Athletic Budget Line Items As needed basis only.

5
PCHS Uses Cash Basis Accounting ◦ Revenues and Expenditures are recognized at the time cash is received or disbursed. ◦ Beginning Fund Balances shown are tentative at the time the budget is balanced. Audit finalization and adjustments to entries may be made after posting.

6
Public School Budgets are estimates of revenues and expenditures. This budget was prepared using conservative estimates using trend data generated over recent years: ◦ Revenues are budgeted using low estimates ◦ Expenditures are budgeted using high estimates

7
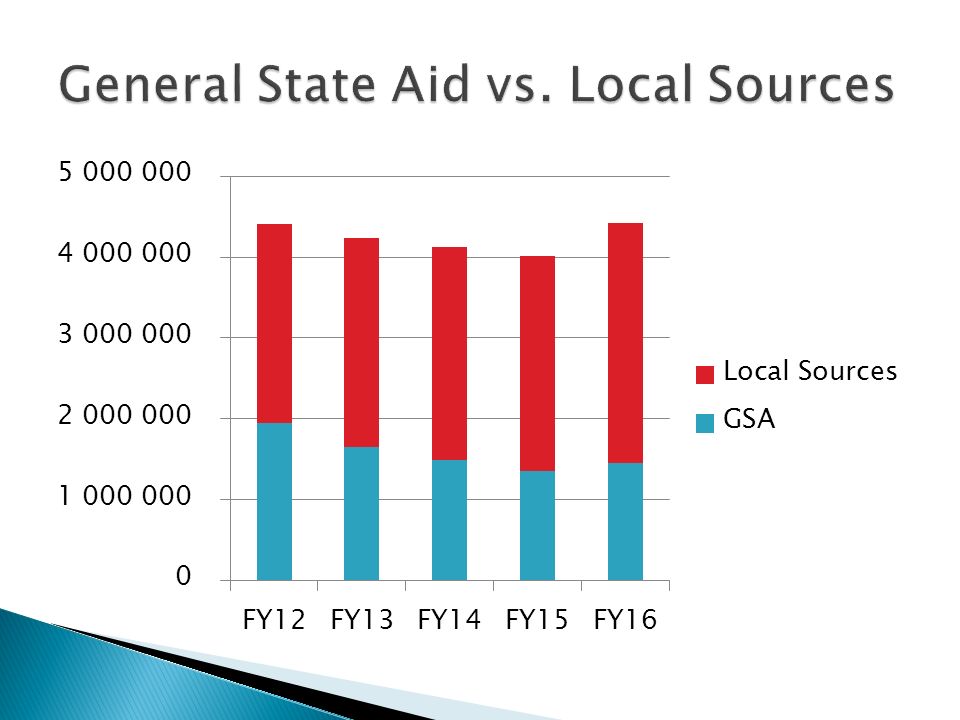
Variables Impacting Revenue General State Aid Proration Level = 92.06% Note: This value may not be maintained at this level for the entire fiscal year. Underfunded Categorical Payments Transportation / Special Education 4 payments reduced to 2 or 3 actual disbursements Fluctuation in Local EAV Annual Availability of Federal Sources Potential for Property Tax Freeze Loss of CPI Unable to Capture EAV Growth $$

8
Local Sources ✓ Tax Revenues from Levy ✓ Corporate Personal Property Replacement Tax ✓ Food Service Revenues (Breakfast/Lunch Sales) ✓ Textbook Rental / Lab Fees / Etc. ✓ Flow Thru (District to District / ROE #30) ✓ Interest ✓ County Schools Facility Tax (New Revenue Stream) ✓ Local Donation Programs
 ✓ Interest ✓ County Schools Facility Tax (New Revenue Stream) ✓ Local Donation Programs.")
9
State Sources ✓ General State Aide (GSA) ✓ Grant Revenues ✓ Sub-Categorical (Special Ed / Transportation Reimbursements) Federal Sources ✓ Title Funding ✓ Medicaid ✓ I.D.E.A ✓ Grant Revenues (REAP, PERKINS, E-RATE...)
 ✓ Grant Revenues ✓ Sub-Categorical (Special Ed / Transportation Reimbursements) Federal Sources ✓ Title Funding ✓ Medicaid ✓ I.D.E.A ✓ Grant Revenues (REAP, PERKINS, E-RATE...)")
11
State Defined ◦ “Big 4 Operating” Funds” ◦ Educational Fund ◦ Operations and Maintenance ◦ Transportation Fund ◦ Working Cash

12
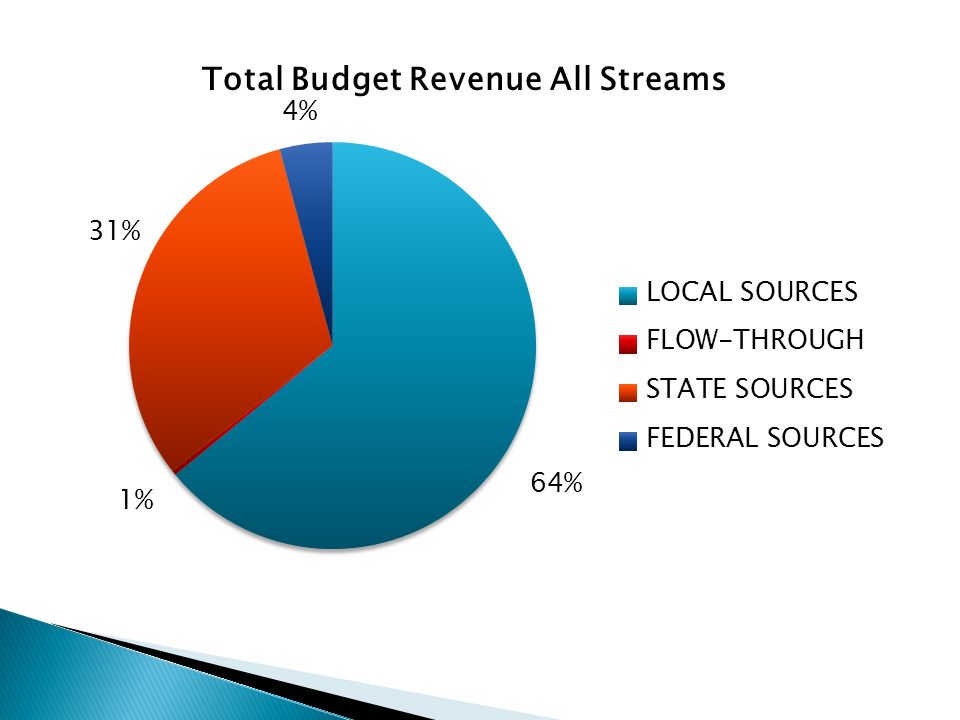
LOCAL SOURCES $2,965,423 FLOW-THROUGH $ 18,689 STATE SOURCES $1,452,037 FEDERAL SOURCES $ 193,764 Total Projected Revenue $4,629,913 Total Proj. Expenditures $4,477,892 Surplus (Deficit) $152,021
 $152,021.")
16
Local $1,990,558 - 55% State $1,452,037 - 40% Federal $ 193,764 - 5% Flow Thru $ 18,053 - 0% Total $3,654,412 - 100%

18
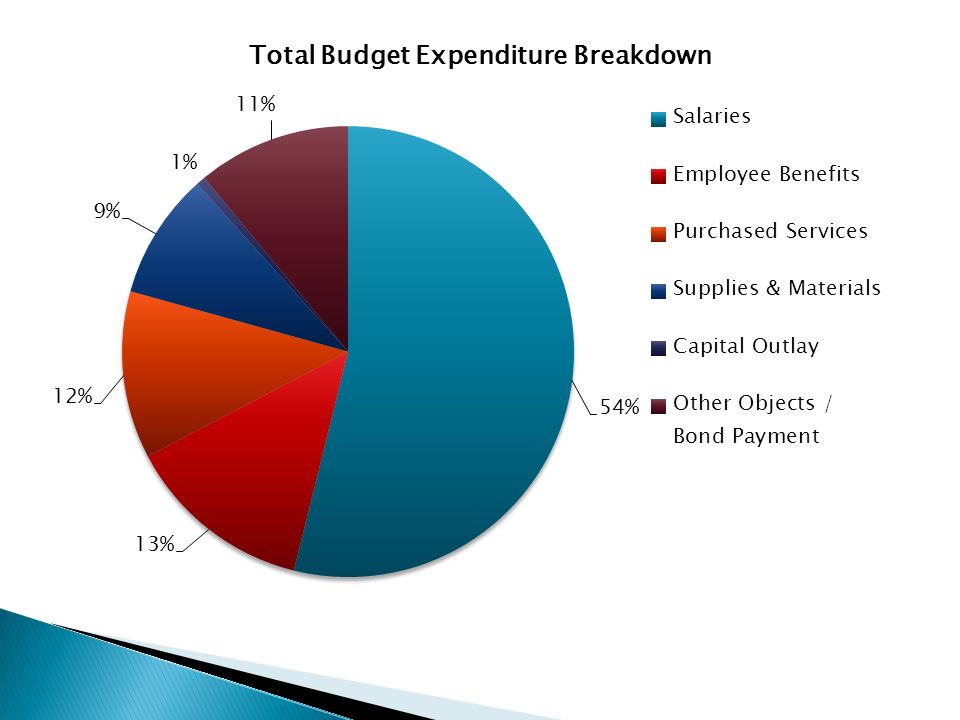
ISBE classifies expenditures using the following categories: ✓ Salaries ✓ Benefits ✓ Purchased Services ✓ Supplies ✓ Capital Outlay ✓ Other (includes dues/fees, tuition, and Debt Principal/Interest)
")
19
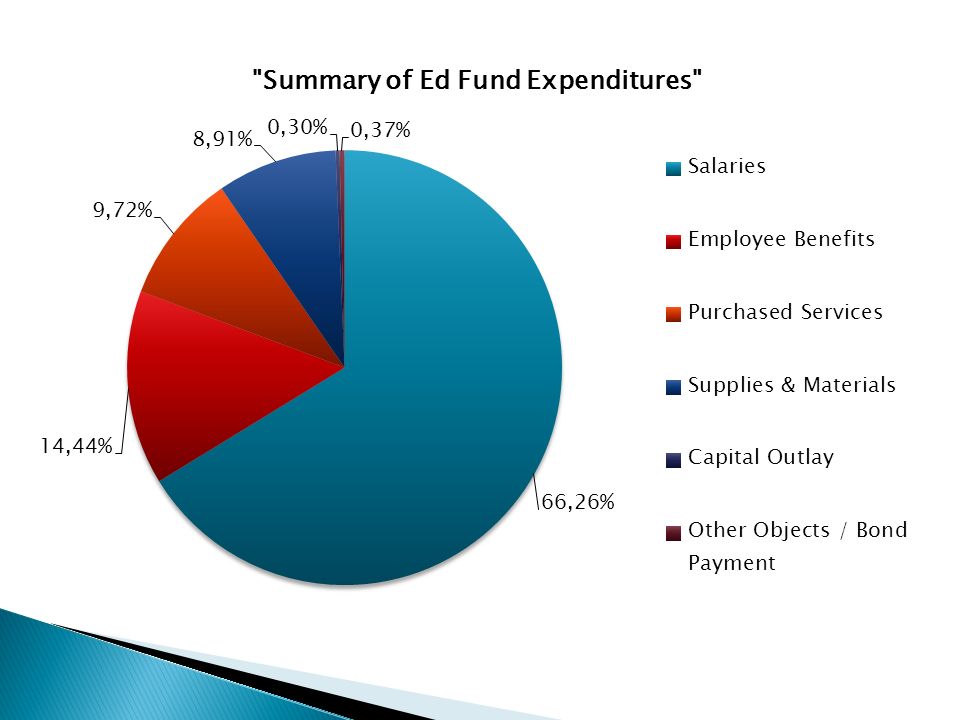
Education Fund ◦ Budgeted Revenues $3,022,844 ◦ Budgeted Expenditures $3,098,555 ◦ Surplus (Deficit) ($75,711) ◦ Estimated Fund Balance 7/1/15 $3,200,516 ◦ Projected Ending Fund Balance 6/30/16 $101,961
 ($75,711) ◦ Estimated Fund Balance 7/1/15 $3,200,516 ◦ Projected Ending Fund Balance 6/30/16 $101,961")
20
Salaries $2,052,995 - 66% Benefits $ 447,565 - 15% *Purchase Services $ 301,270 - 10% *Supplies $ 275,975 - 9% Capital Outlay $ 9,300 - 0.03% Other/Tuition $ 11,450 – 0.03% Non-Cap Equip. $ 0 - 0% Total $3,098,555 - 100% * Includes Some Telephone, Water, Sewer, Gas & Electric Services

23
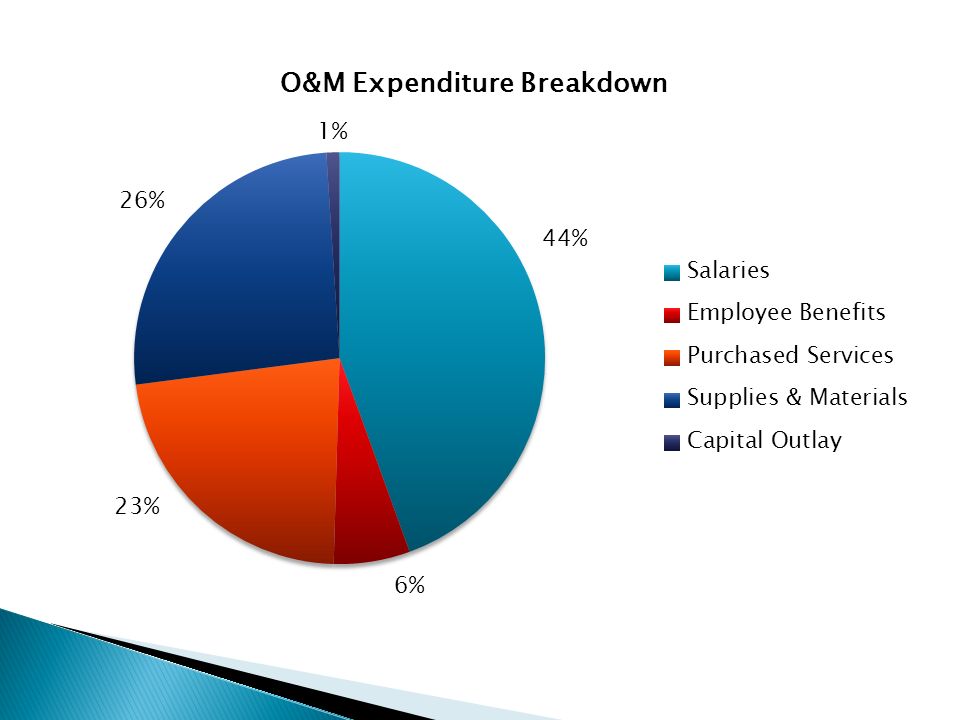
O&M Fund ◦ Budgeted Revenues $245,150 ◦ Budgeted Expenditures $242,067 ◦ Surplus (Deficit) $3,083 ◦ Estimated Fund Balance 7/1/15 $117,151 ◦ Projected Ending Fund Balance 6/30/16 $120,234
 $3,083 ◦ Estimated Fund Balance 7/1/15 $117,151 ◦ Projected Ending Fund Balance 6/30/16 $120,234")
24
Salaries $107,650 - 44% Benefits $ 14,491 - 6% Purchase Services $ 54,426 - 23% Supplies $ 63,000 - 26% Capital Outlay $ 2,500 - 1% Total $242,067 - 100%

26
Transportation Fund ◦ Budgeted Revenues $241,027 ◦ Budgeted Expenditures $205,454 ◦ Surplus (Deficit) $35,573 ◦ Estimated Fund Balance 7/1/15 $176,249 ◦ Projected Ending Fund Balance 6/30/16 $211,822
 $35,573 ◦ Estimated Fund Balance 7/1/15 $176,249 ◦ Projected Ending Fund Balance 6/30/16 $211,822")
27
Salaries $ 121,143 - 59% Benefits $ 5,008 - 03% Purchase Services $ 16,803 - 08% Supplies $ 62,000 - 30% Capital Outlay $ 0 - 0% Other $ 500 – 0% Total $ 205,454 - 100%

29
Working Cash Fund ◦ Budgeted Revenues $ 49,010 ◦ Budgeted Expenditures $0 ◦ Surplus (Deficit) $ 49,010 ◦ Estimated Fund Balance 7/1/15 $ 0 ◦ Projected Ending Fund Balance 6/30/16 $ 49,010
 $ 49,010 ◦ Estimated Fund Balance 7/1/15 $ 0 ◦ Projected Ending Fund Balance 6/30/16 $ 49,010")
30
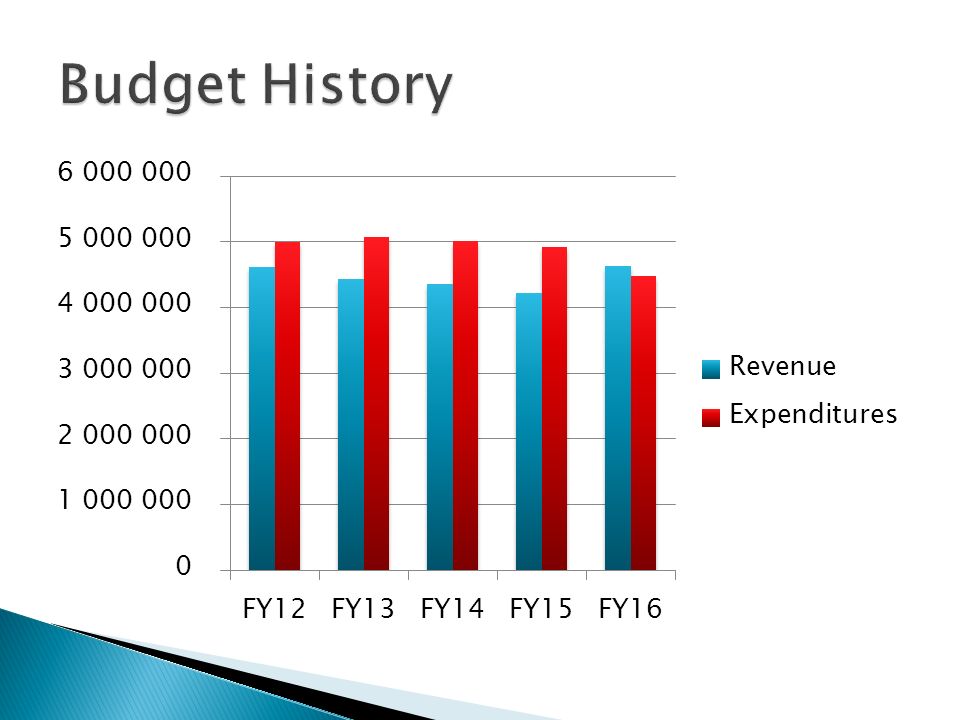
◦ Revenues $3,654,412 ◦ Expenditures $3,546,076 ◦ Surplus (Deficit) $90,336 * The District budgets conservatively... Revenues are estimated on the “low” side and expenditures are budgeted at “worst-case” scenarios.

31
Board Policy and ISBE direct that each District should strive to maintain fund balances between 15% and 20% of expenditure levels at the end of each fiscal year.

32
Recommended Fund Balances “Big 3 Operating Funds” for FY16 June 30 th Recommended Projected ◦ Ed = $619,711$120,234 ◦ Trans = $41,090$211,822 (Aging Bus Fleet) ◦ O&M = $48,067$120,234 Total = $708,868 $452,290 Total Below Recommended Level (-$256,578)
 ◦ O&M = $48,067$120,234 Total = $708,868 $452,290 Total Below Recommended Level (-$256,578)")
33
Adopting this Budget ◦ The District is not required to file a Deficit Reduction Plan with ISBE this year. ◦ We are still required to work with ISBE School Finance Officials to create Quarterly Cash Flow Reports and Projections ** ISBE School Finance Officials do not have a working budget and are restricted to their offices.**

35
Debt Service Fund ◦ Budgeted Revenues $480,652 ◦ Budgeted Expenditures $480,761 ◦ Surplus (Deficit) ($ 109) ◦ Estimated Fund Balance 7/1/15 $ 37,296 ◦ Projected Ending Fund Balance 6/30/16 $ 37,187
 ($ 109) ◦ Estimated Fund Balance 7/1/15 $ 37,296 ◦ Projected Ending Fund Balance 6/30/16 $ 37,187")
36
IMRF/Social Security Fund ◦ Budgeted Revenues $113,320 ◦ Budgeted Expenditures $123,466 ◦ Surplus (Deficit) ($ 10,146) ◦ Estimated Fund Balance 7/1/15 $ 51,049 ◦ Projected Ending Fund Balance 6/30/16 $ 40,903
 ($ 10,146) ◦ Estimated Fund Balance 7/1/15 $ 51,049 ◦ Projected Ending Fund Balance 6/30/16 $ 40,903")
37
Life Safety Fund ◦ Budgeted Revenues $ 48,910 ◦ Budgeted Expenditures $ 32,000 ◦ Surplus (Deficit) $ 16,910 ◦ Estimated Fund Balance 7/1/15 $179,465 ◦ Projected Ending Fund Balance 6/30/16 $196,375
 $ 16,910 ◦ Estimated Fund Balance 7/1/15 $179,465 ◦ Projected Ending Fund Balance 6/30/16 $196,375")
38
Tort Fund ◦ Budgeted Revenues $286,600 ◦ Budgeted Expenditures $280,757 ◦ Surplus (Deficit) $ 5,843 ◦ Estimated Fund Balance 7/1/14 $34,386 ◦ Projected Ending Fund Balance 6/30/15 $40,229
 $ 5,843 ◦ Estimated Fund Balance 7/1/14 $34,386 ◦ Projected Ending Fund Balance 6/30/15 $40,229")
Similar presentations


 Disbursements/Transfers- $10,305,826 Salaries and Benefits - $7,154,154 Supplies,>")


