Download presentation
Presentation is loading. Please wait.

1
Influence of Tax Policy on Green Power Utilization: An Empirical Investigation of Consumer Choice Wendy Wilhelm, Julie Lockhart, TJ Olney Western Washington University Bellingham, Washington Wendy Wilhelm, Julie Lockhart, TJ Olney Western Washington University Bellingham, Washington

2
Area of Interest n Effect of Tax Policy on Consumer Choice n Compare Tax Policies: Tax on Nonrenewables (punishment)Tax on Nonrenewables (punishment) “Green Tax” (Polluter Pays)“Green Tax” (Polluter Pays) Subsidy on Renewables (reward)Subsidy on Renewables (reward) Income Tax Credit (Taxpayer Incentives)Income Tax Credit (Taxpayer Incentives) Could Tax Policy Motivate Consumers to Switch to “Green” Utility Providers? n Effect of Tax Policy on Consumer Choice n Compare Tax Policies: Tax on Nonrenewables (punishment)Tax on Nonrenewables (punishment) “Green Tax” (Polluter Pays)“Green Tax” (Polluter Pays) Subsidy on Renewables (reward)Subsidy on Renewables (reward) Income Tax Credit (Taxpayer Incentives)Income Tax Credit (Taxpayer Incentives) Could Tax Policy Motivate Consumers to Switch to “Green” Utility Providers?
Tax on Nonrenewables (punishment) Green Tax (Polluter Pays) Green Tax (Polluter Pays) Subsidy on Renewables (reward)Subsidy on Renewables (reward) Income Tax Credit (Taxpayer Incentives)Income Tax Credit (Taxpayer Incentives) Could Tax Policy Motivate Consumers to Switch to Green Utility Providers .")
3
Focus: Electrical Utilities n Restructured electricity markets = residential customers can choose to purchase a green power product n Low penetration rate (1-2%): WHY? Premium price of green productPremium price of green product No financial incentives at consumer levelNo financial incentives at consumer level Little customer knowledge about important product attributesLittle customer knowledge about important product attributes InertiaInertia n Need for renewable fuel sources n Restructured electricity markets = residential customers can choose to purchase a green power product n Low penetration rate (1-2%): WHY? Premium price of green productPremium price of green product No financial incentives at consumer levelNo financial incentives at consumer level Little customer knowledge about important product attributesLittle customer knowledge about important product attributes InertiaInertia n Need for renewable fuel sources
: WHY. Premium price of green productPremium price of green product No financial incentives at consumer levelNo financial incentives at consumer level Little customer knowledge about important product attributesLittle customer knowledge about important product attributes InertiaInertia n Need for renewable fuel sources.")
4
Key Product Attributes in Consumer Choice of Electricity Products n Price n Financial incentives n Brand name of product n Reliability of Supplier n Ease of participation n Fuel mix n Emissions profile n Price n Financial incentives n Brand name of product n Reliability of Supplier n Ease of participation n Fuel mix n Emissions profile

5
Goals of Our Study n Identify relative importance of product attributes and attribute levels n Explore role of one particular attribute - Tax Policy – in encouraging switching to renewable power sources Environmental Tax on nonrenewables (punishment) versus Tax Credit on renewables (reward)Environmental Tax on nonrenewables (punishment) versus Tax Credit on renewables (reward) Expect Tax Credit to be more effectiveExpect Tax Credit to be more effective n Identify relative importance of product attributes and attribute levels n Explore role of one particular attribute - Tax Policy – in encouraging switching to renewable power sources Environmental Tax on nonrenewables (punishment) versus Tax Credit on renewables (reward)Environmental Tax on nonrenewables (punishment) versus Tax Credit on renewables (reward) Expect Tax Credit to be more effectiveExpect Tax Credit to be more effective
 versus Tax Credit on renewables (reward)Environmental Tax on nonrenewables (punishment) versus Tax Credit on renewables (reward) Expect Tax Credit to be more effectiveExpect Tax Credit to be more effective n Identify relative importance of product attributes and attribute levels n Explore role of one particular attribute - Tax Policy – in encouraging switching to renewable power sources Environmental Tax on nonrenewables (punishment) versus Tax Credit on renewables (reward)Environmental Tax on nonrenewables (punishment) versus Tax Credit on renewables (reward) Expect Tax Credit to be more effectiveExpect Tax Credit to be more effective")
6
MethodsMethods

7
Choice-Based Conjoint Analysis n Validated Model for Assessing Consumer Preferences: Realism of Choice Task n Combines Experimental Design Methods and Multivariate Analysis Based on models of discrete choice (logit)Based on models of discrete choice (logit) Interaction of product attributes is measuredInteraction of product attributes is measured n Results (part-worth utilities) can be used to: Determine attribute/levels importanceDetermine attribute/levels importance Identify “ideal” productIdentify “ideal” product Simulate share of preference (market share) for a specified set of productsSimulate share of preference (market share) for a specified set of products n Validated Model for Assessing Consumer Preferences: Realism of Choice Task n Combines Experimental Design Methods and Multivariate Analysis Based on models of discrete choice (logit)Based on models of discrete choice (logit) Interaction of product attributes is measuredInteraction of product attributes is measured n Results (part-worth utilities) can be used to: Determine attribute/levels importanceDetermine attribute/levels importance Identify “ideal” productIdentify “ideal” product Simulate share of preference (market share) for a specified set of productsSimulate share of preference (market share) for a specified set of products
Based on models of discrete choice (logit) Interaction of product attributes is measuredInteraction of product attributes is measured n Results (part-worth utilities) can be used to: Determine attribute/levels importanceDetermine attribute/levels importance Identify ideal productIdentify ideal product Simulate share of preference (market share) for a specified set of productsSimulate share of preference (market share) for a specified set of products n Validated Model for Assessing Consumer Preferences: Realism of Choice Task n Combines Experimental Design Methods and Multivariate Analysis Based on models of discrete choice (logit)Based on models of discrete choice (logit) Interaction of product attributes is measuredInteraction of product attributes is measured n Results (part-worth utilities) can be used to: Determine attribute/levels importanceDetermine attribute/levels importance Identify ideal productIdentify ideal product Simulate share of preference (market share) for a specified set of productsSimulate share of preference (market share) for a specified set of products")
8
Fuel Mix: 75% of electricity from renewable fuel Fuel Mix: 25% of electricity from renewable fuel Renewable Fuel: Solar Energy Renewable Fuel: Hydro Power Emissions Profile: < 50% regional average Emissions Profile: > 25% regional average Monthly Electric Bill (before tax/credit): $80 [8 cents/kWh] Monthly Electric Bill (before tax/credit): $60 [6 cents/kWh] Tax Policy: 20% income tax credit on renewable fuel content Tax Policy: 20% environmental tax on non-renewable content Total Monthly Cost: $68.00 Total Monthly Cost: $69.00 Choose by clicking one of the buttons above. Example of Choice Task
![Fuel Mix: 75% of electricity from renewable fuel Fuel Mix: 25% of electricity from renewable fuel Renewable Fuel: Solar Energy Renewable Fuel: Hydro Power Emissions Profile: < 50% regional average Emissions Profile: > 25% regional average Monthly Electric Bill (before tax/credit): $80 [8 cents/kWh] Monthly Electric Bill (before tax/credit): $60 [6 cents/kWh] Tax Policy: 20% income tax credit on renewable fuel content Tax Policy: 20% environmental tax on non-renewable content Total Monthly Cost: $68.00 Total Monthly Cost: $69.00 Choose by clicking one of the buttons above.](http://images.slideplayer.com/25/7881015/slides/slide_8.jpg "Example of Choice Task.")
9
Methods: 5 Product Attributes n Fuel mix (% electricity from renewable fuels) 5%; 25%; 50%; 75%; 95%5%; 25%; 50%; 75%; 95% n Renewable Fuel Type Solar; Wind; Biomass; Hydro; GeothermalSolar; Wind; Biomass; Hydro; Geothermal n Emission profile (nonrenewable, vs. regional avg.) no change; 25% or 50% more or lessno change; 25% or 50% more or less n Cost: Avg. monthly electric bill (before tax/credit) $40; $60; $80; $100; $120 (4-12 cents/kWh)$40; $60; $80; $100; $120 (4-12 cents/kWh) n Tax Policy: 10% or 20% Tax on nonrenewable fuel10% or 20% Tax on nonrenewable fuel 10% or 20% Income Tax Credit, renewable fuel10% or 20% Income Tax Credit, renewable fuel No Tax or Tax CreditNo Tax or Tax Credit n Fuel mix (% electricity from renewable fuels) 5%; 25%; 50%; 75%; 95%5%; 25%; 50%; 75%; 95% n Renewable Fuel Type Solar; Wind; Biomass; Hydro; GeothermalSolar; Wind; Biomass; Hydro; Geothermal n Emission profile (nonrenewable, vs. regional avg.) no change; 25% or 50% more or lessno change; 25% or 50% more or less n Cost: Avg. monthly electric bill (before tax/credit) $40; $60; $80; $100; $120 (4-12 cents/kWh)$40; $60; $80; $100; $120 (4-12 cents/kWh) n Tax Policy: 10% or 20% Tax on nonrenewable fuel10% or 20% Tax on nonrenewable fuel 10% or 20% Income Tax Credit, renewable fuel10% or 20% Income Tax Credit, renewable fuel No Tax or Tax CreditNo Tax or Tax Credit
 no change; 25% or 50% more or lessno change; 25% or 50% more or less n Cost: Avg. monthly electric bill (before tax/credit) $40; $60; $80; $100; $120 (4-12 cents/kWh)$40; $60; $80; $100; $120 (4-12 cents/kWh) n Tax Policy: 10% or 20% Tax on nonrenewable fuel10% or 20% Tax on nonrenewable fuel 10% or 20% Income Tax Credit, renewable fuel10% or 20% Income Tax Credit, renewable fuel No Tax or Tax CreditNo Tax or Tax Credit n Fuel mix (% electricity from renewable fuels) 5%; 25%; 50%; 75%; 95%5%; 25%; 50%; 75%; 95% n Renewable Fuel Type Solar; Wind; Biomass; Hydro; GeothermalSolar; Wind; Biomass; Hydro; Geothermal n Emission profile (nonrenewable, vs. regional avg.) no change; 25% or 50% more or lessno change; 25% or 50% more or less n Cost: Avg. monthly electric bill (before tax/credit) $40; $60; $80; $100; $120 (4-12 cents/kWh)$40; $60; $80; $100; $120 (4-12 cents/kWh) n Tax Policy: 10% or 20% Tax on nonrenewable fuel10% or 20% Tax on nonrenewable fuel 10% or 20% Income Tax Credit, renewable fuel10% or 20% Income Tax Credit, renewable fuel No Tax or Tax CreditNo Tax or Tax Credit.")
10
Methods: Respondents Asked to Assume n May choose any offered electricity product n 6 month trial period n By current supplier n May switch supplier after 6 month trial n All sources highly & equally reliable n May choose any offered electricity product n 6 month trial period n By current supplier n May switch supplier after 6 month trial n All sources highly & equally reliable

11
Methods: Sample Selection Pilot Study (2001)* n CBC analysis n Homeowners in WA Survey Sampling, IncSurvey Sampling, Inc Probability SampleProbability Sample Owned PC/Windows 98Owned PC/Windows 98 n Disk by mail n 1000 Disks Sent n 228 responses (23%) Pilot Study (2001)* n CBC analysis n Homeowners in WA Survey Sampling, IncSurvey Sampling, Inc Probability SampleProbability Sample Owned PC/Windows 98Owned PC/Windows 98 n Disk by mail n 1000 Disks Sent n 228 responses (23%) Current Study n CBC analysis n Nationwide (USA) Survey Sampling, Inc Probability Sample Utility Bill payers Opt-in email panel n Web-based n 3000 emails sent n 355 responses (12%) *NW Journal Bus & Econ, 2001;43-66.
* n CBC analysis n Homeowners in WA Survey Sampling, IncSurvey Sampling, Inc Probability SampleProbability Sample Owned PC/Windows 98Owned PC/Windows 98 n Disk by mail n 1000 Disks Sent n 228 responses (23%) Pilot Study (2001)* n CBC analysis n Homeowners in WA Survey Sampling, IncSurvey Sampling, Inc Probability SampleProbability Sample Owned PC/Windows 98Owned PC/Windows 98 n Disk by mail n 1000 Disks Sent n 228 responses (23%) Current Study n CBC analysis n Nationwide (USA) Survey Sampling, Inc Probability Sample Utility Bill payers Opt-in panel n Web-based n s sent n 355 responses (12%) *NW Journal Bus & Econ, 2001;43-66.")
12
Fuel Mix: 75% of electricity from renewable fuel Fuel Mix: 25% of electricity from renewable fuel Renewable Fuel: Solar Energy Renewable Fuel: Hydro Power Emissions Profile: < 50% regional average Emissions Profile: > 25% regional average Monthly Electric Bill (before tax/credit): $80 [8 cents/kWh] Monthly Electric Bill (before tax/credit): $60 [6 cents/kWh] Tax Policy: 20% income tax credit on renewable fuel content Tax Policy: 20% environmental tax on non-renewable content Total Monthly Cost: $68.00 Total Monthly Cost: $69.00 Choose by clicking one of the buttons above. Example of Choice Task: 13 Choices
![Fuel Mix: 75% of electricity from renewable fuel Fuel Mix: 25% of electricity from renewable fuel Renewable Fuel: Solar Energy Renewable Fuel: Hydro Power Emissions Profile: < 50% regional average Emissions Profile: > 25% regional average Monthly Electric Bill (before tax/credit): $80 [8 cents/kWh] Monthly Electric Bill (before tax/credit): $60 [6 cents/kWh] Tax Policy: 20% income tax credit on renewable fuel content Tax Policy: 20% environmental tax on non-renewable content Total Monthly Cost: $68.00 Total Monthly Cost: $69.00 Choose by clicking one of the buttons above.](http://images.slideplayer.com/25/7881015/slides/slide_12.jpg "Example of Choice Task: 13 Choices.")
13
Methods: Quantitative Analysis n Choice Data: Multinomial LogitMultinomial Logit Hierarchical BayesHierarchical Bayes Chi-SquareChi-Square n Part-worth utilities = importance “weights” n Market Simulations Share of preference for various market scenarios:Share of preference for various market scenarios: Scenario = set of products on marketScenario = set of products on market Share of Preference = Market ShareShare of Preference = Market Share n Choice Data: Multinomial LogitMultinomial Logit Hierarchical BayesHierarchical Bayes Chi-SquareChi-Square n Part-worth utilities = importance “weights” n Market Simulations Share of preference for various market scenarios:Share of preference for various market scenarios: Scenario = set of products on marketScenario = set of products on market Share of Preference = Market ShareShare of Preference = Market Share Estimation of individual part worths

14
Results and Discussion

15
USA Sample USA Sample Income$41,994 $45,500 High School 29% 33% College 16% 19% Female 51% 70% Causasian 75% 95% USA Sample USA Sample Income$41,994 $45,500 High School 29% 33% College 16% 19% Female 51% 70% Causasian 75% 95% Results: Sample Demographics No demographic differences in attribute importance weights

16
Relative Importance of 5 Product Attributes on Choice of Electricity Product Product Attribute RelativeImportanceweight Within Attribute Chi-square (p value) Monthly Electric Bill (before tax/credit) 47.51 767.11 767.11 (p<.01) (p<.01) Emissions Level (vs. regional average) 15.49 71.31 71.31 (p<.01) (p<.01) Fuel Mix (% renewable fuel) 12.34 37.20 37.20 (p<.01) (p<.01) Tax Policy 11.73 30.36 30.36 (p<.01) (p<.01) Type of Renewable Fuel 6.83 11.23 11.23 (p<.05) (p<.05)
 (p<.01) (p<.01) Fuel Mix (% renewable fuel) (p<.01) (p<.01) Tax Policy (p<.01) (p<.01) Type of Renewable Fuel (p<.05) (p<.05).")
17
Discussion: Product Attribute Cost is 3 times more important than the 2 nd ranked attribute, Emissions Level Tax policy has a statistically significant influence on choice. Cost is 3 times more important than the 2 nd ranked attribute, Emissions Level Tax policy has a statistically significant influence on choice.

18
Ranking of Attribute Level Preferences Ranking Monthly Electric Bill Level(part-worth) Emissions Level vs. regional average Level(part-worth) Fuel Mix % renewable fuel % renewable fuelLevel(part-worth) Tax Policy Level Level(part-worth)Renewable Fuel Type Level (part-worth ) 1 $40 (134.72) $40 (134.72) 50% less (32.17) 50% less (32.17) 95% (31.96) 95% (31.96) 20% credit (34.62) Solar * (7.94) Solar * (7.94) 2 $60 (67.09) $60 (67.09) 25% less (25.10) 25% less (25.10) 75% (23.24) 75% (23.24) 10% credit (11.56) Hydro * (6.65) Hydro * (6.65) 3 $80 $80(3.82) Same (6.51) Same (6.51) 50% * 50% * (-8.13) 2 No tax/credit (-8.88) Wind * (4.24) Wind * (4.24) 4 $100 $100(-63.64) 25% more 25% more(-17.91) 25% * 25% * (-9.13) 2 10% tax (-15.11) Geothermal Geothermal(-3.01) 5 $120 $120(-141.99) 50% more 50% more(-45.87) 5% 5%(-37.95) 20% tax (-22.19) Biomass Biomass(-15.83) Most Preferred in Group *Not Statistically Different
 Fuel Mix % renewable fuel % renewable fuelLevel(part-worth) Tax Policy Level Level(part-worth)Renewable Fuel Type Level (part-worth ) 1 $40 (134.72) $40 (134.72) 50% less (32.17) 50% less (32.17) 95% (31.96) 95% (31.96) 20% credit (34.62) Solar * (7.94) Solar * (7.94) 2 $60 (67.09) $60 (67.09) 25% less (25.10) 25% less (25.10) 75% (23.24) 75% (23.24) 10% credit (11.56) Hydro * (6.65) Hydro * (6.65) 3 $80 $80(3.82) Same (6.51) Same (6.51) 50% * 50% * (-8.13) 2 No tax/credit (-8.88) Wind * (4.24) Wind * (4.24) 4 $100 $100(-63.64) 25% more 25% more(-17.91) 25% * 25% * (-9.13) 2 10% tax (-15.11) Geothermal Geothermal(-3.01) 5 $120 $120( ) 50% more 50% more(-45.87) 5% 5%(-37.95) 20% tax (-22.19) Biomass Biomass(-15.83) Most Preferred in Group *Not Statistically Different.")
19
Discussion: Preference Ranking Consumers strongly prefer a Tax Credit on renewable sources to either Status Quo or to a Tax on nonrenewable sources. Consumers do not significantly differentiate between Solar, Wind, & Hydro sources. between Solar, Wind, & Hydro sources. Consumers strongly prefer a Tax Credit on renewable sources to either Status Quo or to a Tax on nonrenewable sources. Consumers do not significantly differentiate between Solar, Wind, & Hydro sources. between Solar, Wind, & Hydro sources.

20
Market Simulations: Two Products available: which preferred? Status Quo Green Renewable Sources5%95% Non-Renewable 95% 5% Emissions Avg. 50% less Cost (before tax/credit) $100$120 Status Quo Green Renewable Sources5%95% Non-Renewable 95% 5% Emissions Avg. 50% less Cost (before tax/credit) $100$120 How Does Tax Policy Affect Consumer Preference for Hypothetical Green Products?
 $100$120 Status Quo Green Renewable Sources5%95% Non-Renewable 95% 5% Emissions Avg. 50% less Cost (before tax/credit) $100$120 How Does Tax Policy Affect Consumer Preference for Hypothetical Green Products .")
22
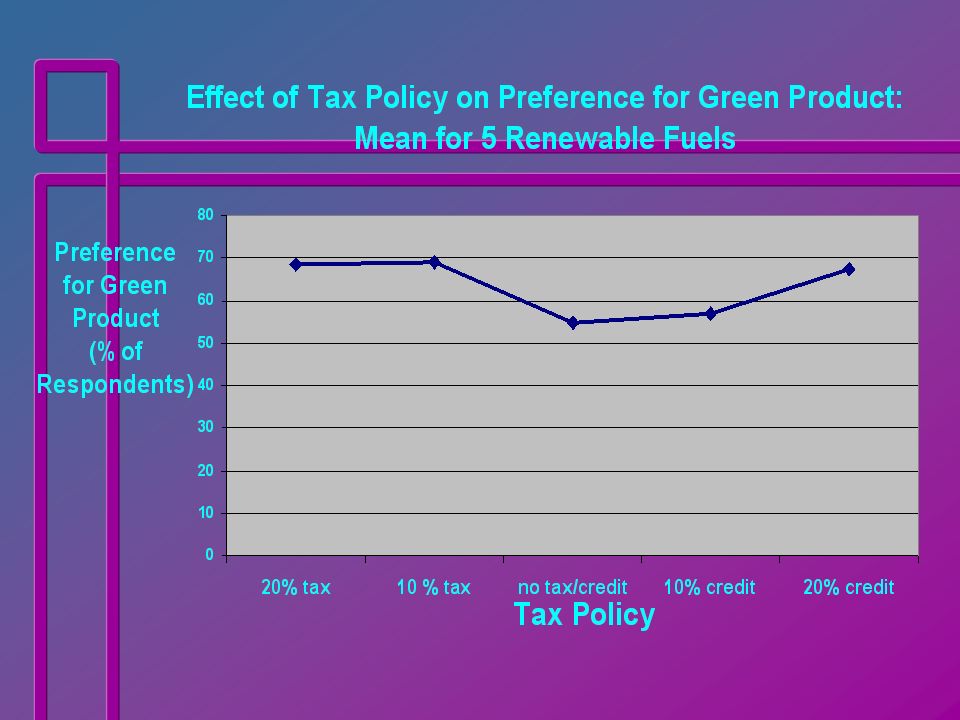
Discussion: Effect of Tax Policy n Certain fuel types may be insensitive to tax policy n For those fuel types – wind, hydro, biomass - sensitive to tax policy: At least half of customers will choose a GPAt least half of customers will choose a GP regardless of tax policy (even with a $20 premium) Asymmetrical Threshold Effect:Asymmetrical Threshold Effect: 20% Credit = 10% Tax 20% Credit = 10% Tax (GP=$97, SQ=$100) (GP=$120, SQ= $110) (GP=$97, SQ=$100) (GP=$120, SQ= $110) Both equally effective in motivating consumers to choose the green product (70-78% share) n Certain fuel types may be insensitive to tax policy n For those fuel types – wind, hydro, biomass - sensitive to tax policy: At least half of customers will choose a GPAt least half of customers will choose a GP regardless of tax policy (even with a $20 premium) Asymmetrical Threshold Effect:Asymmetrical Threshold Effect: 20% Credit = 10% Tax 20% Credit = 10% Tax (GP=$97, SQ=$100) (GP=$120, SQ= $110) (GP=$97, SQ=$100) (GP=$120, SQ= $110) Both equally effective in motivating consumers to choose the green product (70-78% share)
 Asymmetrical Threshold Effect:Asymmetrical Threshold Effect: 20% Credit = 10% Tax 20% Credit = 10% Tax (GP=$97, SQ=$100) (GP=$120, SQ= $110) (GP=$97, SQ=$100) (GP=$120, SQ= $110) Both equally effective in motivating consumers to choose the green product (70-78% share) n Certain fuel types may be insensitive to tax policy n For those fuel types – wind, hydro, biomass - sensitive to tax policy: At least half of customers will choose a GPAt least half of customers will choose a GP regardless of tax policy (even with a $20 premium) Asymmetrical Threshold Effect:Asymmetrical Threshold Effect: 20% Credit = 10% Tax 20% Credit = 10% Tax (GP=$97, SQ=$100) (GP=$120, SQ= $110) (GP=$97, SQ=$100) (GP=$120, SQ= $110) Both equally effective in motivating consumers to choose the green product (70-78% share)")
23
Conclusions & Implications n Cost remains most important consideration n Tax policy impacts choice of an electricity product Effectiveness of tax policy varies with renewableEffectiveness of tax policy varies with renewable n Income tax credits are viable tools Encourages switching to green power productsEncourages switching to green power products More politically viable than Environmental TaxMore politically viable than Environmental Tax Implications for government budgetsImplications for government budgets n Threshold level is important to effectiveness of tool n Combination of policy tools Green tax could fund income tax creditGreen tax could fund income tax credit Need education and awareness = relearn product categoryNeed education and awareness = relearn product category n No demographic or psychographic differences n Cost remains most important consideration n Tax policy impacts choice of an electricity product Effectiveness of tax policy varies with renewableEffectiveness of tax policy varies with renewable n Income tax credits are viable tools Encourages switching to green power productsEncourages switching to green power products More politically viable than Environmental TaxMore politically viable than Environmental Tax Implications for government budgetsImplications for government budgets n Threshold level is important to effectiveness of tool n Combination of policy tools Green tax could fund income tax creditGreen tax could fund income tax credit Need education and awareness = relearn product categoryNeed education and awareness = relearn product category n No demographic or psychographic differences

24
Limitations of Study n Impact of income tax credit is deferred Tax would be applied to utility billTax would be applied to utility bill n Assumptions: reliability & credibility of supplier n Study sample: early adopters n Findings limited to electricity products What about other green products?What about other green products? alternative fuel automobiles?alternative fuel automobiles? n Impact of income tax credit is deferred Tax would be applied to utility billTax would be applied to utility bill n Assumptions: reliability & credibility of supplier n Study sample: early adopters n Findings limited to electricity products What about other green products?What about other green products? alternative fuel automobiles?alternative fuel automobiles?

25
Teaching Applications n Use as a case study in courses on Environmental Tax (Lockhart) & Consumer Behavior (Wilhelm) n Use data in teaching conjoint analysis in Marketing Research course (Wilhelm) n Include students in projects as co-authors, beta testers, respondents n Promote discussion of how business concepts and tools can be applied to environmental and sustainability issues n Use as a case study in courses on Environmental Tax (Lockhart) & Consumer Behavior (Wilhelm) n Use data in teaching conjoint analysis in Marketing Research course (Wilhelm) n Include students in projects as co-authors, beta testers, respondents n Promote discussion of how business concepts and tools can be applied to environmental and sustainability issues
 & Consumer Behavior (Wilhelm) n Use data in teaching conjoint analysis in Marketing Research course (Wilhelm) n Include students in projects as co-authors, beta testers, respondents n Promote discussion of how business concepts and tools can be applied to environmental and sustainability issues n Use as a case study in courses on Environmental Tax (Lockhart) & Consumer Behavior (Wilhelm) n Use data in teaching conjoint analysis in Marketing Research course (Wilhelm) n Include students in projects as co-authors, beta testers, respondents n Promote discussion of how business concepts and tools can be applied to environmental and sustainability issues")
26
THANK YOU!

27
Limitations of Green Tax n Lobbying behavior Fear of competitive disadvantageFear of competitive disadvantage Anti-tax sentimentAnti-tax sentiment n Taxes don’t correctly price externalities Localized vs Pervasive (Daly & Cobb, 1989)Localized vs Pervasive (Daly & Cobb, 1989) n “State Failure” (Andersen, 1994) Integrated pollution control strategiesIntegrated pollution control strategies Punishment Strategy has Limited Efficacy n Lobbying behavior Fear of competitive disadvantageFear of competitive disadvantage Anti-tax sentimentAnti-tax sentiment n Taxes don’t correctly price externalities Localized vs Pervasive (Daly & Cobb, 1989)Localized vs Pervasive (Daly & Cobb, 1989) n “State Failure” (Andersen, 1994) Integrated pollution control strategiesIntegrated pollution control strategies Punishment Strategy has Limited Efficacy
Localized vs Pervasive (Daly & Cobb, 1989) n State Failure (Andersen, 1994) Integrated pollution control strategiesIntegrated pollution control strategies Punishment Strategy has Limited Efficacy n Lobbying behavior Fear of competitive disadvantageFear of competitive disadvantage Anti-tax sentimentAnti-tax sentiment n Taxes don’t correctly price externalities Localized vs Pervasive (Daly & Cobb, 1989)Localized vs Pervasive (Daly & Cobb, 1989) n State Failure (Andersen, 1994) Integrated pollution control strategiesIntegrated pollution control strategies Punishment Strategy has Limited Efficacy")
28
The Tax Credit Option n Government must fund n Used in US by State & Local Gov’t n Shifts decisions to private sector Stimulates innovative solutionsStimulates innovative solutions Not always appropriateNot always appropriate n May be more acceptable politically Reward Strategy May Provide Better Results n Government must fund n Used in US by State & Local Gov’t n Shifts decisions to private sector Stimulates innovative solutionsStimulates innovative solutions Not always appropriateNot always appropriate n May be more acceptable politically Reward Strategy May Provide Better Results

29
HypothesesHypotheses n H1: Tax Policy is a significant factor in determining choice of a residential electricity product. n H2: An income tax credit on a green electricity product is preferred over an environmental tax on a non-renewable electricity product, all else being equal. n H3: Consumers are indifferent between a non- renewable electricity product with a 10% tax and a green product with a 20% tax credit. n H1: Tax Policy is a significant factor in determining choice of a residential electricity product. n H2: An income tax credit on a green electricity product is preferred over an environmental tax on a non-renewable electricity product, all else being equal. n H3: Consumers are indifferent between a non- renewable electricity product with a 10% tax and a green product with a 20% tax credit.

30
Methods: Survey n Choice-based conjoint Survey n Preference for various electricity products n 10 randomized choice tasks Importance of electricity product attributesImportance of electricity product attributes n 3 fixed tasks Predictive Validity + 1 st task = trial runPredictive Validity + 1 st task = trial run n Other questions Predictors of pro-environment behaviorPredictors of pro-environment behavior n Randomized for each respondent n Choice-based conjoint Survey n Preference for various electricity products n 10 randomized choice tasks Importance of electricity product attributesImportance of electricity product attributes n 3 fixed tasks Predictive Validity + 1 st task = trial runPredictive Validity + 1 st task = trial run n Other questions Predictors of pro-environment behaviorPredictors of pro-environment behavior n Randomized for each respondent

32
Influence of 10% vs 20% Income Tax Credit on Share of Preference for Green Electricity Product Product Attributes Status Quo Product Status Quo + Tax 10% Tax Green + Credit 10% vs 20% Monthly Bill $100$100$120 Emissions Level AverageAverage 50% less Fuel Mix 5% renewables 95% renewables Tax Policy No tax 10% tax 10% credit 20% credit Total Cost $100$110$109$97 Share of Preference 45% 45% 30% 30%2%2% 53% 53% 68% 68%

33
Discussion: Power of Tax Credit When given a choice between status quo, 10% Tax, or 10% Tax Credit, more than half of consumers choose Credit. 15% more consumers will convert to Green electrical products with a 20% Credit than with a 10% Credit. When given a choice between status quo, 10% Tax, or 10% Tax Credit, more than half of consumers choose Credit. 15% more consumers will convert to Green electrical products with a 20% Credit than with a 10% Credit.

34
RemarksRemarks n Main effects model Income tax credit preferredIncome tax credit preferred n Interaction effects 10% tax on nonrenewable10% tax on nonrenewable 20% credit on renewable20% credit on renewable For wind, hydro, biomassFor wind, hydro, biomass n Threshold implications Overall finding— green products preferred until they cost more! n Main effects model Income tax credit preferredIncome tax credit preferred n Interaction effects 10% tax on nonrenewable10% tax on nonrenewable 20% credit on renewable20% credit on renewable For wind, hydro, biomassFor wind, hydro, biomass n Threshold implications Overall finding— green products preferred until they cost more! Same Effect

Similar presentations


 Copyright Sawtooth Software, Inc.>")


 Accommodating “panel data” Multinomial.>")


![[9.4] Market Research Essential idea: Market research is any organized effort to gather information about markets or customers.](/19/5840313/big_thumb.jpg "[9.4] Market Research Essential idea: Market research is any organized effort to gather information about markets or customers.>")


