Download presentation
Presentation is loading. Please wait.

1
Genuine Progress Index for Atlantic Canada Indice de progrès véritable - Atlantique The Genuine Progress Index in Practice Auckland and Wellington, 21-22 April, 2008

2
About GPI Atlantic Non-profit, fully independent, research and education organization founded April, 1997. Based in Halifax; Web site: www.gpiatlantic.org Committed to development of Genuine Progress Index (GPI): Measuring wellbeing & sustainable development accurately and comprehensively Towards full-cost accounting: human, social, natural, and produced capital accounts NS focus ->National and international activities
: Measuring wellbeing & sustainable development accurately and comprehensively Towards full-cost accounting: human, social, natural, and produced capital accounts NS focus ->National and international activities.")
3
Origins 1st GPI 1995 – Redefining Progress, California Emerged from critique of shortcomings of GDP- based measures of progress (Kuznets warning) Distinguished from quality of life indicator systems by adding economic valuation 1995 GPI – single $ number; Statcan critique = starting point for NS GPI (1996) as pilot for Canada. 12 years developmental work.

4
Basic question: How are we doing? What kind of NZ are we leaving our children...?

5
Current way of answering that question: GDP-based measures of progress inadequate and can be dangerously misleading. E.g: Natural resource depletion as gain No distinction re what is growing (e.g. pollution, crime [US stats], sickness, cigarettes) Vital social, environmental assets + value of unpaid work, free time, health, education, equity ignored
 Vital social, environmental assets + value of unpaid work, free time, health, education, equity ignored.")
6
Why We Need New Indicators - Policy Reasons: More energy use, greenhouse gas emissions, consumption, drug use make economy grow = not the signals we may want to communicate Preventive initiatives to conserve and use energy and resources sustainably, to reduce sickness, crime, poverty, greenhouse gas emissions, may be blunted, or inadequately funded

7
Indicators are Powerful What we measure: reflect what we value as a society; determines what makes it onto the policy agenda; influences behaviour (e.g. students) Logic not refuted: From wilderness to mainstream: OECD, EU, SNA, CIW
 Logic not refuted: From wilderness to mainstream: OECD, EU, SNA, CIW.")
8
Natural environment Society Economy

9
That framework addresses question: Are we living sustainably? Source: Hoggan, James. Globe Presentation: Communicating Sustainability, 2006

10
Measuring Wellbeing: Health, free time, unpaid work (voluntary and household), and education have value Sickness, crime, disasters, pollution are costs Natural resources (e.g. forests) are capital assets Reductions in greenhouse gas, crime, poverty, ecological footprint are progress Growing equity signals progress In the GPI…
 are capital assets Reductions in greenhouse gas, crime, poverty, ecological footprint are progress Growing equity signals progress In the GPI….")
11
Beyond indicators and towards accounting and policy shift… E.g. Ideal world: Neither indicators nor economic valuation is required: Social, economic, environmental impacts would be taken into account in all decisions. BUT GDP is accounting system, not indicator system. While economic growth statistics dominate, economic valuation currently has most impact on policy In GPI, economic valuations = add-on to indicators based on physical measurement; brings holistic indicator set into policy arena

12
Examples of policy impacts: E.g. NS voluntary work worth $1.9 bill/year Preventable chronic disease costs NS $500m in excess health care costs –> DHPP; costs tobacco, obesity, inactivity –> e.g. HRM planning process; smoke-free legislation Full CBAs – e.g. Solid Waste; Halifax Harbour cleanup; HRM transportation …. Etc. Impact on policy can be indirect (e.g. forests)
.")
13
Full-Cost Accounting: 4 principles Internalize ‘externalities’ (e.g. GHG emissions) Recognize economic value of non-market factors (e.g. voluntary work) Fixed -> variable costs (e.g. car registration, insurance a/c km driven) $ values - strategic only = inadequacy of $ as valuation instrument. “Value” = larger
 Recognize economic value of non-market factors (e.g. voluntary work) Fixed -> variable costs (e.g. car registration, insurance a/c km driven) $ values - strategic only = inadequacy of $ as valuation instrument. Value = larger.")
14
E.g. Full transport costs Internal variable (Direct costs according to how much a person drives) –E.g. travel time, vehicle operation Internal fixed (Direct costs that are not really changed when driving habits change) –E.g. vehicle ownership, registration/insurance, parking External (Costs imposed on others) - E.g. climate change, air pollution, congestion Or direct/indirect (based on subjective experience) -E.g. subsidized parking
 –E.g. travel time, vehicle operation Internal fixed (Direct costs that are not really changed when driving habits change) –E.g. vehicle ownership, registration/insurance, parking External (Costs imposed on others) - E.g. climate change, air pollution, congestion Or direct/indirect (based on subjective experience) -E.g. subsidized parking.")
15
Per Capita and Total Estimates for Road Passenger Transportation (C$2002)
")
16
Each cost a potential headliner E.g. Congestion costs NS $12m/yr Lost time, gas, excess GHGs Conservative: Recurrent congestion only (not snow, roadworks, accidents etc.), AM- PM only, no freight, arterials only (no side- streets), based on <50% posted limit, etc. = Small portion total costs
, AM- PM only, no freight, arterials only (no side- streets), based on <50% posted limit, etc. = Small portion total costs.")
17
Average Car Costs (per vehicle-km) Ranked by Magnitude
 Ranked by Magnitude")
18
Aggregate Distribution of Costs for an Average Car

19
Full-Cost Accounting Results Overall full cost of N.S. road transportation system in 2002: $6.4 billion - $13.3 billion True cost is about $7,598/capita, of which $4,562 are “invisible” costs Fixed and external costs account for over 2/3 of total cost These results indicate an inefficient, unsustainable transportation system where externalities conceal the full costs to society

21
Results Implementation of the Solid Waste-Resource Strategy led to an increase in operating and amortized costs from $48.6 million ($53/capita) in the 1996-97 fiscal year to $72.5 million ($77/capita) in the 2000-01 fiscal year. –An increased cost of $24 million ($25/capita) for implementing the changes = conventional accounts stop there
 for implementing the changes = conventional accounts stop there.")
22
Full cost Accounting Results The new NS solid waste-resource system in 2000-01 produced net savings of at least $31.2 million, when compared to the old 1996-97 solid waste-resource system This translates into savings of $33 for each Nova Scotian, versus a cost of $25 as suggested when comparing strictly the operating and amortized capital costs of the two systems

23
Benefits Total benefits of 2000-01 system range from $79 million to $221 million =$84-$236 pp, incl: –$3.3 - $84.3 million in GHG emission reductions; –$9 - $67 million in air pollutant reductions –$18.8 million in extended landfill life –$28.6 million in energy savings from recycling –$6.5 - $8.9 million in employment benefits –$1.2 - $1.9 million in avoided liability costs –$1.1 - $1.7 million in export revenue of goods and services –$187,000 in additional tourism

24
Energy savings per tonne of waste recycled MaterialEnergy savings Paper8.5 million Btu Plastic20.1 million Btu Glass2.4 million Btu Steel Cans18.4 million Btu Aluminium Cans166.9 million Btu

25
Costs Total costs of 2000-01 solid waste-resource system were $96.6-102.7 million: –$72.4 m. in operating and amortized capital costs –$14.3 m. for beverage container recycling prog. –$2.7 million for used tire management program –$1.6 million in RRFB operating and admin costs –$5 - $9.5 million to increase participation –$220,000 - $1.8 million in nuisance costs

26
Solid Waste Conclusions 1995 NS Solid Waste-Resource Strategy has led to a considerable net benefit, both in monetary and non-monetary terms: 1) The solid waste-resource system in 2000-01, despite increased operating and amortized capital costs, provided a net savings of between $31 million and $167.7 million compared to the operating and amortized capital costs of the old system
 The solid waste-resource system in , despite increased operating and amortized capital costs, provided a net savings of between $31 million and $167.7 million compared to the operating and amortized capital costs of the old system")
27
Solid Waste Conclusions 2) Nova Scotia is a leader both internationally and nationally in solid waste diversion. 3) The accessibility, comprehensiveness, and levels of waste being composted and recycled have all improved since the introduction of the Solid Waste-Resource Strategy.
 The accessibility, comprehensiveness, and levels of waste being composted and recycled have all improved since the introduction of the Solid Waste-Resource Strategy..")
28
This is Genuine Progress – Access to curbside recycling in Nova Scotia jumped from less than 5% in 1989 to 99% today – 76% of residents now have access to curbside organics pickup – Both are by far the highest rates in the country

29
Policy uses of FCA Three Steps: Accounting basis (GPI) System of financial incentives and penalties = government action Prices that reflect true benefits and costs
 System of financial incentives and penalties = government action Prices that reflect true benefits and costs")
30
The Genuine Progress Index - 85 detailed reports to date: Time Use Economic Value of Unpaid Childcare and Housework √ Economic Value of Civic and Voluntary Work √ Value of Leisure Time √ Working Time and Employment √

31
Human Impact on the Environment Greenhouse Gas Emissions √ Sustainable Transportation √ Ecological Footprint Analysis √ Solid Waste √ Natural Capital Soils and Agriculture (3 = √; 2 = …) Forests √ Marine Environment/Fisheries √ Water Resources / Water Quality √ Energy √ Air Quality √ Nova Scotia Genuine Progress Index: Components
 Forests √ Marine Environment/Fisheries √ Water Resources / Water Quality √ Energy √ Air Quality √ Nova Scotia Genuine Progress Index: Components")
32
Social and Human Capital Population Health √ Educational Attainment √ Costs of Crime √ Living Standards Income Distribution √ Debt and Assets …. Economic Security …. Nova Scotia Genuine Progress Index: Components

33
Next Steps: - (A) Complete detailed, separate components Released ’08: Education, HRM transportation + Complete last 3 components by June ‘08 90+ detailed reports = Most complete data set available to any jurisdiction in North America to measure wellbeing and sustainable dev’t Statcan advice – bottom up, methodological, data integrity. Withstand expert scrutiny. Transparency, references.

34
Next steps – (B) Integration Now -> policy utility, integration, update: 1.Headline indicators – community (May 08) 2.Database – easily updatable, replicable (Jul.08) 3.Headline indicators – provincial (Sept. 08) Oct. 08: Major release – Formal presentation to Premier, Government, and People of NS = Landmark moment in evolution of GPI
 Oct. 08: Major release – Formal presentation to Premier, Government, and People of NS = Landmark moment in evolution of GPI.")
35
Different GPIs: Shared principles, objectives, strategy Shared critique of GDP-based measures Shared understanding of inter-related nature of reality, and need to integrate social, environmental, and economic measures in a comprehensive system Shared strategy of using economic valuations (conversation with Redefining Progress)
")
36
Different GPI Methods, Approaches Monetization of all variables vs view that many measures not amenable to monetization (-> comprehensiveness) Aggregation or not (-> communication, ‘doorway’, weighting, policy utility, and double counting not an issue, so no need to omit evidence from any component Top-down framework vs bottom-up (eg: by component, forest example, educ. framework)
.")
37
Different GPI Methods, Approaches Start with ‘personal consumption’ + add household work? (-> challenge growth paradigm? a ‘green’ GDP? replace GDP?) Range of technical issues (stocks vs flows, etc.) Communication: All at once vs infiltration
 Range of technical issues (stocks vs flows, etc.) Communication: All at once vs infiltration.")
38
Therefore communication: Must speak effectively to 3 audiences: Experts (credibility as basis) Policy audience General public (use of media) -Infiltration over time vs one big release: Water against a rock (others including govt. cite GPI #s as own; radio talk shows)
.")
39
Politics and Uptake: Measuring progress is normative But GPI based on consensus values Economic and livelihood security Health, free time Educational attainment Strong and safe communities Clean environment, healthy natural resources

40
Political implications Non-partisan; Evidence-based decision making Good news (e.g. waste, air quality, seniors, employment); Bad news (e.g. GHGs, old forests); Improvements (e.g. income dist.) Consensus on goals, vision. Politics is about how to get there. E.g. GHG reductions, poverty reduction – goal vs strategy Comparisons: NS, Canada, Provinces, Int’l
; Bad news (e.g. GHGs, old forests); Improvements (e.g. income dist.) Consensus on goals, vision. Politics is about how to get there. E.g. GHG reductions, poverty reduction – goal vs strategy Comparisons: NS, Canada, Provinces, Int’l.")
41
Examples of results: The good, the bad, and the ugly…

49
Volunteerism: Atlantic Provinces lead (formal rate)
")
50
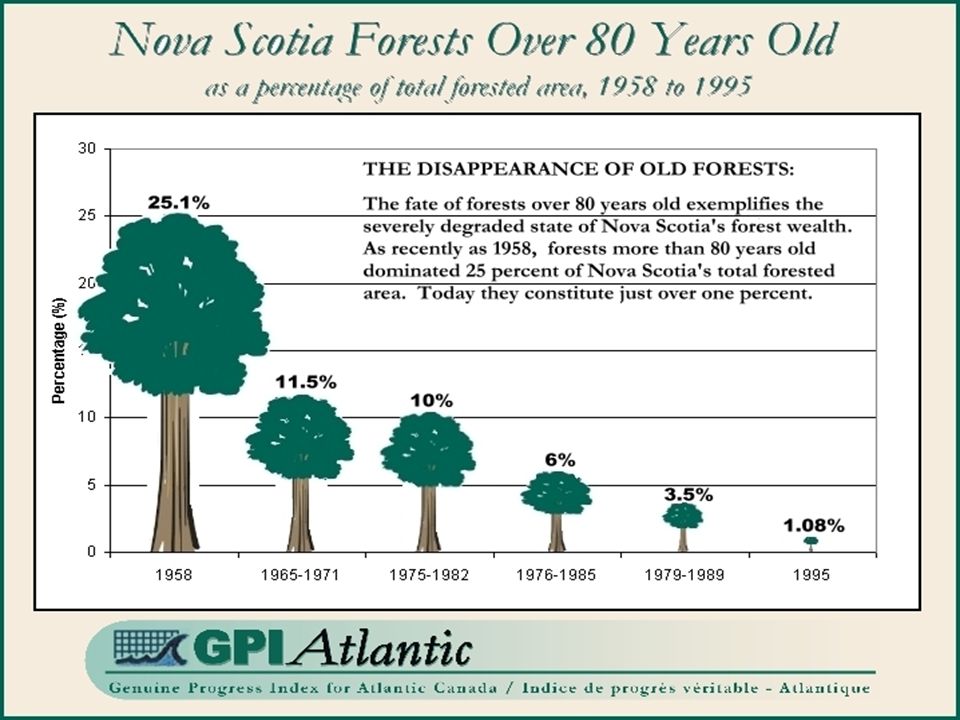
Examples of forest results

51
% Forest Area by Age Class, NS 1958-99

52
Volume 1, Figure 4

54
Volume 1, Figure 6

55
Volume 1, Figure 3

56
Changes in Atlantic Bird Species Populations

57
Recreational Brook Trout Caught and Retained in Nova Scotia 1975-1995

58
Excess clearcutting, loss of natural age & species diversity have resulted in loss of: valuable species wide diameter and clear lumber that fetch premium market prices resilience and resistance to insect infestation wildlife habitat, & bird population declines forest recreation values -> nature tourism

59
This represents substantial depreciation of a valuable natural capital asset. decline in forested watershed protection & 50% drop in shade-dependent brook trout soil degradation and leaching of nutrients that can affect future timber productivity substantial decline in carbon storage capacity & increase in biomass carbon loss decline in essential forest ecosystem services

60
The Good News: Volume 2: Best Forestry Practices in N. S. Selection harvesting increases forest value and provides more jobs Shift to value-added creates more jobs Restoration forestry is a good investment What incentives can encourage restoration NB: Parallels to wetland restoration efforts

61
Natural Resource Accounts are not enough! - Onus on producers Measuring the Demand Side of the Sustainability Equation e.g. Forests: 20% of world’s people consume 84% paper; 20% consume 1% The equity dimension of sustainability Reporting to Canadians on impacts of behaviour - e.g. GHGs

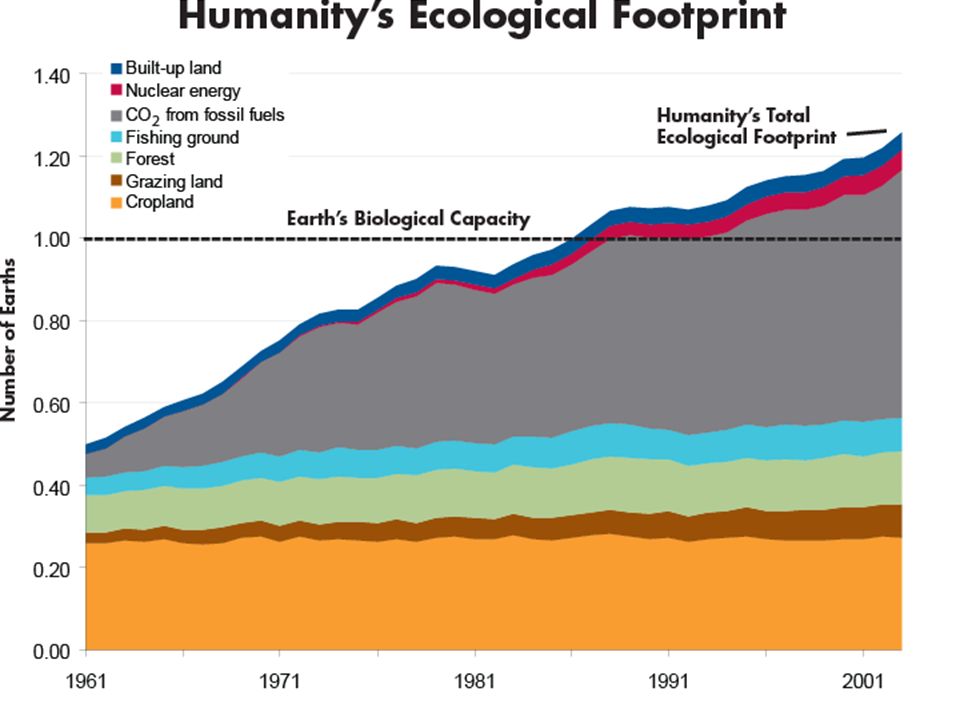
64
Ecological Footprint, 1961-2003

65
NS Footprint Projected to 2020 Figure 16, The Nova Scotia Ecological Footprint, GPI Atlantic 2001

66
Ecological Footprint Projections, Canada, 1995-2020

67
Nova Scotia’s Ecological Footprint NS Average Ecological Footprint is estimated at 8.1 hectares (compared to 1.8 ha available globally per person) If all the world’s people consumed at this level, we would need 4 planets Components: human impact on the environment……………………..
 If all the world’s people consumed at this level, we would need 4 planets Components: human impact on the environment……………………..")
71
COSO x NO x VOCs 19903551978176 19953401807985 20023141637252 20052761357749 Nova Scotia Criteria Air Contaminant Emissions (kg/capita) 1990-2005
")
79
Positive Approach: Can we do it? Percentage Waste Diversion in Nova Scotia

81
Challenges to Policy Adoption Long-term vs short-term (while time running out and window of opportunity narrows Science as ‘certainty’ vs precautionary principle Materialism / consumption addiction BUT growing awareness and concern…

82
Issues of Concern for Canadians – 2007 Source: TNS Canadian Facts, 2007

83
Top Priority Issues for Government Source: Centre for Research and Information on Canada (CRIC). Portraits of Canada Survey. 2005

84
Time is right – E.g. NS Gov’t commitments 2006-08: “Demonstrate international leadership by having one of the cleanest and most sustainable environments in the world by the year 2020” (Bill 146: Environmental Goals and Sustainable Prosperity Act “Becoming the “best place to live” means scoring well on quality of life indicators like those produced by Genuine Progress Index Atlantic” (Opportunities for Sustainable Prosperity. 2006) Power of Green Conference, 2007 (Ec. Dev’t)
 Power of Green Conference, 2007 (Ec. Dev’t).")
85
Maintain and update GPI Strongly recommend period of study, reflection, consultation Took nearly 12 years to get here, another year to investigate application appropriate – e.g. interdepartmental task force Understand methods and data sources, select appropriate indicators NS Govt will report GPI results (Community Counts)
.")
86
Considerations New database key to easy updating, comparison, replication Data sources – (a) official/available – mostly Statcan; (b) provincial – e.g. forest inventories, waste diversion -> development; (c) new surveys (e.g. education); (d) local data (Community GPI) Time, money, resources depend on indicator selection. But cf resources required for GDP: How often is that needed?
 new surveys (e.g. education); (d) local data (Community GPI) Time, money, resources depend on indicator selection. But cf resources required for GDP: How often is that needed .")
87
Data challenges A.National vs local / community B.Conceptual inadequacies (indicator choices) 1.E.g. education: We could not answer the question: How educated are Nova Scotians? 2.Conventional output indicators can’t do so 3.Development of new indicators, data sources, measurement methods is needed – multiple literacies 4.Comprehensive list of “ideal” indicators

88
Conclusion GPI key tool to achieve sustainability targets, because it measures progress in way that joins social, economic & environmental objectives, and accounts for true benefits and costs Measuring progress towards objectives is an essential mark of genuine commitment to those goals and objectives NZ has potential to become genuine model

89
GPI: Measuring what we value to leave a better NZ for our children

90
Genuine Progress Index for Atlantic Canada Indice de progrès véritable - Atlantique www.gpiatlantic.org

Similar presentations