Download presentation
Presentation is loading. Please wait.

1
Potential Effects of Climate Change on New York City Water Supply Quantity and Quality: An Integrated Modeling Approach Donald Pierson, Elliot Schneiderman and Mark Zion New York City Dept of Environmental Protection Hampus Markensten and Emmet Owens Upstate Freshwater Institute

2
1. Project Overview

3
NYC DEP Climate Change Integrated Modeling Project Purpose: To evaluate the potential effects of future climate change on New York City Water Supply –Water availability and reservoir operations. –Reservoir eutrophication –Reservoir turbidity Multi-year project carried out in two phases. Now in early phase I This presentation will present initial Phase I modeling results. We are describing our methods and early progress – not final results

4
Original System Modeling Schematic Historical Climate Watershed Model Reservoir Models OASIS Model Integrated Model System Indicators Historical Operations Historical River Flows

5
Early Phase I Model Connections GCM/Delta Change Predictions Watershed Model Reservoir Models OASIS Model Integrated Model System Indicators Adjusted Operations

6
Turbidity Simulations Schoharie Reservoir Eutrophication Simulations Cannonsville Reservoir Phase I Climate Change Simulations System Modeling of Reservoir Operations – All West of Hudson Reservoirs

7
2. Climate Change Projections

8
JFMAMJJASOND Control Period (1981-2000) 2.93.34.8 4.74.63.5 3.23.53.13.3 Future Period (2046-2065) 4.84.6 4.94.24.64.13.13.53.84.14.9 Delta Precip Factor = Future/Control 1.71.40.91.00.91.01.20.91.1 1.31.5 Average GCM-Projected Precipitation by Month for Control and Future Periods Daily Precipitation Input Data for Model Simulations JanFebMar cm/day 4 8 0 2000 -> Application of Climate Change Delta Method - Precipitation Baseline Future +65yr (Future = Baseline * Factor)
 Future Period ( ) Delta Precip Factor = Future/Control Average GCM-Projected Precipitation by Month for Control and Future Periods Daily Precipitation Input Data for Model Simulations JanFebMar cm/day > Application of Climate Change Delta Method - Precipitation Baseline Future +65yr (Future = Baseline * Factor)")
9
Daily Air Temperature Input Data for Model Simulations JanFebMar Degrees C 0 40 -40 2000 -> Baseline Future +65yr 20 -20 Application of Climate Change Delta Method – Air Temp Average GCM-Projected Air Temperature by Month for Control and Future Periods JFMAMJJASOND Control Period (1981-2000) -5.4-3.32.47.512.217.720.319.215.09.62.2-2.5 Future Period (2046-2065) -1.6-0.24.09.315.420.022.821.918.611.44.90.2 Delta Precip Factor = Future/Control 3.83.11.61.83.32.32.52.83.61.82.82.6 (Future = Baseline + Factor)
 Future Period ( ) Delta Precip Factor = Future/Control (Future = Baseline + Factor)")
10
Monthly Precipitation and Air Temperature Delta Change Factors 65 years forward (2046-2065) Expected monthly change in Precipitation Based on 8 GCM/Emission Scenarios. Upper and lower bars are max and min of these. Box is the range of the remaining 6 scenarios. Vertical bar is the median of all scenarios. (multiplicative factor) (degrees C additive factor) Expected monthly change in Air Temperature 100 years forward (2081-2100)
 (degrees C additive factor) Expected monthly change in Air Temperature 100 years forward ( ).")
11
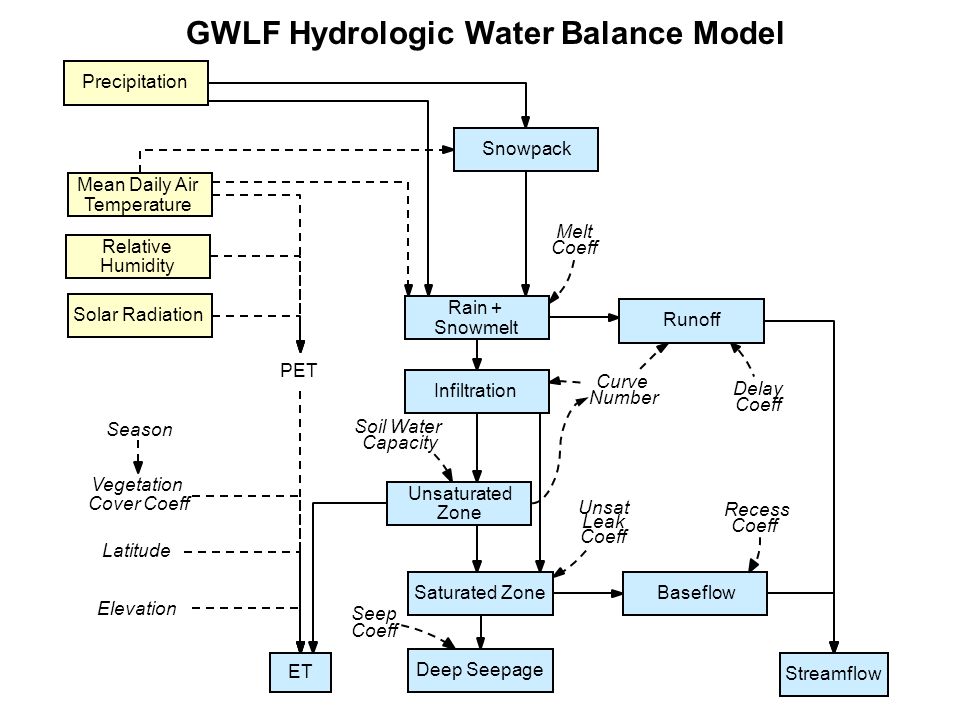
3. Watershed Effects

13
GWLF Watershed Model Results Sum of All WOH Watersheds 65 Yr Forward100 Yr Forward Temperature ( o C) Evapotranspiration (cm/day) Based on 8 GCM/Emission Scenarios. Upper and lower bars are max and min of these. Box is the range of the remaining 6 scenarios. Bar within box is the median. Line shows baseline run.

14
GWLF Watershed Model Results Sum of All WOH Watersheds 65 Yr Forward 100 Yr Forward Snow (cm/day) Snowpack (cm)
 Snowpack (cm)")
15
GWLF Watershed Model Results Sum of All WOH Watersheds 65 Yr Forward 100 Yr Forward Precipitation (cm/day) Streamflow (cm/day)
 Streamflow (cm/day)")
16
4. Water Supply System Effects

17
Effects of Climate Change on Reservoir Water Quantity using Delta Change, GWLF, and OASIS Models GWLF Watershed Models OASIS Model Historical Precip, AirTemp 1966-2004 Climate Scenario Precip, AirTemp Stream Flow Reservoir Water Quantity Simulate reservoir water balance. Calculate reservoir operations based on current operating rules. Delta Change

18
OASIS Model Results Sum of All WOH Reservoirs 65 Yr Forward100 Yr Forward Reservoir Inflow (MGD) Storage (BG)
 Storage (BG)")
19
OASIS Model Results Sum of All WOH Reservoirs 65 Yr Forward100 Yr Forward Release and Spill (MGD)
")
20
5. Turbidity Projections for Schoharie Reservoir

21
Effects of Climate Change on Turbidity in Schoharie Tunnel using Delta Change, GWLF, and W2 Models GWLF Watershed Model Pre- Processor W2 Reservoir Model Historical Precip, AirTemp Climate Scenario Precip, AirTemp Historical Tunnel Operation Data Stream Flow Net Flow In Net turbidity In Adj Tunnel Ops Data Reservoir Water Quantity, Quality Simulate reservoir water balance, and adjust tunnel data if withdrawal exceeds available storage. Calculate turbidity inputs using sediment rating curve Calculate net flow inputs Reformat data for W2 model Simulates water, temperature, and constituents in 2 dimensions (vertical, longitudinal) Delta Change
 Delta Change.")
22
Schoharie Reservoir Water Quantity Projections 65 yr forward Reservoir Storage (MG) Reservoir Spill (MG) 100 yr forward
 Reservoir Spill (MG) 100 yr forward")
23
Schoharie Reservoir Turbidity Projections 65 yr forward Input Turbidity Load (ntu-mgd) Turbidity in Schoharie Tunnel (ntu) 100 yr forward
 Turbidity in Schoharie Tunnel (ntu) 100 yr forward")
24
6. Eutrophication Projections for Cannonsville Reservoir

25
Effects of Climate Change on Trophic Status of Cannonsville Reservoir using Delta Change, GWLF, and PROTECH Models GWLF Watershed Model Pre- Processor PROTECH Reservoir Model Historical Precip, Air Temp Climate Scenario Precip, Air Temp Historical Operation Data Adj Ops Data Reservoir Water Quantity, Quality Stream Flow Net Flow In Nutrient Loads Simulate reservoir water balance, and adjust tunnel data if withdrawal exceeds available storage. Adjust Inflow water temperature Adjust Air temp and dew point temp inputs to reservoir model Calculate net flow inputs Reformat data for PROTECH model Simulates water, temperature, nutrients and phytoplankton functional groups in 1 dimension (vertical) Delta Change Adjusted Met Data Adj Stream Temp Nutrient Loads
 Delta Change Adjusted Met Data Adj Stream Temp Nutrient Loads.")
26
Dissolved Phosphorus (Kg/d) Water Surface Elevation (meters above sea level) Particulate Phosphorus (Kg/d) 65 years forward 100 years forward
 Water Surface Elevation (meters above sea level) Particulate Phosphorus (Kg/d) 65 years forward 100 years forward")
27
Mean Reservoir Water Temperature (C) Baseline Delta Change based on ECAM A2 100 years forward Water Temperature (C) 1994 1995 1996 1997 65 years forward 100 years forward
 Baseline Delta Change based on ECAM A2 100 years forward Water Temperature (C) years forward 100 years forward")
28
Mean Reservoir Chlorophyll a (mg m -3 ) Baseline Delta Change based on ECAM A2 2081-2300 Chlorophyll a (mg m -3 ) 1994 1995 1996 1997 65 years forward 100 years forward
 Baseline Delta Change based on ECAM A Chlorophyll a (mg m -3 ) years forward 100 years forward")
29
Why are these results preliminary? 1.Climate Change projections using delta change method don’t account for possible changes in storm frequency, intensity, and spatial variability. 2.Adaptation by adjustment of Reservoir Operations not accounted for. 3.Feedback between water quality and Reservoir Operations not accounted for 4.Effects of climate change on Ecosystem Processes not accounted for (Forest Health, Biogeochemical Cycles, Ecosystem Adaptation). 5.Effects of climate change on Channel Processes Affecting Turbidity not accounted for. 6.Model testing and sensitivity analysis needed to understand model predictions at extreme present climate and future climate conditions.
. 5.Effects of climate change on Channel Processes Affecting Turbidity not accounted for. 6.Model testing and sensitivity analysis needed to understand model predictions at extreme present climate and future climate conditions..")
30
Summary DEP’s Models were used with simple climate scenarios (delta change) to obtain preliminary indication of the effects of climate change on water supply quantity and quality Initial results suggest –Reduced snowpack and spring melt –Greater fall and winter flows –Turbidity and nutrient loads follow flow pattern –Enhanced fall phytoplankton bloom Preliminary nature of these results are being addressed as the project progress.
 to obtain preliminary indication of the effects of climate change on water supply quantity and quality Initial results suggest –Reduced snowpack and spring melt –Greater fall and winter flows –Turbidity and nutrient loads follow flow pattern –Enhanced fall phytoplankton bloom Preliminary nature of these results are being addressed as the project progress.")
31
EXTRA

32
-100 -75 -25 0 +25 +50 +75 +100 -50 GWLF Watershed Model Results Sum of All WOH Watersheds Annual Percent Change in Water Balance Components 65 Yr Forward100 Yr Forward -100 -75 -25 0 +25 +50 +75 +100 -50

Similar presentations


 Need to relate “today’s”>")


 Description of Yakima River Basin and Yakima Storage Project MMS and Yakima River Basin models Global Climate-Change.>")


