Download presentation
Presentation is loading. Please wait.

16
10.2 Tests of Significance Use confidence intervals when the goal is to estimate the population parameter If the goal is to assess evidence provided by data about some claim concerning a population, then a test of significance is what you need to perform.

17
Basic idea of a test of significance… An outcome that would rarely happen if a claim where true is good evidence that the claim is not true. We ask: what would happen if we repeated the sample or experiment many times? Could we get the sample result (outcome) just by chance? Or is this result so rare (surprising)?
 just by chance. Or is this result so rare (surprising) .")
18
The reasoning of tests of significance… We always draw conclusions about some parameter of the population, therefore our first step is should be to identify the parameter and the population of interest Next we ask: what is the claim and counter claim about this parameter? These are your hypotheses: null hypothesis (H 0 ) and alternative hypothesis (H a ) Either one could be a claim.
 and alternative hypothesis (H a ) Either one could be a claim..")
19
The reasoning of tests of significance… We suppose that the null hypothesis is true We calculate a point estimate from the sample data We ask: is the point estimate significantly (surprisingly) different from the hypothesized parameter value? If so (surprisingly different), that is good evidence against H 0, in favor of H a.
, that is good evidence against H 0, in favor of H a..")
20
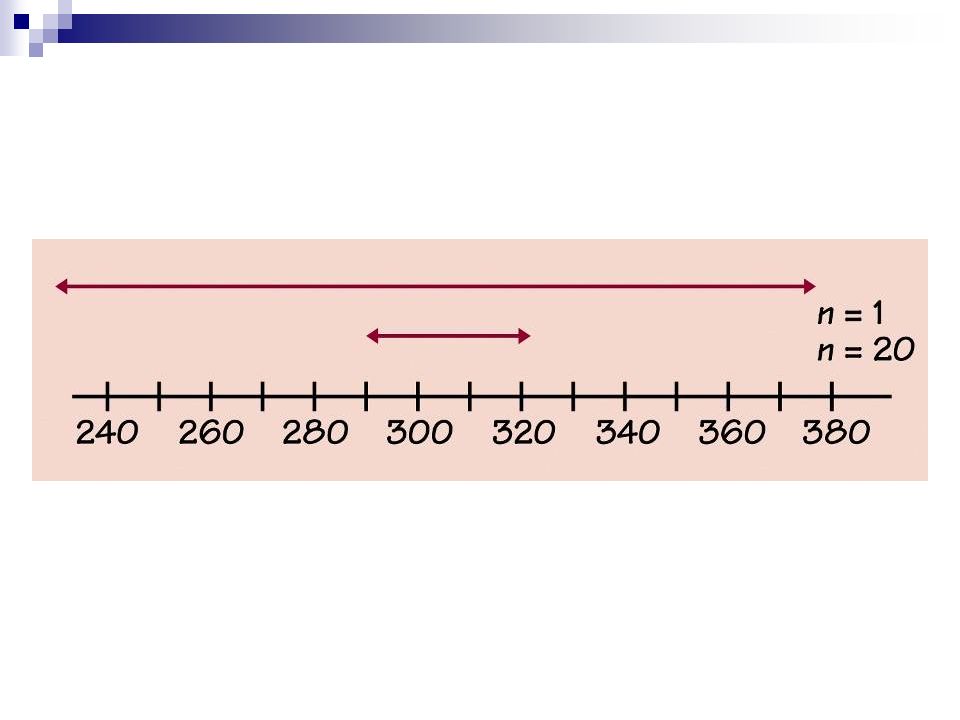
Is the point estimate significantly (surprisingly) different from the hypothesized parameter value? To answer this question, we use our knowledge of sampling distributions How will vary in repeated samples if H 0 were really true? This distribution of is normal,

21
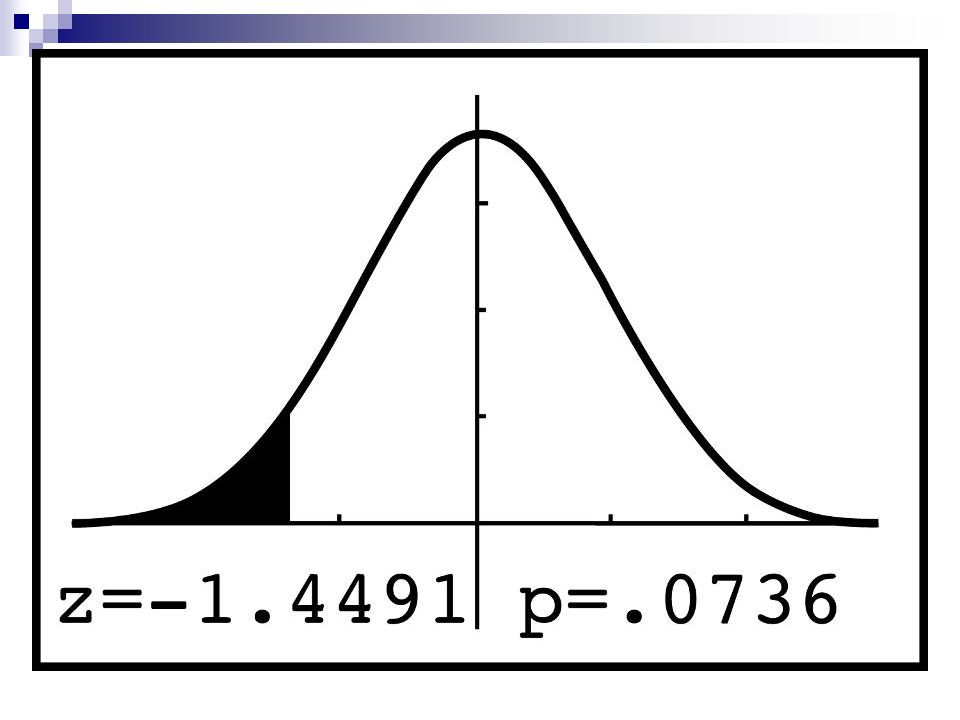
We can judge whether any observed statistic ( ?) is surprising by locating it on the distribution What is the p-value for this observation?
 is surprising by locating it on the distribution What is the p-value for this observation")
22
A significance test asks… How unlikely would the observed outcome be if the null hypothesis were really true? Since we like to quantify things, let us see if we can assign a number to this “unlikeliness” business… We understand that… The less likely the outcome (more surprising) is, the stronger the evidence against H 0. The further the observed value (statistic) is from the hypothesized parametric value, the more convinced we are that the population parameter is different from the assumed value.
 is, the stronger the evidence against H 0. The further the observed value (statistic) is from the hypothesized parametric value, the more convinced we are that the population parameter is different from the assumed value..")
23
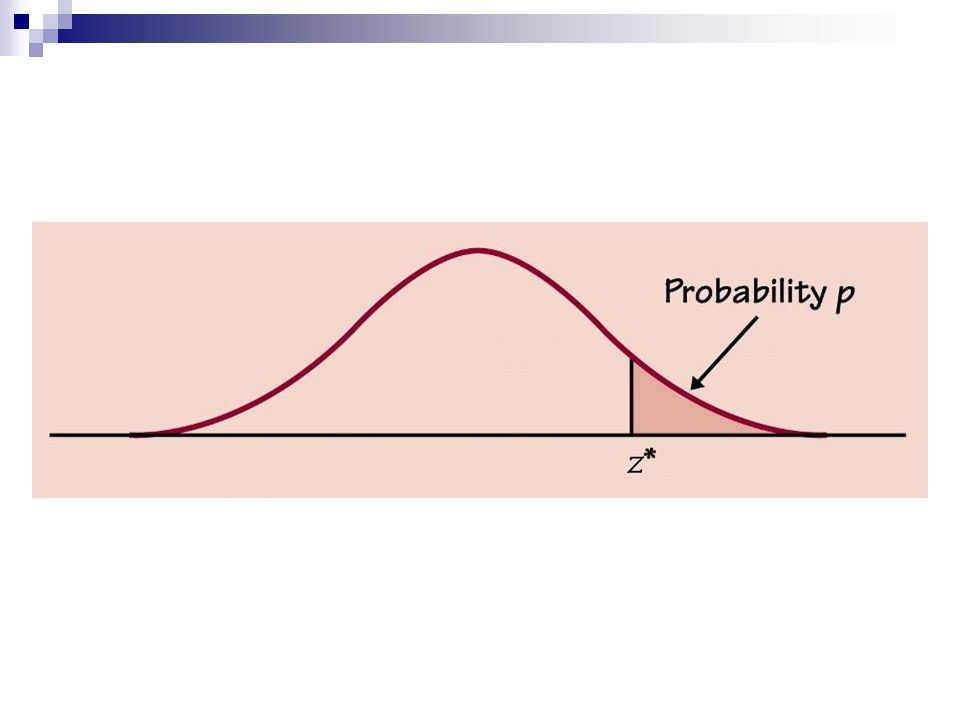
P-value We measure the strength of the evidence against the H 0 by the probability under the normal curve to the right, left or both sides according to whether the alternative hypothesis is: H a :µ > µ 0, (right tail test) H a :µ < µ 0, (left tail test) H a :µ µ 0, (two tail test)
 H a :µ < µ 0, (left tail test) H a :µ µ 0, (two tail test)")
25
If, is this observation surprising? How about if Small p-values are strong evidence against H 0 because they say the result is surprising (unlikely to occur just by chance alone)
.")
26
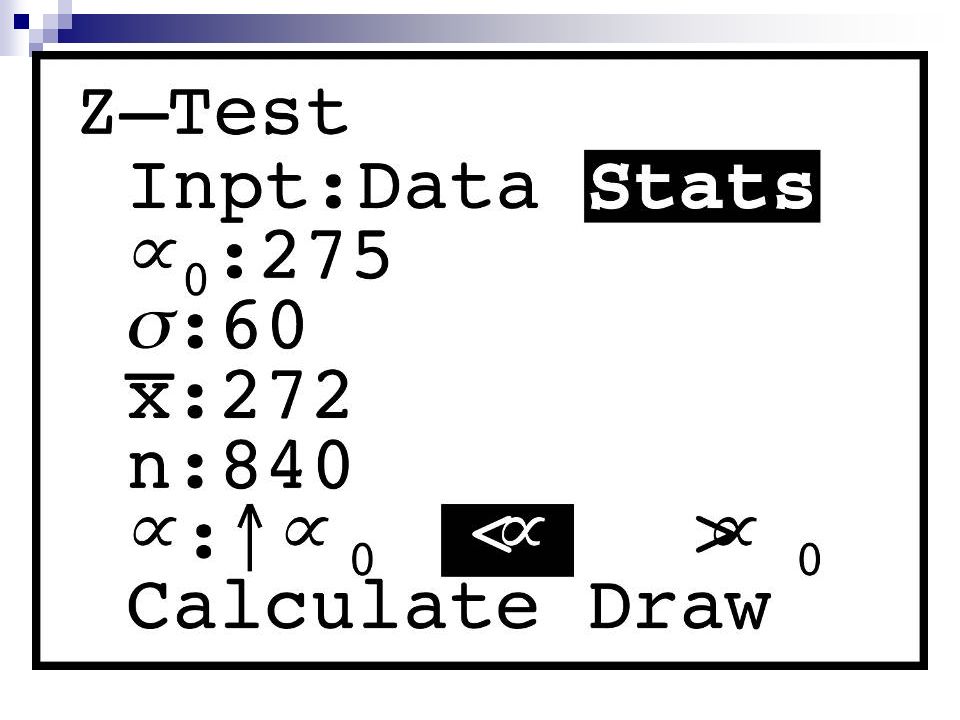
Outline of a test…(1) State the population and parameter of interest Describe the effect you are searching for in terms of a population parameter (hypotheses) Name the test you are going to use e.g. one sample z-test (if σ is known) or one sample t-test (if σ is unknown)
 or one sample t-test (if σ is unknown).")
27
Outline of a test…(2) and verify the assumptions/conditions SRS: may be stated OR if not known state you will assume … “otherwise generalizations to the population may be invalid”
 and verify the assumptions/conditions SRS: may be stated OR if not known state you will assume … otherwise generalizations to the population may be invalid")
28
Outline of a test…(2) cont. Normality: stated in the problem Sample large enough so that CLT assures normal sampling distribution (n>30) Check the data by graphing (no obvious outliers): Stem and leaf (bell shaped, symmetric, single peaked) Histogram (bell shaped, symmetric, single peaked) Normal probability plot if you can not verify by any of the methods above, state that you will assume … “otherwise generalizations to the population may be invalid”
 Check the data by graphing (no obvious outliers): Stem and leaf (bell shaped, symmetric, single peaked) Histogram (bell shaped, symmetric, single peaked) Normal probability plot if you can not verify by any of the methods above, state that you will assume … otherwise generalizations to the population may be invalid .")
29
Outline of a test…(3) State the data values (sample mean (x-bar), sample size (n), standard deviation (σ) hypothesized parameter (µ 0 ) and significance level α, (if given): calculate the test statistic: Calculate the p-value Normalcdf(lb,ub)
 State the data values (sample mean (x-bar), sample size (n), standard deviation (σ) hypothesized parameter (µ 0 ) and significance level α, (if given): calculate the test statistic: Calculate the p-value Normalcdf(lb,ub)")
30
Outline of a test…(3) cont. Is H 0 believable? Decide/comment on the merits of the null hypothesis: If α is known: Reject H 0 if p ≤ α, otherwise: Fail to reject H 0 If no α is given, comment on the strength of the evidence (the p-value) and make recommendations to reject or fail to reject H 0
 and make recommendations to reject or fail to reject H 0.")
31
Outline of a test…(4) Draw conclusion on the H a hypothesis: If α is known: There is/(is not) sufficient evidence at the _____ (α) level of significance to show that the mean _______ (context) is _______ (whatever H a says in context)
 Draw conclusion on the H a hypothesis: If α is known: There is/(is not) sufficient evidence at the _____ (α) level of significance to show that the mean _______ (context) is _______ (whatever H a says in context)")
32
Outline of a test…(4) cont. If α is not given: Given such a small/(large) p-value, there is/(is not) reasonable evidence to suggest that the mean ______ (whatever H a says in context)
 p-value, there is/(is not) reasonable evidence to suggest that the mean ______ (whatever H a says in context).")
33
Statistical significance… If the p-value is as small or smaller than alpha, that is we say that the data is statistically significant at the level α. “Significant” in the statistical sense does not mean “important”, it means “not likely to happen by chance alone”

34
Test statistic… The p-value is determined from the test statistic. Every test of significance has a test statistic. The one-sample z-test has the test statistic:

35
Instead of calculating p value… When given a (fixed) significance level: You may compare the test statistic to the critical value (determined from the tables or calculator) and: Reject H 0 at significance level α against a one sided alternative where z* is the upper α critical value from Table C. Reject H 0 at significance level α against a two sided alternative where z* is the upper α/2 critical value from Table C. See example 10.16 page 578-9

36
Example of a two tail test

37
Z-test for population mean (one sided, right tail) back
 back")
38
Z-test for population mean (one sided, left tail) back
 back")
39
Z-test for population mean (two sided, two tail) back
 back")
40
Example 10.13 page 573, shows a two sided (two tail test) P = 2*Normalcdf(1.09, 99)
 P = 2*Normalcdf(1.09, 99)")
41
Example 10.14 on page 575

43
Here, z = 3.26 > z*=2.576, hence we reject H 0

44
Tests from a Confidence interval A level α two sided significance test rejects the null hypothesis exactly when the value µ 0 falls outside a level 1- α confidence interval for µ. See example 10.17 in the textbook page 581.

45
Example 10.17 page 581

50
Making sense of statistical significance…(10.3) Statistical significance is valued because it points to an effect that is unlikely to occur simply by chance P-value gives the degree of evidence against the null hypothesis Choosing an α level in advance makes sense if you must make a decision but not if you only to describe the strength of your evidence against the null hypothesis.
 Statistical significance is valued because it points to an effect that is unlikely to occur simply by chance P-value gives the degree of evidence against the null hypothesis Choosing an α level in advance makes sense if you must make a decision but not if you only to describe the strength of your evidence against the null hypothesis.")
51
Making sense of statistical significance… How much evidence is required to reject H 0 ? Depends on how plausible the null hypothesis is. Stronger evidence required for long held beliefs… (the sun rises from the west and sets in the east?) Depends on what the consequences of rejecting H 0 are. Will it cost a lot if we are wrong? Then better have strong evidence… It is generally better to report the p-value so that each person can individually decide if the evidence is strong enough.
 Depends on what the consequences of rejecting H 0 are. Will it cost a lot if we are wrong. Then better have strong evidence… It is generally better to report the p-value so that each person can individually decide if the evidence is strong enough..")
52
Statistical significance and practical significance These two are not the same Pay attention to actual data as well as the p-value Plot your data to examine carefully. Are there any outliers See example 10.18 page 588 See exercise 58 on page 589

53
Inference as Decision…(10.4) When we make decisions based on the evidence gathered against H 0 (for H a ) we may commit an error. There are two types of errors possible on significance tests Type I error (rejecting a true H 0 ) Type II error (failing to reject H 0 when it is false In acceptance sampling, batches of items are accepted or rejected on the basis of the evidence gathered against H 0
 Type II error (failing to reject H 0 when it is false In acceptance sampling, batches of items are accepted or rejected on the basis of the evidence gathered against H 0.")
54
Type I and Type II errors

55
Decision matrix Only one type of error is possible at one time.

56
Error Probabilities… Significance tests with fixed α give a rule for making decisions, either rejecting H 0 or failing to reject it. Decision making is imperative in acceptance sampling Consequently, we may make errors in the decisions we make. Look at example 10.21 page 595

57
The light shade represents the probability of making a type 1 error and the darker shade represents the probability of type II error.

58
Significance and type I error The significance level α of any fixed level test is the probability of type I error. This mean that α is the probability that the test will reject the null hypothesis when it is in fact true.

59
Calculating Type II probability Step1. Write the rule for accepting H 0 in terms of x-bar step 2. Find the probability of accepting H 0 assuming that the alternative is true. Look at the example 10.22 page 597 This probability is usually assigned the value, β. Thus P(Type II error) = β. β tells us that the significance test will lead us to fail to reject the H 0 with a probability equal to β.
 = β. β tells us that the significance test will lead us to fail to reject the H 0 with a probability equal to β..")
60
Probability of Type II error from example 10.22 page 597

61
Power of a test against the alternative Power of a test against the alternative H 0 Is the probability that a fixed significance level will reject H 0 when a particular value of the parameter is true. This probability is obtained by subtracting the probability of type II error from 1 Thus: Power = 1 – β Whereas the p-value describes what would happen, supposing the H 0 is true, the power describes what would happen supposing the alternative is true.

62
Increasing the power of a significance test… Increasing A 5% test of significance will have a greater chance of rejecting an alternative than a 1% test because the strength of evidence required for rejection is less. Choosing a particular alternative value that is further away from the hypothesized value Values of µ that are in H a but lie close to the hypothesized value µ 0 are harder to detect (low power) than values that are far from µ 0. Increasing the sample size More data will provide more information about x-bar so we have a better chance of distinguishing values of µ. Decreasing σ, This has the same effect as increasing the sample size: more information about µ Improving measurement and restricting attention to a subpopulation are two common ways to reduce σ.
 than values that are far from µ 0. Increasing the sample size More data will provide more information about x-bar so we have a better chance of distinguishing values of µ. Decreasing σ, This has the same effect as increasing the sample size: more information about µ Improving measurement and restricting attention to a subpopulation are two common ways to reduce σ..")
63
Notice the effect of the shift from a false hypothesized mean (µ=0) to a true alternative mean (µ=1)
 to a true alternative mean (µ=1)")
Similar presentations


>")


 Identify the population of interest (What is the topic of discussion?) and parameter (mean, standard deviation, probability) you.>")


