Download presentation
Presentation is loading. Please wait.

1
1 SDSS Supernova Survey Josh Frieman Supernova Rates 2008, Florence May 19, 2008

2
Dark Energy and Dark Matter

3
3

4
4 SDSS II Supernova Survey Goals Obtain few hundred high-quality SNe Ia light curves in the `redshift desert’ z~0.05-0.35 for continuous Hubble diagram Detailed spectroscopic follow-up, including some with multiple epochs, to study evolution and diversity of SN features Probe Dark Energy in z regime complementary to other surveys Well-observed sample to anchor Hubble diagram & train light-curve fitters Rolling search: determine SN/SF rates/properties vs. z, environment Rest-frame u-band templates for z >1 surveys Large survey volume: rare & peculiar SNe, probe outliers of population Enable time-domain science both in real time* & after the fact** *candidates immediately on the web+IAU circulars+VOEventNet **SN images & object catalogs all available publicly w/in ~2 months

5
Spectroscopic follow-up telescopes R. Miquel, M. Molla

6
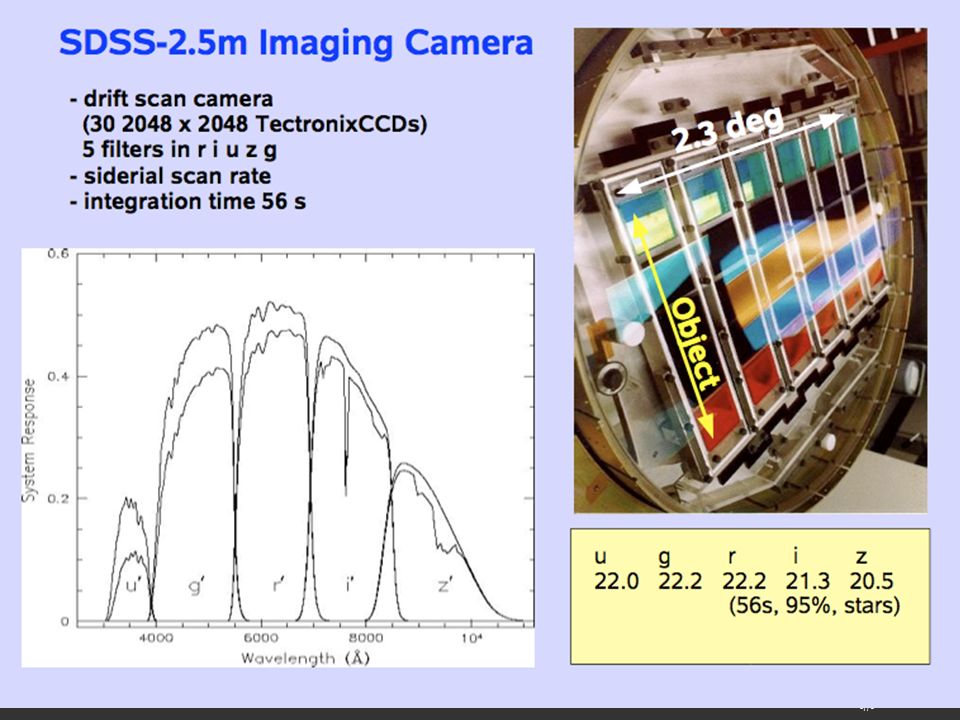
6 SDSS 2.5 meter telescope SDSS-I: 2000-5 Apache Point Observatory SDSS-II: 2005-8 New Mexico

8
Stripe 82

9
Frieman, et al (2008); Sako, et al (2008)
; Sako, et al (2008)")
10
Search Template Difference grigri Searching For Supernovae 2005 –190,020 objects scanned –11,385 unique candidates –130 confirmed Ia 2006 –14,441 objects scanned –3,694 unique candidates –193 confirmed Ia 2007 –171 confirmed Ia

11
Spectroscopic Target Selection 2 Epochs SN Ia Fit SN Ibc Fit SN II Fit 31 Epochs SN Ia Fit SN Ibc Fit SN II Fit Fit with template library Classification >90% accurate after 2-3 epochs Redshifts 5-10% accurate Sako etal 2008

12
12 SN 2005 gb z = 0.086, confirmed at ARC 3.5m Preliminary gri light curve and fit from low-z templates BeforeAfter Composite gri images

13
SN and Host Spectroscopy MDM 2.4m NOT 2.6m APO 3.5m NTT 3.6m KPNO 4m WHT 4.2m Subaru 8.2m HET 9.2m Keck 10m Magellan 6m TNG SALT 10m 2005+2006

14
14

15
Spectroscopic Follow-up 1325 spectra taken over 3 seasons Multi-epoch spectroscopy of selected low-redshift SNe

16
Spectroscopic Deconstruction SN model Host galaxy model Combined model Zheng, et al (2008)
")
17
Rolling survey leads to well-sampled*, well-constrained light curves peaked after Sept. 7 peaked before Sept. 7 r=22.5 *9 epochs of imaging per SN (median)
.")
18
SDSS low-redshift light curves from 2005 well-sampled, multi-band (u,z not shown) Will use to train LC fitters & anchor Hubble Diagram 2005-07: 83 confirmed SNe Ia at z<0.12 grigri Dilday et al (2007) submitted
 Will use to train LC fitters & anchor Hubble Diagram : 83 confirmed SNe Ia at z<0.12 grigri Dilday et al (2007) submitted")
19
SDSS SN Photometry: Holtzman et al. (2007) submitted ``Scene modeling”
 submitted ``Scene modeling")
20
B. Dilday

21
Redshift Distribution for SNe Ia and counting

22
Peculiar SNe from SDSS 2005gj: SN Ia in dense circumstellar environment or SN IIn; more luminous than any normal Ia; Prieto et al (2007) 2005hk: underluminous; pure deflagration? Phillips et al (2007) Collaborations with Carnegie Supernova Project
 Collaborations with Carnegie Supernova Project.")
23
23 Light Curve Fitting with MLCS2k2 and SALT-II

24
Model Survey Efficiency

25
Monte Carlo Simulations match data distributions Use actual observing conditions (sky, zero-points, PSF, etc)
")
26
Extract R V distribution from SDSS SN data D. Cinabro

27
Extract A V Distribution from SDSS (no prior)
")
28
Future: Improved SN Ia Distances Train Fitters Fit Cosmology

29
29 The Dark Energy Survey Study Dark Energy using 4 complementary* techniques: I. Cluster Counts II. Weak Lensing III. Baryon Acoustic Oscillations IV. Supernovae Two multiband surveys: 5000 deg 2 g, r, i, z, Y to 24th mag Smaller area repeat for SNe Build new 3 deg 2 camera and Data management sytem Survey late 2011-2016 (525 nights) Response to NOAO AO Blanco 4-meter at CTIO *in systematics & in cosmological parameter degeneracies *geometric+structure growth: test Dark Energy vs. Gravity
 Response to NOAO AO Blanco 4-meter at CTIO *in systematics & in cosmological parameter degeneracies *geometric+structure growth: test Dark Energy vs. Gravity.")
30
30 The DES Collaboration Fermilab University of Illinois at Urbana-Champaign University of Chicago Lawrence Berkeley National Lab NOAO/CTIO DES Spain Consortium DES United Kingdom Consortium University of Michigan Ohio State University University of Pennsylvania DES Brazil Consortium Argonne National Laboratory

31
The DES Instrument: DECam 3556 mm 1575 mm Hexapod Optical Lenses F8 Mirror CCD Read out Filters Shutter

32
32 DES CCDs 62 2kx4k fully depleted CCDs: 520 Megapixels Excellent red sensitivity Developed by LBNL

33
33 DES Supernovae Baseline survey: ~1000 hours over 5 years (5 months per yr), roughly evenly split between photometric and non-photometric; ~5 visits per lunation in griz(Y); 2 deep fields, 3 shallow fields (3 sq deg per field); some possible NIR follow-up on VISTA ~3500 well-measured SN Ia lightcurves to z~1 Larger sample, improved z-band response (fully depleted CCDs) compared to ESSENCE, SNLS: reduce dependence on rest-frame u-band and Malmquist bias Spectroscopic follow-up of SN Ia subsample+`complete’ host galaxies (LBT, Magellan, Gemini, Keck, VLT,…) e.g., focus on ellipticals (low dust extinction)? What strategy would be optimal for rate measurements? What questions will you want to ask?

34
34 Forecast Redshift Distribution

Similar presentations
 U. Chicago: B. Dilday, R.>")


 Five-band (grizY) + VISTA (JHK) photometry to.>")