Download presentation
Presentation is loading. Please wait.

1
Ecological Integrity as a Model for Understanding and Managing Parks and Protected Areas Stephen Woodley, PhD Chief Scientist Parks Canada

2
Purposes of Protected Areas Objectives Natural conditions Resource Values Single species Wilderness Nature Ecological Integrity

3
Ecosystem Integrity as a Philosophy Utilitarian Nature serves us Most resource management Harvest water quality ducks/hectare tourists/park Ecological We are part of nature Land ethic Ecosystem integrity Sustainability biodiversity indicator suites stress analysis Romantic Humans absent from nature Pristine Natural Wilderness unroaded >20 hectares no facilities Assumptions Expectations Measures

4
Changes in Ecosystem Understanding World View 2 Non-equilibrium, open Dynamic Self-organize Complex Emergent Properties World View 1 Orderly Balance of nature Stability Evolve slowly

5
Ecosystem Structure and Energy Flow energy gradient high quality energylow quality energy Organized - sun Unorganized - heat Complex Structure or Ecosystem Type of ecosystem is affected by: - latitude, because suns energy is stronger - water and nutrient availability - colonization history

6
Species Richness by Latitude for Mammalian Quadrupeds Average # species Latitude o 100 80 60 40 20 0 10203040506070

7
Ecological integrity A state of ecosystem development that is characteristic for its geographic location Full range of native species and supporting processes Likely to persist - viable for protected areas, we have often called this natural, or untouched.

8
Measuring Ecological Integrity - there are several ways 1. Whole systems measurement - thermodynamics 2. Flows and rates - 3. Suite of indicators structure and function multi-scale most sensitive

9
400 300 200 100 0 -100102030 Worldwide Ecosystem Distribution by Average Annual Temperature and Rainfall Average annual precipitation (cm) Average annual temperature ( o C) Tropical rainforest Tropical rainforest Temperate rainforest Tropical rainforest Taiga Tundra Desert Shrubland (Grassland) Woodland
 Average annual temperature ( o C) Tropical rainforest Tropical rainforest Temperate rainforest Tropical rainforest Taiga Tundra Desert Shrubland (Grassland) Woodland")
10
Whole system measures - thermodynamic efficiency

11
Ecosystem structure - keeping the parts is the first priority is a precautionary approach to ecosystem management – focus on species

13
Landscape level structure - must be maintained to ensure species and community survival

14
Ecosystem Function - keeping the processes Biodiversity exists because of, not in spite of, ecosystem disturbances. Maintaining process is critical.

15
Organisms use patches on the landscape. The patches need to remain connected.

16
Hypothesis - Cascade Corridor Restoration Before 1997 1997- Present

17
Wolf Pack Tracking Sequences

18
Active Management - Can we/should we? Prescribed fire Population control Exotics

19
The Parks Canada Ecological Integrity Monitoring Program

20
Properties of Scale population community landscape Time S p a c e organism cell structure and function

21
Ecosystem Possible Cause and Effect Relationships Case 1: Known Stress Known Effect Case 2: Known Stress Unknown Effect Case 3: Unknown Stress Known Effect Case 4: Unknown Stress Unknown Effect Monitoring Approach Threat- Specific Monitoring– Key Management Issues Core Indicators - Prediction of response - Research component - Hierarchical approach - Structure and function - Most likely to react to a range of stressors A two pronged approach to assessing ecological integrity Overall Monitoring Program

22
Ecological Integrity Monitoring Framework A Balance Sheet for Assessing Ecological Integrity Biodiversity Ecosystem Functions Stressors Species richness - change in species richness - numbers and extent of exotics Population Dynamics - mortality/natility rates of indicator species - immigration/emigration of indicator species* - population viability of indicator species Trophic structure - size class distribution of all taxa - predation levels Succession/retrogression - disturbance frequencies and size - vegetation age class distributions Productivity Decomposition Nutrient retention - Ca, Nitrogen Human land-use patterns - land use maps, roads densities, population densities. Habitat fragmentation - patch size, inter-patch distance, forest interior Pollutants - sewage, petrochemicals etc. - long-range transport of toxics Climate - weather data - frequency of extreme events Other - park specific issues

23
Measure or Indicator Changes in Species Richness

24
Interpreting the Indicators

25
0 0.1 0.2 0.3 0.4 0.5 1g 10g 100g 1kg 10kg 100kg Extirpated Existing Body Size Class Proportion of all Vertebrates The proportion of all existing and extirpated invertebrates found in National Parks, grouped by body size class

26
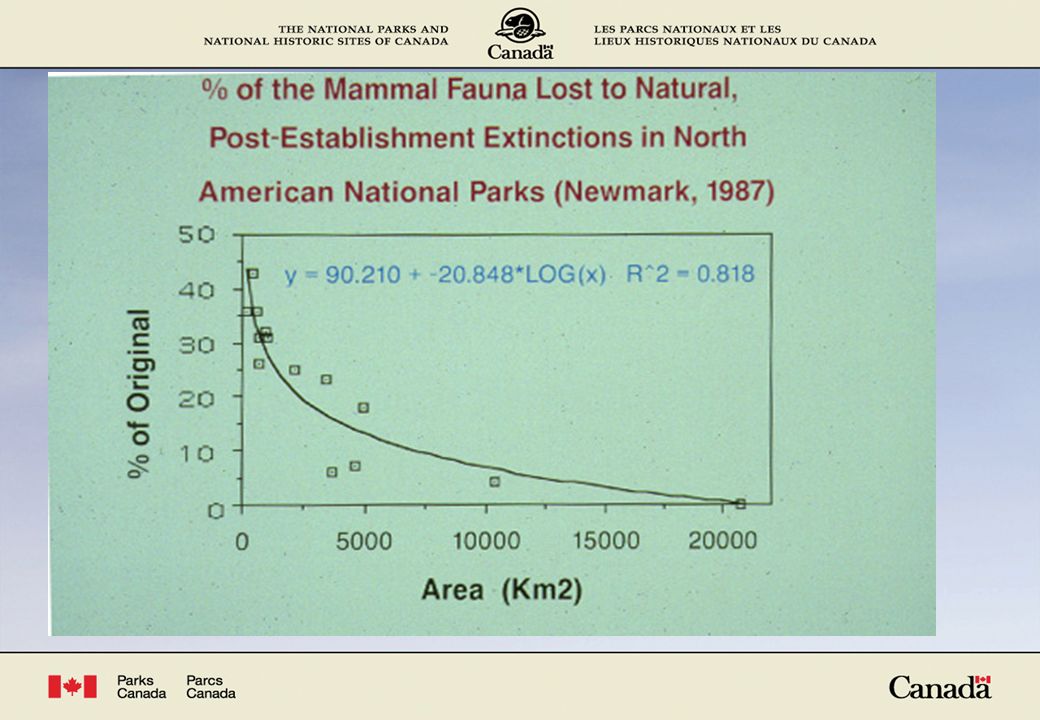
Assessing Human Impacts Statistical correlations R2 Values Source: 1997 Parks Canada State of Park Report http://parkscanada.pch.gc.ca/library/indexe.htm

28
Suite of Ecological Indicators - Example State of the Greater Fundy Ecosystem http://www.unb.ca/web/forestry/centers/cwru/soe/title.htm Succession/Retrogression - younger forests, little old growth Loss of native species - 14 species of vertebrates, one invertebrate and 20 plants Invasion of exotic species - 17.5% of the total known species Loss in average body size - loss of large bodied mammals (-13%) Reproduction in key indicator species - generally OK Ability to retain nutrients - significant loss of N and Ca Landscape fragmentation - extreme Viability of populations - little chance for Pine marten or flying squirrel
 Reproduction in key indicator species - generally OK Ability to retain nutrients - significant loss of N and Ca Landscape fragmentation - extreme Viability of populations - little chance for Pine marten or flying squirrel")
29
Reporting on a Suite of Indicators Parameter 1 Parameter 2 Parameter 3 Parameter 4

30
Sound Science Effective Communication Communicating EI Science

31
Using the Results of EI Assessment high low North Yukon Fundy Pt. Pelee Increasing need for active management high low Ecological integrity Intensity of Stresses Management Plan State of Parks

32
What scale is correct for management? Management by zone What about before the park was a park Pre-Colombian America

33
Forest Changes Stand Dynamics Gap Dynamics Tree replacement Tree Growth Whole tree physiology Leaf Physiology Spatial Scale 1000 KM Time scale Ecosystems are inherently multi-scaled.

34
Larger parks Hemispheric planning. Inter-regional planning Regional planning I.e. greater ecosystems Parks Spatial Scale 10000 KM Time scale Institutional Responses to Ecological Issues must also be multi-scaled.

35
Ecological Integrity New way of thinking about parks that is more rooted in conservation science Avoids the traps of “wilderness”, “role of people”, and “natural” Allows measurement and accountability Key Points: -Understand how the ecosystem works -Maintain good vital signs -Manage at the all scales -Monitor condition and react

Similar presentations