Download presentation
Presentation is loading. Please wait.

1
The Evolution of Survey Process Quality

2
Concepts Survey Design Quality Quality dimensions Product quality
Process quality Organizational quality

3
Quality assurance Quality control Error sources Mean squared error

5
The Concept of a Survey concerns a set of objects comprising a
population population under study has one or more measurable properties goal is to describe the population by one or more parameters defined in terms of the measurable properties

6
The Concept of a Survey (con’d)
access to the population requires a frame sample is selected in accordance with a sampling design specifying a probability mechanism and a sample size

7
The Concept of a Survey (cont’d)
observations are made in accordance with a measurement process based on the measurements an estimation process is applied to compute estimates purpose is to make inference to the population (facts, decision-making)
")
8
Typical Shortcomings target population is changed during the study
selection probabilities are not known for all selected units correct estimation formulas are not used

9
Types of Surveys One-time Repeated or continuing
Attitudes, opinions Repeated or continuing Official statistics (short term indicators, agriculture, living conditions, crime) Other (drug use, consumer research, behaviors) International and comparative Official statistics (European Statistical System, poverty, water supply) Student achievement, literacy, values, happiness, marketing, attitudes
 Other (drug use, consumer research, behaviors) International and comparative. Official statistics (European Statistical System, poverty, water supply) Student achievement, literacy, values, happiness, marketing, attitudes.")
10
Types of organizations
Official Statistics Centralized (NSIs) Decentralized (Different agencies) General survey work Private, academic IMF, OECD, UN
 Decentralized (Different agencies) General survey work. Private, academic. IMF, OECD, UN.")
11
Stakeholders Customers and users Researchers Survey organizations
Owners Interest organizations The general public

12
A Brief History Biblical censuses
Political arithmetic , Graunt and Eden The 1895 ISI proposal regarding representative investigations Bowley argues for random sampling 1913 in an attempt to connect statistical theory and sample design ISI agrees to promote extended investigation of representative methods in the mid-20s

13
Tschuprow, stratified random sampling, early 20s
The 1934 Neyman paper on the representative method and optimum allocation Neyman develops theories for sampling (cluster sampling, ratio estimation, two-phase sampling) and confidence intervals Fisher’s random experiments Nonsampling error theory in the 1940s
 and confidence intervals. Fisher’s random experiments. Nonsampling error theory in the. 1940s.")
14
Interpenetration 1946, Mahalanobis
The US Census Bureau survey model Data quality, Kish, Zarkovich Total survey design, Dalenius 1968

15
Developments in other disciplines (errors and their causes)
Questions and interviewers (1917-) The response process (1968-) Sudman, Bradburn, Cannell, Tourangeau Interviewer-respondent interaction Statistical process control (SPC) Shewhart’s control chart, 1924 Administrative applications of SPC in survey work, Minton 1968
 The response process (1968-) Sudman, Bradburn, Cannell, Tourangeau. Interviewer-respondent interaction. Statistical process control (SPC) Shewhart’s control chart, Administrative applications of SPC in survey work, Minton")
16
Quality Milestones Early quality management (building ships, maintaining roads, leading empires) Industrial revolution (Taylor, Benz, Ford 1910-)
 Industrial revolution (Taylor, Benz, Ford 1910-)")
19
The Quality Revolution Starts Here
Shewhart’s control chart for process control Dodge and Romig’s acceptance sampling A theory for statistical process control These are methods and tools to handle process variation

20
Juran’s spiral of progress Ishikawa’s 7 quality control tools
Deming’s 14 points Juran’s spiral of progress Ishikawa’s 7 quality control tools The Joiner Triangle (quality, scientific approach, teamwork) Taguchi’s experimental design Bottom line Recognition of the client/customer/user Increased competition A need for continuous improvement
 Taguchi’s experimental design. Bottom line. Recognition of the client/customer/user. Increased competition. A need for continuous improvement.")
21
Just a Few More Milestones
Business excellence models (ISO, EFQM, Malcolm Balridge), a clear user perspective TQM, Six Sigma, Kaizen, Lean, PDCA, BPR and more Quality assurance and quality control Standards and quality guidelines
, a clear user perspective. TQM, Six Sigma, Kaizen, Lean, PDCA, BPR and more. Quality assurance and quality control. Standards and quality guidelines.")
22
Quality According to ISO 9001
The totality of characteristics of an entity that bear on its ability to satisfy stated and implied needs

23
Definitions of Quality
General Fitness for use Design Conformance In the survey context Accurate, timely, accessible plus other dimensions Advanced visual display vs tables Tolerable error

24
Quality Assurance and Quality Control
QA is defined as a set of activities whose purpose is to demonstrate that an entity meets all quality requirements QC is defined as a set of activities whose purpose is to ensure that all quality requirements are met

25
Quality Product (QP) A QP is one that meets the needs and expectations of customers/clients/users
 A QP is one that meets the needs and expectations of customers/clients/users")
26
Eurostat’s Quality Dimensions
Relevance of statistical concepts Accuracy of estimates Timeliness and punctuality in disseminating results Accessibility and clarity of the information Comparability Coherence (Completeness)
")
27
The Process View Product characteristics are established together with the user The quality of the product is decided by the processes generating the product The processes are controlled via key process variables

28
Assuring and Controlling Quality
Quality Level Main stake-holders Control instrument Measures and indicators Product User, client Product specs, SLA, evaluation studies, frameworks, standards Frameworks, compliance, MSE, user surveys Process Survey designer SPC, charts, acceptance sampling, risk analysis, CBM, SOP, paradata, checklists, verification Variation via control charts, other paradata analysis, outcomes of evaluation studies Organization Agency, owner, society Excellence models, ISO, CoP, reviews, audits, self-assessments Scores, strong and weak points, user surveys, staff surveys

29
Measuring and Documenting Quality
Accuracy can be measured Other quality dimensions are qualitative and can be seen as constraints Quality profiles Quality reports Performance measures Codes of practice

30
Examples of Tools - 1 or other frameworks Checklists
Self-assessment via excellence model or other frameworks Checklists Quality management (TQM, Six Sigma) External and internal auditing Customer satisfaction surveys
 External and internal auditing. Customer satisfaction surveys.")
31
Examples of Tools - 2 Staff surveys
Quality control (verification, paradata) Documentation MSE component measures
 Documentation. MSE component measures.")
32
Improving Quality Benchmarking Changing processes
Small steps or business process reengineering Project teams Standardization via current best methods documents or standard operating procedures and checklists Development of quality guidelines Training

33
Quality management philosophies
This is how I run my company Theory a la Drucker Improvement methodologies (TQM, Six Sigma, Lean) Business Excellence Models (EFQM, Malcolm Baldrige)
 Business Excellence Models (EFQM, Malcolm Baldrige)")
34
EQFM Model 2010

35
Contents of ISO 20252 (sections)
Scope Terms and definitions (Swedish translation, some terms inconsistent with terms used at Stats Sweden) Quality management system requirements (documentation, staff competence and training ) Managing the executive elements of research (research proposals, project schedules, Questionnaire Design) Data collection (field worker training, validation levels & methods, also qualitative data collection) Data management and processing (coding, data editing, data storage & data security, eg. original data shall be kept) Report on research projects
 Quality management system requirements (documentation, staff competence and training ) Managing the executive elements of research (research proposals, project schedules, Questionnaire Design) Data collection (field worker training, validation levels & methods, also qualitative data collection) Data management and processing (coding, data editing, data storage & data security, eg. original data shall be kept) Report on research projects.")
36
What Is Six Sigma? Results oriented management
Infrastructure and competence Problem-solving methodology

37
Six Sigma focuses on… variations customers processes chronic problems
results

38
Why the name Six Sigma? With a sigma level of 6σ a process has no more than 3.4 defects per million opportunities (dpmo)
 .")
39
Control chart (example)
")
40
Understanding Variation (I)
Common cause variation Common causes are the process inputs and conditions that contribute to the regular, everyday variation in a process Every process has common cause variation Example: Percentage of correctly scanned data, affected by people’s handwriting, operation of the scanner…

41
Understanding Variation (II)
Special cause variation Special causes are factors that are not always present in a process but appear because of particular circumstances The effect can be large Special cause variation is not present all the time Example: Using paper with a color unsuitable for scanning

42
Action Eliminate special cause variation
Decrease common cause variation if necessary Do not treat common cause as special cause

43
Översiktsbild av Partisympatiundersökningen (006)
s Översiktsbild av Partisympatiundersökningen (006)
")
44
Roots of paradata Traditional global ones such as error rates (since 1940) The Bristol monograph The 1998 ASA session in Dallas The Eurostat LEG on Quality Handbook on process quality Rapid development last 10 years

45
Meta and para Prefixes derived from Greek
Meta (discussions about discussions, data about data) Para (beside, near, beyond, parallel)
 Para (beside, near, beyond, parallel)")
46
Mick Couper’s trilogy Data Metadata (data about data)
Paradata (data about processes)
")
47
Standards There are many standards for surveys; examples include
ISO 20252 OMB standards NCES statistical standards Quality guidelines developed by specific organizations (Stat Can; RTI; etc.) ESS Standards for survey reports
 ESS Standards for survey reports.")
48
A Standard Is… A document that
describes methods and procedures for the collecting, processing, storing, and presenting survey data. define the (minimal) level of quality and effort that is acceptable for all survey processes
 level of quality and effort that is acceptable for all survey processes.")
49
What purposes do survey standards serve?
Define a minimally acceptable level of quality that organizations should attain. Provide consistency across surveys in different organizations Facilitate communication of complex concepts, formulas, procedures and methodologies Provide transparency of the methodologies used to produce a survey data set. Transfers skills and knowledge of best survey practice

50
We Concentrate on Accuracy
Data must be of sufficient quality for decision-making Other dimensions are constraints Accuracy is much more difficult to understand It is important to convey information on error sources and their contributions to total survey error Accuracy is measured by the mean squared error, MSE

51
Two Routes to Handling Survey Errors
Get an estimate of MSE so that we get confidence or other intervals that we can trust Try to develop and use methods that are almost error-free so that the estimated variance becomes an approximation of the MSE

52
What is mean squared error?
MSE = Bias2 + Variance = (Bspec + BNR + BFr + Bmeas + BDP)2 + Varsamp + Varmeas + VarDP
2. + Varsamp + Varmeas + VarDP.")
53
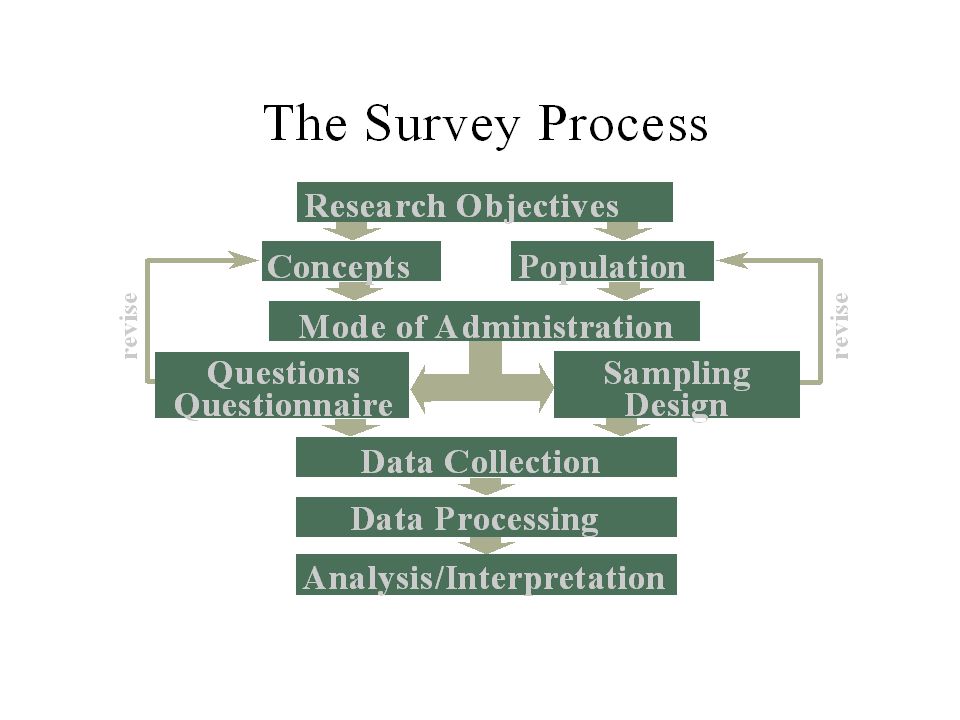
The Survey Process Revisited

55
3M Survey Life Cycle Paradigm
Copyright CCSG - ccsg.isr.umich.edu

56
Examples of issues Research questions and survey questions
General survey design Target population Main mode or mix of modes Developing the instrument Sampling design Data collection Data processing Estimation Providing survey results Quality assurance Quality control Evaluation

57
Objective of Survey Design
Maximize survey quality for given budget or Minimize cost of achieving specified level of quality

58
Sampling Error Nonsampling Error
Survey Error Sampling Error Nonsampling Error Due to selecting Errors due to a sample instead of mistakes or system the entire pop’n. deficiencies.

59
Nonsampling Error Specification Error Frame Error Nonresponse Error
Processing Error Measurement Error

60
Risk of Bias and Variance by Error Source

61
How do we estimate bias? Obtain measurements that are essentially error free (“gold standard measurements”) Implement preferred survey methods on a limited basis Record checks Comparisons to external gold standard estimates Census, CPS, other high quality national surveys Modelling attempts

62
Effects of Nonsampling Errors of Estimates - 1
Variable errors increase the variances of means, totals, and proportions Confidence levels for interval estimates may be over-stated Systematic errors bias the estimates of means, totals, and proportions

63
Effects of Nonsampling Errors of Estimates - 2
Both variable and systematic errors bias estimates of correlation and regression coefficients The nominal level of Type I error can be either to high or too low in the presence of nonsampling errors.

64
Total Survey Error Sampling usually more efficient than census
Sampling error predictable Nonsampling error nonpredictable Find the balance Use risk management

65
Conclusions Survey design involves allocations of resources using incomplete and imperfect information Objective should be to minimize total error subject to cost constraints

66
Specific Error Sources

67
Specification Error Concepts Objectives
Subject matter problem translated into a statistical problem Mismatch between research question and survey question Are all research questions covered?

68
Frame Errors Coverage errors Classification errors Missing units
Duplications Extraneous units Classification errors Industry (e.g., Standard Industry Classification (SIC)) Geography Size
) Geography. Size.")
69
Frame Errors (Cont’d) Contact errors Other errors
Address incomplete or incorrect Contact name Phone number Other errors Unit structure error Frame not current => Errors

70
Not on Frame On Frame = mean for entire target pop’n

71
Relative Bias Due to Coverage Error

72
Coverage Bias as a Function of tc and the Relative Difference Btwn and
25 tc = .50 20 Relative Coverage Bias (%) tc = .70 15 10 tc = .90 5 -50 -40 -30 -20 10 20 30 40 50 -10 -5 -10 -15 -20 -25 Relative Difference Btwn Covered & Noncovered (%)
 tc = tc = Relative Difference Btwn Covered & Noncovered (%)")
73
Nonresponse Error Unit nonresponse Noncontacts Refusals
Item nonresponse Individual questions skipped

74
Nonresponse Bias Total Population Nonrespondents Respondents

75
Relative Bias Due to Nonresponse
RBNR = (1- tR) ( YR - YNR Y )
 ( YR - YNR. Y. )")
76
Example tR = Response rate for a tele. survey = 75%
YR = Av. income for respondents = 107 Kr. YNR = Av. income for nonrespondents = 89 Kr. Y = .75 (107) (89) = Kr. Example
 (89) = Kr. Example.")
77
RB = (.25) = or 4.4% ( ) 102.50 Example
 = .044 or 4.4% ( ) Example")
78
Relative Diff Btwn Respondents & Nonrespondents (%)
Response Bias as a Function of tR and the Relative Difference Btwn YR and YNR 25 tR = .50 Relative Response Bias (%) 20 tR = .70 15 10 tR = .90 5 -50 -40 -30 -20 10 20 30 40 50 -10 -5 -10 -15 -20 -25 Relative Diff Btwn Respondents & Nonrespondents (%)
 20. tR = tR = Relative Diff Btwn Respondents & Nonrespondents (%)")
79
Components of Response and Nonresponse

80
Estimating the Unresolved Units That Are In-Scope
(4) (2) x (3) = (3A)
 (2) x. (3) = (3A)")
81
In-scope Units

82
Out-of-scope Units

83
Response Rate Components Global Process Data
Response rate (6) / [(3A)+(4)] Cooperation rate (6) / [(6)+(13)] Refusal rate (13)/ [(6)+(13)] Refusal rate (13)/ [(3A)+(4)] Nonresponse rate (7) / [(3A)+(4)]
 / [(3A)+(4)] Cooperation rate (6) / [(6)+(13)] Refusal rate (13)/ [(6)+(13)] Refusal rate (13)/ [(3A)+(4)] Nonresponse rate (7) / [(3A)+(4)]")
84
Factors Influencing Refusals
Survey Design: Mode Respondent rule Interview length Interview period length Survey topic Questionnaire design

85
Respondent Characteristics:
Age, gender, income, health Urban-rural Crime rate Literacy

86
Interviewer Characteristics:
Age, gender, race, perceived income, etc. Prior experience (skill, confidence) Interviewer expectations Attitude, recent experience, motivation Societal Factors: Social responsibility Legitimacy of survey objective
 Interviewer expectations. Attitude, recent experience, motivation. Societal Factors: Social responsibility. Legitimacy of survey objective.")
87
Psychological Factors (Groves, Cialdini, Couper, 1992)
Reciprocation: Compliance as repayment for a gift, payment, or concession; benefit to R Consistency: Compliance is consistent with an announced position (belief, attitude, or value) Social Validation: More willingness to comply if one believes that similar others would also comply
 Social Validation: More willingness to comply if one believes that similar others would also comply.")
88
Authority: Compliance is more likely if request comes from a legitimate authority
Scarcity: More willingness to comply to secure opportunities that are scarce Liking: More willingness to comply to requests from interviewers who are liked

89
Implications for Interviewing
Prolong Interaction: Maintain conversation to identify cues to use with psychological factors Tailoring: Adapt interviewing approach to the sample unit

90
Other Methods to Handle NR
Decrease respondent burden New theory for respondent-friendly questionnaires Incentives Call scheduling algorithms Adjusting for nonresponse Dillman’s TDM Mixed mode Ensuring confidentiality

91
The Response Process and Its Implications for Questionnaire Design
Introduction to Measurement Error The Response Process and Its Implications for Questionnaire Design Research Triangle Institute

92
Setting Information System Respondent Interviewer Instrument Mode
of Data Collection Setting Self- Admin

93
Response Processes Cannell, Miller and Oksenberg 1981 Tourangeau 1984
Cantor and Edwards 1991 Biemer and Fecso 1995 Sudman, Bradburn and Schwarz 1996 Tourangeau, Raps and Rasinski 2000 Sudman, Willimack, Nichols and Mesenbourg 2000 Willimack and Nichols 2010

94
Response Processes Individuals Establishments Comprehension Retrieval
Judgment and estimation Communicating an answer Encoding in memory/record formation Identification and selection of respondents Assessment of priorities Comprehension Retrieval Judgment and estimation Communicating an answer Data release

95
Phenomena I Middle alternatives and DK Vague terms Reference period
Satisficing Telescoping Recency Primacy Surprise questions Context effects Response alternatives effect Middle alternatives and DK Vague terms Reference period Double-barreled questions Sensitive questions

96
Phenomena II Social desirability bias Respondent calculations
Vague quantifiers Number of scale points Progress indicators Aided recall Labelling scale points Numerical labels Acquiescence General and specific questions CAPITALIZED TEXT Images

97
Implications for Questionnaire Design
Wording Length Format Open Closed Scales Filter Positioning of questions Type of question Factual Attitude Hypothetical Layout Navigation Computer-aided

98
Encoding/Record Formation
Description Knowledge is obtained, processed, and is either stored in memory or a physical record is made. To be retrieved the information must exist.

99
Types of Errors: Proxy R error; responses from R’s who really “don’t know” Memory is incomplete, distorted, or inaccurate Records are missing, incomplete, or incompatible with survey requirements

100
Comprehension Description
Meaning of the question, as researcher intended it, is understood by the respondent

101
Types of Errors: Context Errors Use of technical terms
Translation problems Misleading response alternatives

102
Retrieval of Information
Description Respondent retrieves relevant information from memory or from records or other external sources

103
Types of Errors: Forgetting Telescoping Estimating
Use of out-dated records

104
Judgment and Formatting a Response
Description Information is evaluated and a response is formatted corresponding to the response alternatives presented

105
Types of Errors: Response alternatives are too constrained
Response alternatives suggest a response distribution Respondents are pressured into giving a “top of the head” response

106
Response Editing and Communication
Description Respondent edits response and communicates it

107
Types of Errors: Social desirability effects Fear of disclosure
Acquiescent behavior

108
Errors Due to Interviewers and Interviewing
Interviewers and Respondents Errors Due to Interviewers and Interviewing Research Triangle Institute

109
The Role of the Interviewer
School A: “Standardized” interview perspective Requires interviewers to: Read questions exactly as worded Refrain from unscripted interactions Obtain a codeable response from the respondent Avoid attempts to clarify concepts unless clarifications are prescripted

110
School B: “Collaborative” or “conversational” interview perspective
Requires interviewers to: Detect and repair respondent misunderstanding of the question Collaborate with respondent in the interview process Make common sense inferences in recording answers Redesign questions to adapt them to the respondent’s situation

111
In practice Conversational flexible interviewing approach
Mixture of standardized and conversational Person-oriented style

112
Systematic Interviewer Errors
Discussing personal opinions with the respondent Inconsistent probing Inconsistent feedback Rewording or misinterpreting questions Falsification

113
Systematic Errors Poor questionnaire design systematic errors
across all respondents Interviewer error within an interviewer’s assignment

114
Design Factors that May Explain Interviewer Effects

116
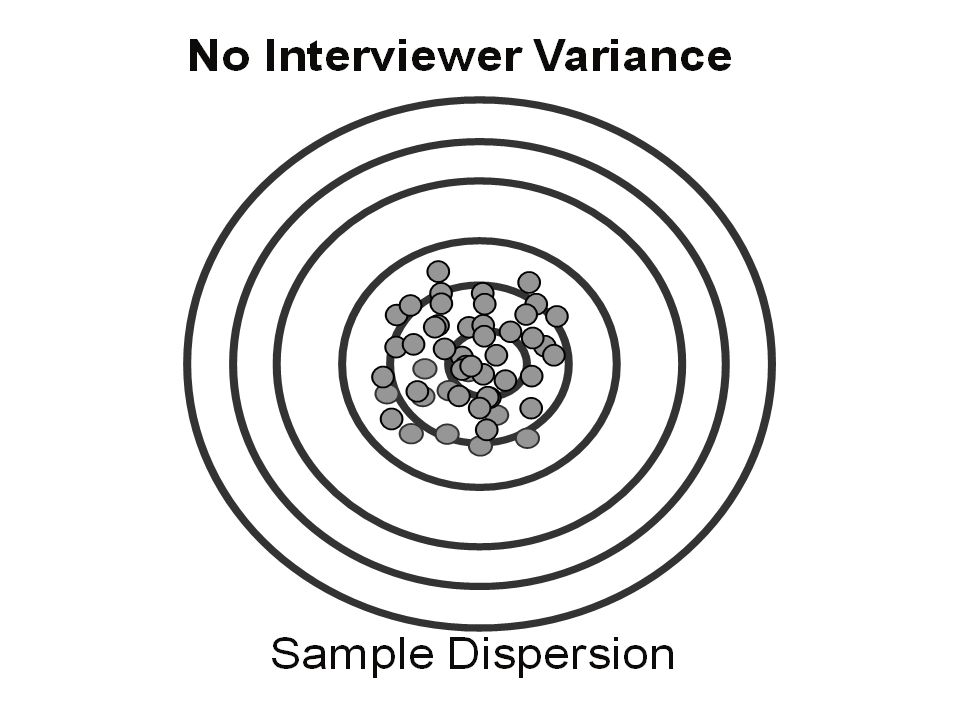
Interviewer Variance Interviewer A Interviewer E Interviewer B
Interviewer C Interviewer D Interviewer Variance

117
Interviewer Error Model
Observed value = true value + systematic error + variable error Using this model, we estimate: rint = variance (systematic error) total variance of observed value
 total variance of observed value.")
118
Consequences of Interviewer Error for Totals and Means
Variance of y (bar) is increased (i.e. multiplied) by the factor 1 + (m - 1) rint
 is increased (i.e. multiplied) by the factor. 1 + (m - 1) rint.")
119
Computation of the Increase in Variance
Suppose m = 100 and rint = .01 then 1 + (m - 1) rint = 1 + (99) x .01 = 2, approx. Example
 rint = 1 + (99) x .01. = 2, approx. Example.")
122
Evaluating Interviewer Performance
Monitoring telephone interviews Tape and video recording and behavior coding Verification recontact Reinterviews On-site observations Questionnaire review Keystroke files Mock interviews

123
Data Collection Modes and Associated Errors
Interview Mode and Setting Data Collection Modes and Associated Errors Research Triangle Institute

124
Data Collection Mode Modes of data collection Choosing a mode
Data quality considerations New technologies and mode

125
Modes I CAPI = Computer Assisted Personal Interviewing
ACASI = Audio CASI CATI = Computer Assisted Telephone Interviewing PAPI = Paper and Pencil Interviewing CADE = Computer Assisted Data Entry

126
Modes II TDE = Touchtone Data Entry
CASI = Computer Assisted Self Interviewing EDI = Electronic Data Interchange DBM = Disk by mail EMS = Electronic Mail Survey VRE = Voice Recognition Entry T-ACASI = Telephone ACASI

127
Face-to-face Flexible Expensive
Advantages and drawbacks of interviewer Visual aids

128
Telephone interviewing
Similar to f-f but less flexible Fast Monitoring possible Questionnaires have to be simpler

129
Mail Good for sensitive topics No control over response process
Can be made respondent-friendly All survey materials must be crystal-clear Respondent sets the pace Question order effects reduced

130
Web Surveys Internet access varies
Differences in computer systems and browsers must be considered Good for visual stimuli Questionnaires should be short Fast and inexpensive

131
Diary Recall error increases over time Heavy response burden
Behavior can change temporarily Survey topic is such that total survey period is quite long

132
Administrative records
Errors similar to those of other modes Statisticians have sometimes no control over contents, updates, etc Statistical purposes come in second after administrative ones Conceptual differences common

133
Direct observation No respondents Devices and calibration problems
Various kinds of observations Counting behaviors, eye estimates, anthropology, mystery shopping, price collection, photos Observer errors (rho)
")
134
Mixed modes Can be an “optimal” solution
Can be a necessity due to frame problems or nonresponse problems Give respondents a choice Adjustment of questions and questionnaire seldom done

135
The Choice of Mode Each mode has advantages and disadvantages regarding Costs Measurement errors Nonresponse and coverage Flexibility Timeliness

136
The Decision Regarding Mode
Sometimes there is no real choice due to costs or practical constraints Often more than one mode must be used Pure mode effects difficult to assess The decision often concerns a main mode

137
Summary The choice of mode can be very simple or very complex
Error structures of new modes are not fully understood

138
Summary The choice of mode can be very simple or very complex
Error structures of new modes are not fully understood

139
Data Processing Errors and Their Control
Data Processing Quality Data Processing Errors and Their Control Research Triangle Institute

140
Data Processing Steps for PAPI
1. Check-in: questionnaires are collected and work units are formed 2. Scan edit: entries are inspected to avoid data entry problems 3. Data entry: questionnaire data are captured via keying, scanning or other optical sensing 4. Editing: captured data are “corrected” and “cleaned;” missing data are “imputed.”

141
Data Processing Error Relatively sparse literature
Some steps are very error prone (e.g., coding and editing) Errors are both systematic and variable rho Increased automation and integration reduces variable error while increasing systematic error
 Errors are both systematic and variable. rho. Increased automation and integration reduces variable error while increasing systematic error.")
142
Data Capture Errors Keying errors
Discovered by verification keying or editing Error rates usually small based on records, fields or characters Studies often conducted in QC environments The vital few large errors can have large effects on MSE

143
Data Capture Errors (cont’d)
Intelligent Character Recognition Error types are substitution and rejection Substitution errors can be systematic Condition of incoming documents and the equipment is crucial which calls for continuing calibration Might have to be complemented with manual keying

144
Editing definition Editing is the identification and, if necessary, correction of errors and outliers in individual data used for statistics production The definition does not state that all errors be corrected or even identified Editing can be very costly

145
Purpose of editing To provide information about data quality (patterns and root causes) To provide information about future survey improvements To ”clean up” the data

146
Different Kinds of Editing
Micro-editing: Editing at record level Macro-editing: Editing at aggregate level Selective editing Output editing

147
The result is overediting
Historical reasons Large budgets Really QC of the data collection operation Feedback loop often missing Risk management

148
Key process variables for editing (examples)
Edit failure rate (#objects with edit failures/#objects edited) estimates amount of verification Correction rate (#objects corrected/#objects edited) estimates the effect Edit success rate by variable (#objects with changes on variable X/#objects with edit failures on X estimates how successfully the edits identify errors on X
 estimates amount of verification. Correction rate (#objects corrected/#objects edited) estimates the effect. Edit success rate by variable (#objects with changes on variable X/#objects with edit failures on X estimates how successfully the edits identify errors on X.")
149
Coding Classification process where open-ended responses are classified into coding categories Coding can be expensive, error-prone and boring Coding can be manual centralized or decentralized, automated or computer-assisted

150
Input Action Output Response Coder Code Number Coding Judgment
Instructions Nomenclature Coder Judgment Code Number Assignment The Generic Coding Process

151
Coding Errors Coding is subjective in nature
Error rates and variability rates can be large Coding error occurs when there is a deviation between the assigned code number and the true code number

152
Coding Errors (con’d) Coding errors are identified by verification
Coding rules and nomenclatures may be incomplete Errors are controlled by automation, dependent, and independent verification

153
Examples of Coding Error Rates
1970 Swedish Census Occupation 13.5 % Industry 9.9 % 1970 US Census Occupation 13,3 % Industry 9.1 % 1991 RTI Occupation 21% Industry 17%

154
Two-way Independent Verification with Adjudication
Production coding by Coder A resulting in code number xA Verification coding by Coder B resulting in code number xB Compare code numbers xA and xB xA = xB? xA = xB is the final, outgoing code number by Coder D resulting in code number xD xD is by Coder C resulting in code number xC xA , xB and xC xA = xC? or xB = xC? xA = xC xB = xC is the final, outgoing No No Yes Yes Two-way Independent Verification with Adjudication

155
Automated Coding There should be a computer-stored dictionary
Responses are entered online or via some other medium like scanning or keying Responses are matched with dictionary descriptions and based on that matching the responses are coded by the software or transferred to manual coding By collecting and analyzing process data the system is continually improved

156
Levels of Automation Computer Assisted Coding Automated
Matching can be exact or inexact Coding degrees obtained: -Purchases 73% (Sweden) -Industry and occupation 63% (US)
 -Industry and occupation 63% (US)")
157
Key process variables in coding
Coding degree in AC and MC Effects in coding degree by updates of dictionary Coding degree by category, AC and MC Coding error rate by coders, categories, coding mode and update version CAC consultation degree by category and coder

158
File preparation Attaching weights to each unit
Final weight is a product of base weight and adjustment factors for nonresponse and noncoverage No theory for measurement error adjustment yet Computation can be difficult Application of disclosure avoidance techniques, macrodata and microdata

159
The Total Survey Error Framework

160
Deming (1944) “On Errors in Surveys”
American Sociological Review! First listing of sources of problems, beyond sampling, facing surveys The 13 factors

161
Deming’s 13 factors -The 13 factors that affect the usefulness of a survey -To point out the need for directing effort toward all of them in the planning process with a view to usefulness and funds available -To point out the futility of concentrating on only one or two of them -To point out the need for theories of bias and variability that correlate accumulated experience

163
Comments on Deming (1944) Does include nonresponse, sampling, interviewer effects, mode effects, various other measurement errors, and processing errors Omits coverage errors Includes nonstatistical notions (auspices) Includes estimation step errors (wrong weighting) “Total survey error” not used as a term
 Includes estimation step errors (wrong weighting) Total survey error not used as a term.")
164
Sampling Text Treatment of Total Survey Error
Kish, Survey Sampling, 1965 Graphic on biases 65 of 643 pages on various errors, with specified relationship among errors

165
Frame biases “Consistent” Sampling Bias Sampling Biases Constant Statistical Bias Noncoverage Nonobservation Nonresponse Field: data collection Nonsampling Biases Observation Office: processing

166
Sampling Text Treatment of Total Survey Error
Särndal, Swensson, Wretman, Model Assisted Survey Sampling, 1992 Part IV, 124 pp. of 694, coverage, nonresponse, measurement error; omits processing error Lohr, Sampling Design and Analysis, 2009 34 of 600 pages on nonresponse, and 40 on nonsampling errors and survey quality

167
Other textbooks Cochran (1953). Sampling Techniques.
40 pages in concluding chapter on “sources of error in surveys” Deming (1950). Some Theory of Sampling. Starts with the 1944 factors but then continues with pure sampling Hansen, Hurwitz and Madow (1953). Sample Survey Methods and Theory, Vol 1. Nine pages on survey errors. Zarkovich Quality of Statistical Data.
. Some Theory of Sampling. Starts with the 1944 factors but then continues with pure sampling. Hansen, Hurwitz and Madow (1953). Sample Survey Methods and Theory, Vol 1. Nine pages on survey errors. Zarkovich Quality of Statistical Data.")
168
Total Survey Error (1979) Anderson, Kasper, Frankel, and Associates
Empirical studies on nonresponse, measurement, and processing errors for health survey data Initial total survey error framework in more elaborated nested structure

169
Sampling Variable Error Field Nonsampling Processing Total Error Frame Sampling Consistent Noncoverage Bias Nonobservation Nonresponse Nonsampling Field Observation Processing

170
Survey Errors and Survey Costs (1989), Groves
Attempts conceptual linkages between total survey error framework and psychometric true score theories econometric measurement error and selection bias notions Ignores processing error Highest conceptual break on variance vs. bias Second conceptual break on errors of nonobservation vs. errors of observation

171
Mean Square Error Variance Errors of Nonobservation Observational
construct validity theoretical validity empirical validity reliability Variance Errors of Nonobservation Observational Errors Coverage Nonresponse Sampling Interviewer Respondent Instrument Mode criterion validity - predictive validity - concurrent validity Bias Errors of Nonobservation Observational Errors Coverage Nonresponse Sampling Interviewer Respondent Instrument Mode

172
Nonsampling Error in Surveys (1992), Lessler and Kalsbeek
Evokes “total survey design” more than total survey error Omits processing error

173
Components of Error Topics
Frame errors Missing elements Nonpopulation elements Unrecognized multiplicities Improper use of clustered frames Sampling errors Nonresponse errors Deterministic vs. stochastic view of nonresponse Unit nonresponse Item nonresponse Measurement errors Error models of numeric and categorical data Studies with and without special data collections

174
Introduction to Survey Quality, (2003), Biemer and Lyberg
Major division of sampling and nonsampling error Adds “specification error” (a la “construct validity”) or relevance error Formally discusses process quality Discusses “fitness for use” as quality definition
 or relevance error. Formally discusses process quality. Discusses fitness for use as quality definition.")
175
Sources of Error Types of Error
Specification error Concepts Objectives Data element Frame error Omissions Erroneous inclusions Duplications Nonresponse error Whole unit Within unit Item Incomplete Information Measurement error Information system Setting Mode of data collection Respondent Interview Instrument Processing error Editing Data entry Coding Weighting Tabulation

176
Survey Methodology, (2009) Groves, Fowler, Couper, Lepkowski, Singer, Tourangeau
Notes twin inferential processes in surveys from a datum reported to the given construct of a sampled unit from estimate based on respondents to the target population parameter Links inferential steps to error sources

177
Inferential Population Construct
Representation Measurement Inferential Population Construct Validity Target Population Coverage Error Measurement Sampling Frame Measurement Error Sampling Error Response Sample Processing Error Nonresponse Error Edited Data Respondents Survey Statistic

178
Key Statistical Developments in Total Survey Error 1
Errors of observers can be correlated (1902), Karl Pearson Interpenetrating samples (1946), Mahalanobis Criteria for true values (1951), Hansen, Hurwitz, Marks and Mauldin Essential survey conditions, correlated response variance (1959), H-H-Bershad BC survey model “mixed-error model”(1961), H-H-B
, Karl Pearson. Interpenetrating samples (1946), Mahalanobis. Criteria for true values (1951), Hansen, Hurwitz, Marks and Mauldin. Essential survey conditions, correlated response variance (1959), H-H-Bershad. BC survey model mixed-error model (1961), H-H-B.")
179
Key Statistical Developments in Total Survey Error 2
Interviewer effects using ANOVA (Kish 1962) Simple response variance via reinterviews (1964), H-H-Pritzker Relaxed assumptions of zero covariance of true values and response deviations (1964, 1974), Fellegi Errors of Measurement (1968), Cochran Estimating model components via basic study schemes using replication, interpenetreation and combinations of the two (1969), Bailar and Dalenius Estimating nonsampling variance using mixed linerar models (1978), Hartley and Rao “Error Profile” of Current Population Survey (1978), Brooks and Bailar Multi-method multi-trait models on survey measures (1984), Wothke and Browne
 Simple response variance via reinterviews (1964), H-H-Pritzker. Relaxed assumptions of zero covariance of true values and response deviations (1964, 1974), Fellegi. Errors of Measurement (1968), Cochran. Estimating model components via basic study schemes using replication, interpenetreation and combinations of the two (1969), Bailar and Dalenius. Estimating nonsampling variance using mixed linerar models (1978), Hartley and Rao. Error Profile of Current Population Survey (1978), Brooks and Bailar. Multi-method multi-trait models on survey measures (1984), Wothke and Browne.")
180
Weaknesses of the Common Usage of “Total Survey Error”
Notably a user perspective is missing Key quality dimensions are missing in the TSE paradigm User often cannot or prefers not to question accuracy The complexity does not invite outside scrutiny of accuracy Users not really informed about real levels of error or uncertainty We don’t really know how users perceive information on errors

181
Other Weaknesses of the Total Survey Error Paradigm 1
1. Lack of routine measurements No agency does this Error/quality profiles are useful but rare 2. Ineffective influence on professional standards Little expansion beyond sampling error in practice Press releases on Federal statistics rarely contain even sampling errors Survey error research compartmentalized rather than integrated Methodologists tend to specialize Root causes of error often still missing How about OMB’s requirement of NR bias studies if NR expects to exceed 20%?

182
Other Weaknesses of the Total Survey Error Paradigm 2
3.Large burden on design of some estimators Interpenetration, reinterviews for variance estimation complicated and costly Intractable expressions for some components 4. Some assumptions unrealistic

183
Strengths of the Total Survey Error Framework
Taxonomic decomposition of errors nomenclature for different components Separation of phenomena affecting statistics in different ways variance vs. bias; observation vs. nonobservation; respondent/interviewer/measurement task; processing Conceptual foundation of the field of survey methodology subfields defined by errors Tool to identifying gaps in the research literature e.g., where are the error evaluation papers on processing?

184
Needed Steps in a Research Agenda for Total Survey Error 1
Integrating causal models of survey errors cognitive psychological mechanisms (anchoring, recall decay) Research on interplay of two or more error sources jointly e.g., nonresponse and measurement error Research on the interplay of biases and variances e.g., does simple response variance increase accompany some response bias reductions (self-administration effects)?
 Research on interplay of two or more error sources jointly. e.g., nonresponse and measurement error. Research on the interplay of biases and variances. e.g., does simple response variance increase accompany some response bias reductions (self-administration effects)")
185
Needed Steps in a Research Agenda for Total Survey Error 2
4. Guidance on tradeoffs between quality measurement and quality maximization and between measures and developing error-free processes - how much should we spend on quality enhancement vs. measurement of quality (Spencer, 1985)? 5. Integrating other notions of quality into the total survey error paradigm - if “fitness for use” predominates as a conceptual base, how can we launch research that incorporates error variation associated with different uses? Australian Bureau of Statistics
 5. Integrating other notions of quality into the total survey error paradigm. - if fitness for use predominates as a conceptual base, how can we launch research that incorporates error variation associated with different uses Australian Bureau of Statistics.")
186
Needed Steps in a Research Agenda for Total Survey Error 3
6. Exploiting a multiple-mode, multiple frame, multiple phase survey world 7. Need for methodological studies to assist the user 8. Costs and risks 9. Develop theories for optimal design of specific operations, design principles 10. More standards?

187
Measures and Indicators of Quality

188
Assuring and Controlling Quality
Quality Level Main stake-holders Control instrument Measures and indicators Product User, client Product specs, SLA, evaluation studies, frameworks, standards Frameworks, compliance, MSE, user surveys Process Survey designer SPC, charts, acceptance sampling, risk analysis, CBM, SOP, paradata, checklists, verification Variation via control charts, other paradata analysis, outcomes of evaluation studies Organization Agency, owner, society Excellence models, ISO, CoP, reviews, audits, self-assessments Scores, strong and weak points, user surveys, staff surveys

189
Process data and Paradata

190
Definitions Process is a series of actions or steps towards achieving a particular end Process quality is an assessment of how far each step meets defined criteria Process variables are factors that can vary with each repetition of the process Key process variables are factors that have a large effect on process end result

191
Some paradata terminology
Data, Metadata, Paradata Macro paradata– global process data such as response rates, coverage rates, edit failure rates, sometimes broken down Micro paradata– process data that concern individual records such as flagged imputed records, keystroke data Formal selection, collection, and analysis of key process variables that have an effect on a desired outcome, e.g., increased productivity

192
Definitions of paradata
Groves and Couper: Paradata are data about the data collection process Admit that definition is not well-evolved and subject to debate Groves et al. : Process and administrative data produced auxiliary to the survey data collection. The European term “process data” takes all survey processes into account Developing terminology standards is usually a waste of time

193
Paradata is a subset of process data but nothing to argue about
The important thing is: Never collect data on processes that are not related to quality, every collection should be goal-driven Collecting data on processes related to quality without using SPC and other proper analysis methods is extremely wasteful If you don’t know how to analyze don’t collect

194
Plan for continuous improvement (of a product) Marker and Morganstein 1997
Identify critical product characteristics Develop a process flow map Determine key process variables Evaluate measurement capability Determine stability of critical processes Determine process capability Establish a system for continuous process monitoring

195
Product characteristics
Ideally decided by the customer Communicating concepts and innovative ideas

196
Flow charts Flow, decision points, customers Define owners
List process variables (those whose values can affect product characteristics) At this stage a process “variable” is much broader than what is usually meant (factors such as prices, dates, lists of customers, etc can be “variables”
 At this stage a process variable is much broader than what is usually meant (factors such as prices, dates, lists of customers, etc can be variables")
197
Key process variables Difficult step
Key are those that have the largest effect on process outputs Collective knowledge is used in the selection process Tools include the Pareto diagram and the cause-and-effect diagram (fishbone or Ishikawa)
")
199
Measurement capability
Do not reach conclusions about process stability without knowledge about measurement errors Available data may be useless Data should allow quantification of improvement Be careful when it comes to customer satisfaction surveys

200
Determine stability of critical processes
Control charts Diagnose type of process variation (Assignable) special cause Common cause Take action
 special cause. Common cause. Take action.")
201
Determine system capability
After system changes (improvement projects) triggered by unacceptable common cause variation process stability must be reevaluated so that the new process is capable of meeting specs such as minimum response rates, minimum error rates, deadlines, etc Reduced variation is maintained by adhering to SOPs or CBMs
 triggered by unacceptable common cause variation process stability must be reevaluated so that the new process is capable of meeting specs such as minimum response rates, minimum error rates, deadlines, etc. Reduced variation is maintained by adhering to SOPs or CBMs.")
202
System for process monitoring
Processes cannot be expected to remain stable over time. Technology changes, new types of human errors, customer requirements change Thus, monitoring necessary

203
Paradata in coding, say, occupation
Manual: error rate by coder, category, coder experience, within- and between coder variability Computer-assisted: degree of computer-consulting, error rates combined with computer use Automated: error rates by category, coding degree in general, by dictionary update, by dictionary type

204
New types of paradata Interviewer notes Attributes of call attempts
Nature of interaction with sample member Behaviours during the interview Flagging imputed records Keystroke data Response latency

205
Importance of paradata (I)
Continuous updates of progress and stability checks (monitoring) Control charts, standard reports Managers choose to act or not to act Early warning system Input to long-run process improvement of product quality Analysis of special and common cause variation Input to methodological changes Finding and eliminating root causes of problems Research
 Control charts, standard reports. Managers choose to act or not to act. Early warning system. Input to long-run process improvement of product quality. Analysis of special and common cause variation. Input to methodological changes. Finding and eliminating root causes of problems. Research.")
206
Importance of paradata (II)
Responsive designs Simultaneous monitoring of paradata and regular survey data to improve efficiency and accuracy Input to organizational change E.g., centralization, decentralization, standardization Quality profiles, client communication, public use paradata files, inference, picturing quality over time

207
Exploratory analysis of paradata
Example of multivariate situation Observing one interviewer: Large % vacant housing, unusual time of interview, short interview length, response pattern does not vary much Possible curbstoning

208
Risks associated with paradata
Could be a lot due to automatic byproducts Could be a lot of indirect indicators of cost and quality Correct analysis approaches must be used Ethical concerns Overuse and underuse

209
Thoughts on development
Process indicators should be key Paradata are multivariate in nature and might have to be combined to be relevant We need to learn how to use paradata to intervene in the process as needed Create paradata archives to allow reanalysis so that understanding of what is key can grow or change Examine potential of partnership across organizations Communicating paradata with users

210
An Overview of Survey Error Evaluation Methods
Research Triangle Institute

211
Purpose of Survey Error Evaluation
Compare data collection modes or methods Optimize allocation of resources Error reduction for specific survey processes Provide users with information on data quality Adjustment estimates for nonsampling error

212
General Methods for Evaluation
Pretesting Experiments Statistical Process Control Process Control Key process variables Control charts Acceptance sampling Postsurvey validation

213
Some Techniques for Survey Evaluation I
Evaluation method Expert review of questionnaires Unstructured Structured Stage Design Purpose Identify problems with questionnaire layout and format, question wording, order and instructions

214
Some Techniques for Survey Evaluation II
Evaluation method Cognitive methods Behavior coding Cognitive interviewing Other cognitive lab methods Stage Design/pretest Purpose Evaluate one or more stages of the response process

215
Some Techniques for Survey Evaluation III
Evaluation method Debriefings Interviewer group discussions Respondent focus groups Stage Pretest/survey/post survey Purpose Evaluate questionnaire and data collection procedures

216
Some Techniques for Survey Evaluation IV
Evaluation method Observation Supervisor observation Telephone monitoring Tape recording/CARI Stage Pretest/survey Purpose Evaluate interviewer performance. Identify questionnaire problems.

217
Some Techniques for Survey Evaluation V
Evaluation method Post-survey analysis Experimentation Nonrandom observation Internal consistency External validation Stage Post-survey Purpose Compare alternative methods of data collection, estimate MSE components, validate estimates

218
Some Techniques for Survey Evaluation VI
Evaluation method Post-survey data collection Reinterviews Nonresponse follow-up Record checks Stage Post-survey Purpose Estimate MSE components

219
Basic interview-reinterview table for a dichotomous variable
Interview Reinterview 1 a b a+b c d c+d a+c b+d n

220
Some measures g=(b+c)/n gross difference rate or disagreement rate
A=(a+d)/n agreement rate (1-g) ndr=(b-c)/n net difference rate I=g/[p1(1-p2)+p2(1-p1)] index of inconsistency p1=(a+b)/n p2=(a+c)/n
/n agreement rate (1-g) ndr=(b-c)/n net difference rate. I=g/[p1(1-p2)+p2(1-p1)] index of inconsistency. p1=(a+b)/n. p2=(a+c)/n.")
221
Practical Survey Design for Minimizing MSE

222
What Should Be Designed?
Requirements+specifications+operations Ideal goal+ Defined goal+Actual results Good survey design means control of accuracy through the specs (QA) and control of operations (QC)
 and control of operations (QC)")
223
Some Early Thinking Hansen-Hurwitz-Pritzker 1967
Take all error sources into account Minimize all biases and select a minimum-variance scheme so that Var becomes an approximation of (a decent) MSE The zero defects movement that later became Six Sigma Dalenius 1969 Total survey design
 MSE. The zero defects movement that later became Six Sigma. Dalenius Total survey design.")
224
Alternative Criteria of Effectiveness
Minimizing MSE for a given budget while meeting other requirements Maximizing fitness for use for a given budget Maximizing comparability for a given budget All these reversed Something else?

225
The Elements of Design Assessing the survey situation (requirements)
Choosing methods, procedures, “intensities”, and controls (specifications) Allocating resources Assessing alternative designs Carry out one of them or a modification of it Have a Plan B
 Allocating resources. Assessing alternative designs. Carry out one of them or a modification of it. Have a Plan B.")
226
So, What’s the Problem? No established survey planning theory
Multi-purpose, many users The information paradox Uninformed clients/users/designers Much design work is partial, not total Limited knowledge of effects of measures on MSE and cost

227
More Problems Decision theory and economics theory not used to their potential New surveys conducted without sufficient consideration of what is already known No one knows the proper allocation of resources put in before, during and after The literature is small

228
Various Skills Needed Which Calls for a Design Team
Survey methodology Subject-matter Statistics (decision theory, risk analysis, loss functions, optimization, process control) Economics (cost functions, utility) IT
 Economics (cost functions, utility) IT.")
229
Rules of the Road Use reliable methods
Develop a survey plan showing the resource allocation to each stage To be able to allocate resources optimally, collect information during planning and implementation

230
Rules of the Road (cont’d)
Monitor the processes that lead to the product Disseminate information on data quality to users and producers

231
The Balance Between Cost, Errors and Other Quality Features
Quality dimensions conflict Accuracy vs timeliness Accuracy vs relevance Comparability vs accuracy Cost vs error

232
Problems that Impede our Ability to Optimize Surveys
Lack of expertise The relationship between resources spent on error reduction and actual error reduction is unknown Survey errors are highly interactive

233
Problems that Impede our Ability to Optimize Surveys (con’d)
Major surveys are multi-purpose All quality dimensions and constraints on them limit design flexibility It is not known how to allocate resources between pilot studies, error reduction and error measurement

234
Bad News and Good News Bad news
Cost-survey optimization can be extremely complex and much of this complexity is unknown

235
Bad News and Good News Good news
Simple models describing the relationship between cost and error are still useful because often the optimum is flat

236
The Adaptive Element The entire survey process should be responsive to anticipated uncertainties that exist before the process begins and to real time information obtained throughout the execution of the process or Use process data (paradata) to check, and if necessary, adjust the process
 to check, and if necessary, adjust the process.")
237
We Should Assemble What We Know
Assessment methods Design principles Trade-offs and their effects The potential offered by other disciplines We shouldn’t accept partial designs

238
Apply Design Principles
If pop is skewed then…. If pop is nested then…. If questions are sensitive then…. If a high NR rate is expected then…

239
Examples of Trade-offs
Accuracy vs timeliness Response burden vs wealth of detail Conduct survey vs other information collection Large n vs smaller n Mixed vs single mode NR bias vs measurement error NR vs interpretation by family members

240
Example of Outline for a Survey Plan
Statement of work Technical approach Management plan Schedule of activities and deliverables Budget

241
Checking out the Resources
Consult in-house experts Participate in professional activities Develop current best methods for major survey processes

242
Checking out the Resources (cont’d)
Apply findings from the survey methods literature Consult general quality guidelines developed by prominent organizations

243
Examples of resources Conferences ASA AAPOR ISI Topic Journals JOS
Survey Methodology POQ Books

244
Using Pilot Studies to Inform Survey Design
Paradox: In principle, the survey designer needs information that will not be available until the survey has been completed The answer: Pilot studies on a smaller scale than the survey itself

245
Examples of Pilot Study Topics
Choice of mode Length of recall period Topic sensitivity Response burden Clarity of concepts and definitions Effect of confidentiality pledges Question wording Alternative respondent rules Time estimates Expected rates of nonsampling error Cost components

246
Documentation Survey administrative processes Survey plan
Revisions of plan Process details Process variables

247
Documentation (con’d)
Quality reports Use framework based on quality dimensions Report estimates of MSE components In absence of MSE component estimates provide indicators of quality Implement a rolling evaluation scheme

Similar presentations


>")


 Chapter 1 Introduction and Data Collection.>")


