Download presentation
Presentation is loading. Please wait.

1
Workshop 3 on Focusing on the Case Qualitative Modelling

2
Topics Covered Herein Qualitative Regression Models The Odds Ratio – an online ppt to learn about it The log-odds as a Dependent Variable Alternatives: Dummy variables as independent variables Log-Linear analysis without a dep/indep causal strcture being superimposed Discussion of Causality in Multi-Level Situations Nested multi-level situations Non-Nested multi-level stratified reality Plurality of Causes – Is it operationalisable? Suggested Readings

3
Qualitative Regression Models consider the participation of men and women in the labour force. In logistic regression, in particular, the measurement mode is not assigned a priori except in so far as cases (in this case people) are identified as bearers of data. Even here, the case may bear not only the weight of causes that operate on or through persons, but also structural relations between larger classes of people and institutional factors that affect such a person. The variables in the regression are of a variety of levels of measurement (not all are continuous). The dependent variable in particular is qualitative in character.
 are identified as bearers of data. Even here, the case may bear not only the weight of causes that operate on or through persons, but also structural relations between larger classes of people and institutional factors that affect such a person. The variables in the regression are of a variety of levels of measurement (not all are continuous). The dependent variable in particular is qualitative in character..")
4
We make two translations of the act of entering a labour market. First, we allow people to declare how they have done that; secondly, we group these declarations into the larger categories active and inactive, transform this binary categorisation into a new continuous variable, the logit of activity. The logit is defined as the log of the odds of being active.

5
The odds of being active are defined as: the ratio of the probability of being active to the probability of being inactive. We take its logarithm, giving a new number on a wider scale ranging from negative to positive values. The logit, ie the log odds, is not constrained to be between 0 and 1.

6
One equation, for instance, summarising some results in this particular case, can be represented as follows: log of the odds of employment = -1.47(LTLI)+0.27*London+.61*Degree- 0.76*Noqual+0.92*Wife+.61 Each number shows whether the odds of being employed are raised or lowered by the presence of a given characteristic. In this equation, the following definitions are used.

7
LTLI = Long-term limiting illness (specifically, the person reports that they are unable to do some forms of work due to an illness or other disabling condition) London= Lives in Inner or Outer London or the rest of the Southeast Degree = Has a degree and/or a higher degree Noqual= Has no qualifications ie no CSEs or O- Levels or other qualifications Wife = Is married or cohabiting, and is female
 London= Lives in Inner or Outer London or the rest of the Southeast Degree = Has a degree and/or a higher degree Noqual= Has no qualifications ie no CSEs or O- Levels or other qualifications Wife = Is married or cohabiting, and is female")
8
In conclusion, critics of statistics argue that statisticians seek only regularities and assume closure in reality. In this section we showed that methodological closure can be assumed, and regularities within the data-set can be sought, without assuming closure in reality. Look at the Appendix to the handout to see whether the coefficients exhibit regularity. Some do. Some dont. What would you do?

9
Transition to Multi-Level Models

10
H1 - wage variation across occupational groups, acting as a proxy for a variety of labour-market segmenting practices, notably boundaries limiting potential entrants into occupations, is considerable even after person-level characteristics and occupation-specific characteristics are accounted for.

11
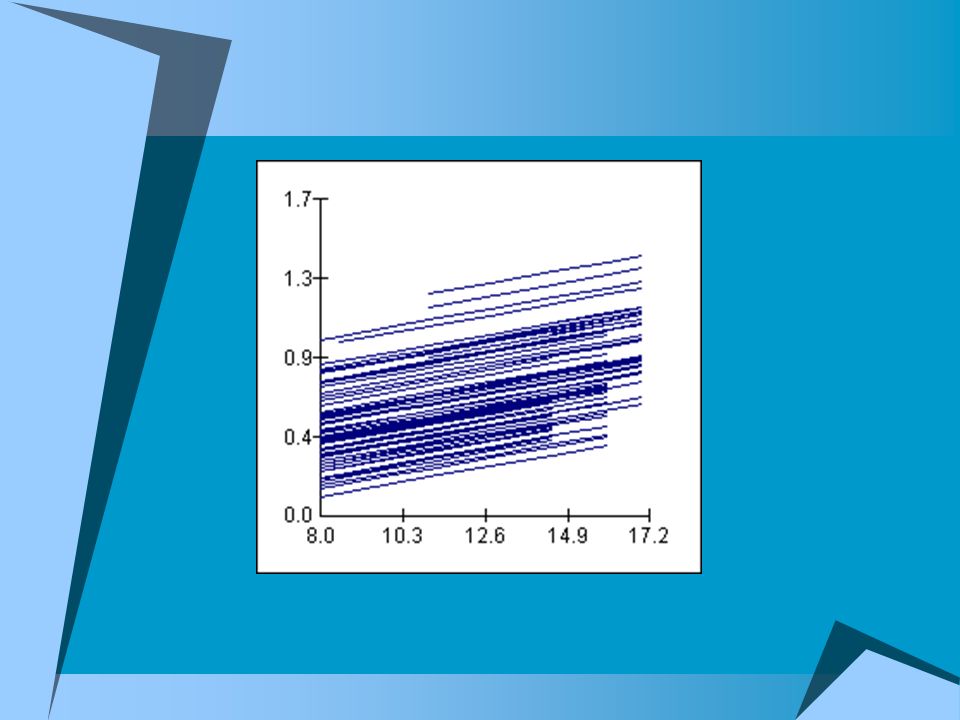
A graph of these advantages, with educationyears' constant slope, iscalled a random- intercept model. It is also called a fixed-effects model, since the effect of education and segpoint is a fixed effect rather than having a slope that varies from one SOC2 group to another.

14
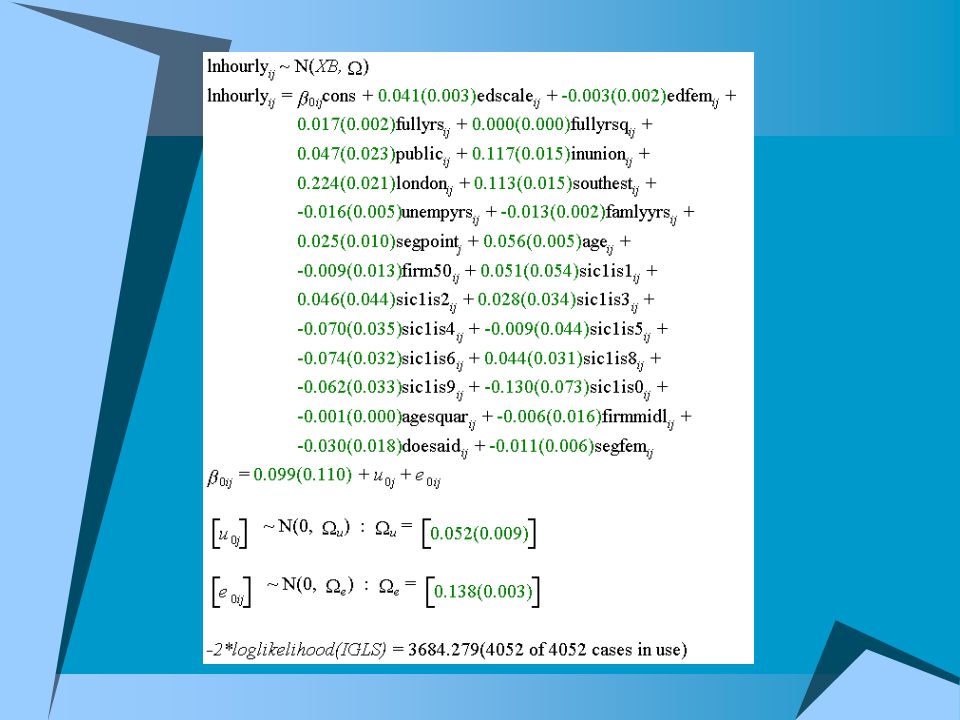
The model with the slope of lnwage on education varying by SOC2 occupational groups looks like this - but the slope differentials are just acceptably statistically significant -- t=2.5 or so:

17
Under this particular model, however, the obvious association of the predicte dwage with the 'numerical label' of teh SOC2 category disappears: Notice:

19
H2b) Furthermore, the interaction effect of SEGPOINT with GENDER in linear regression is not significant. (Need to test again for multilevel.) THE TEST: basic two-level model, lacking some controls: SAME MODEL but with SEGFEM = SEGPOINT * FEMALE: S
 THE TEST: basic two-level model, lacking some controls: SAME MODEL but with SEGFEM = SEGPOINT * FEMALE: S.")
24
The use of SOC2 as a level assumes in statistical discourse that the occupational categories are a 'random sample of a global population of occupational categories'. The population is not explicitly referring to any population outside of Great Britain or in another year than 1999/2000, but rather is hypothetical construction to enable us to use inferential discourse in deriving statistical significance values from the variables that exist at SOC2 level, notably 'SEGPOINT'. Here, inference at Level 2 means inferring from the sample data to the population. (Since this population is purely hypothetical, and we actually have a full account of every SOC2 category for 1999/2000, this is slightly misleading. By comparison, the sampling at Level 1, for individuals, and the weighting of the sample cases makes a lot of sense and is based in reality.)
.")
25
This graph shows merely that for a given occupation, whose mean education is on the x-axis, the predicted level of lnwage is the height of the point on the y-axis.

26
The corresponding multi-level random effects model, with tiny variations in slopes and a better fit than EDMEAN alone, looks like this: (very similar to the original SOC2 with EDSCALE model):
:")
29
Summary Discuss topics covered Reiterate welcome Reminder to submit paperwork Wrap-up

Similar presentations


.>")

 2004 Brooks/Cole, a division of Thomson Learning, Inc. Chapter 13 Nonlinear and Multiple Regression.>")


>")


. We now transition and begin discussion of.>")

