Download presentation
Presentation is loading. Please wait.

1
Transforming Scores Changing the scale of the data in some way. Change each score.

2
converting cm. to inches comparing values on different scales (e.g., height and weight) percentiles
 percentiles")
3
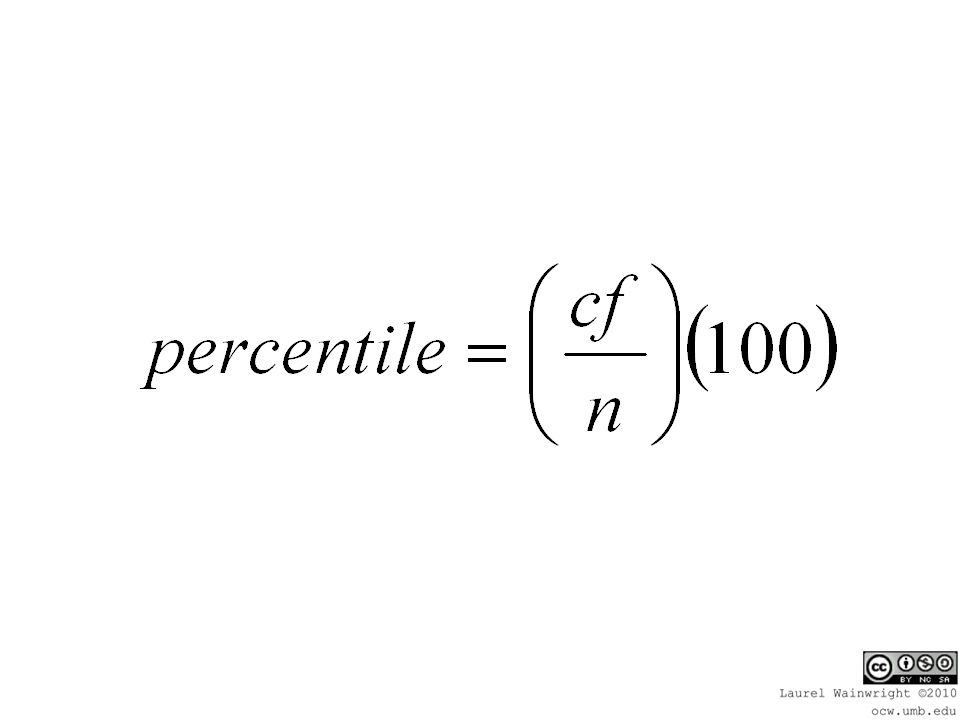
Percentiles: converting data into the % of people at or below a particular level.

4
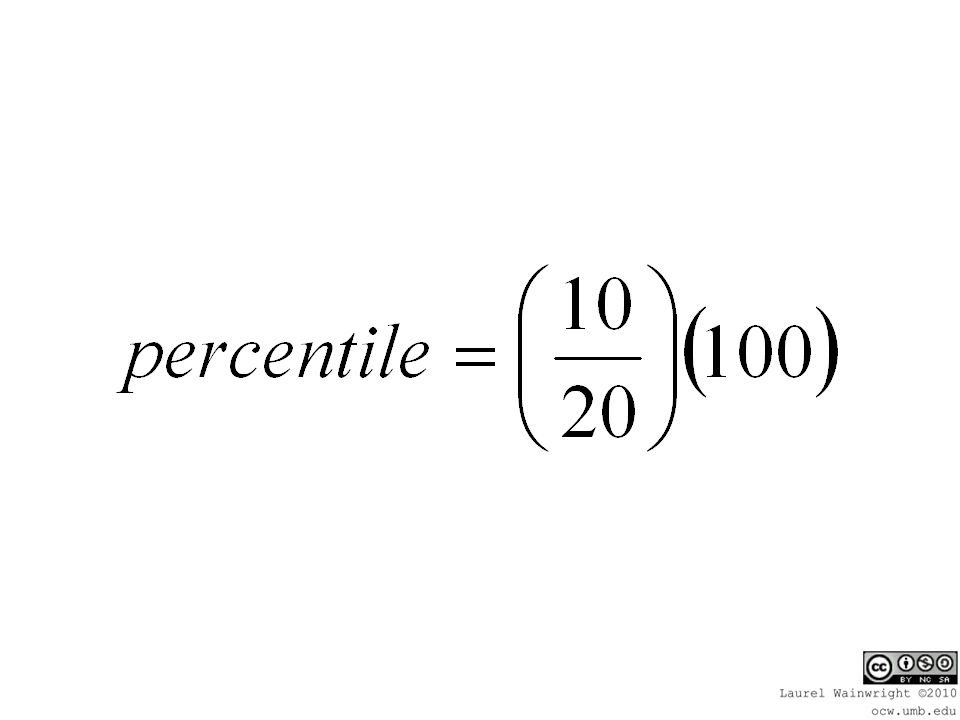
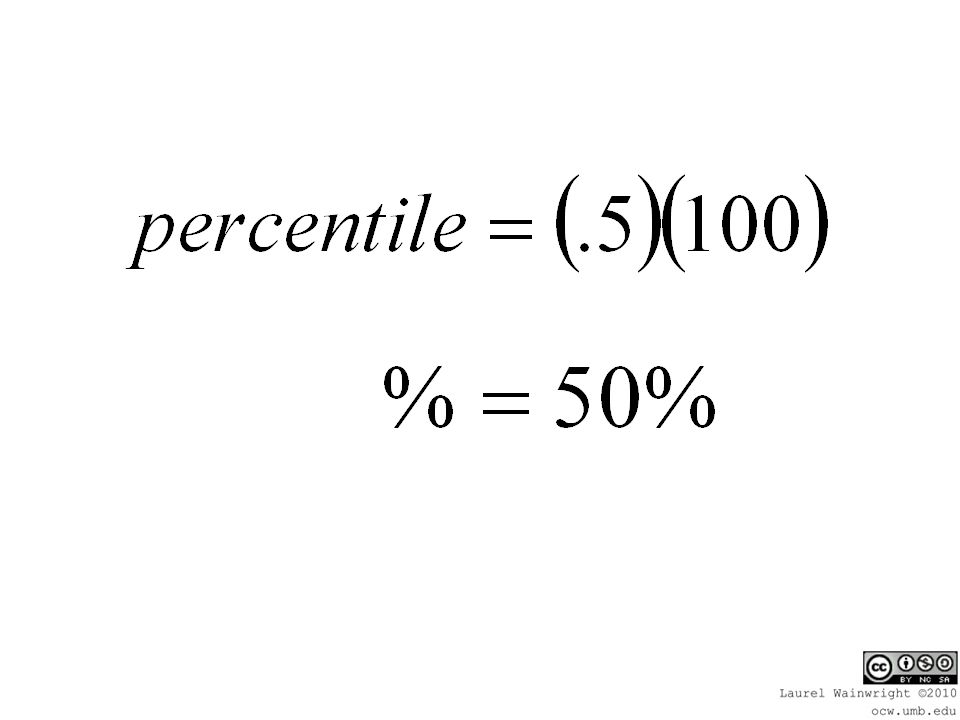
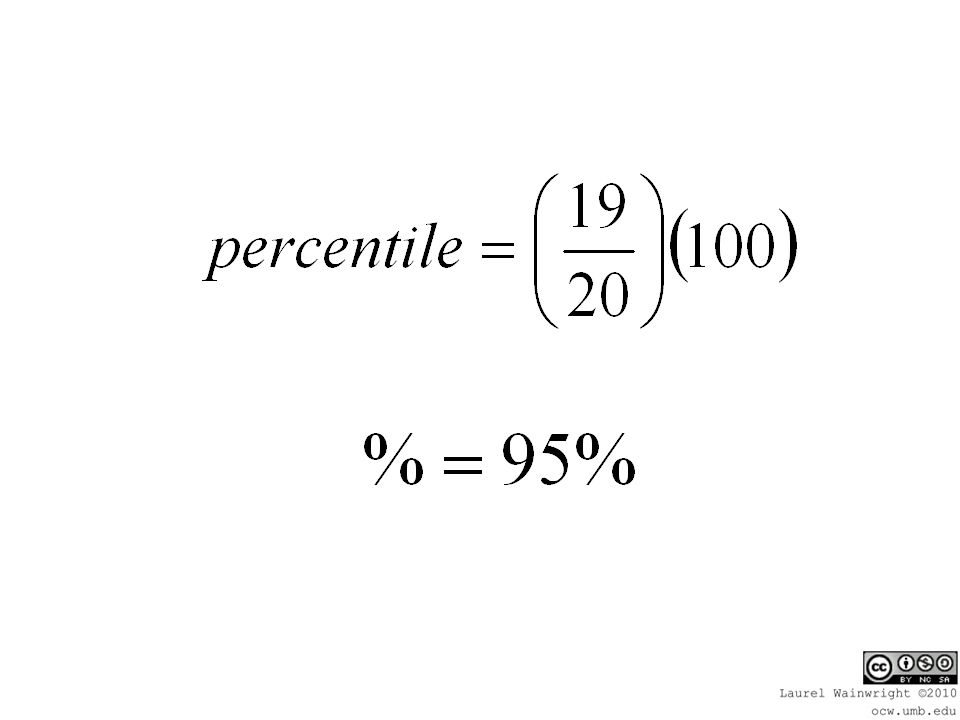
Example: Class A: score of 80 Class B: score of 55

5
Class A 981 962 882 853 822 802 763 723 702

6
Class B: 601 552 542 514 483 405 373

8
Class Acf 981 962 882 853 822 802 763 723 5 702 2

9
Class Acf 981 962 882 853 822 80210 763 8 723 5 702 2

10
Class Acf 98120 96219 88217 85315 82212 80210 763 8 723 5 702 2

13
Class B:cf 601 552 542 514 483 405 8 373 3

14
Class B:cf 601 55219 54217 51415 48311 405 8 373 3

15
Class B:cf 60120 55219 54217 51415 48311 405 8 373 3

17
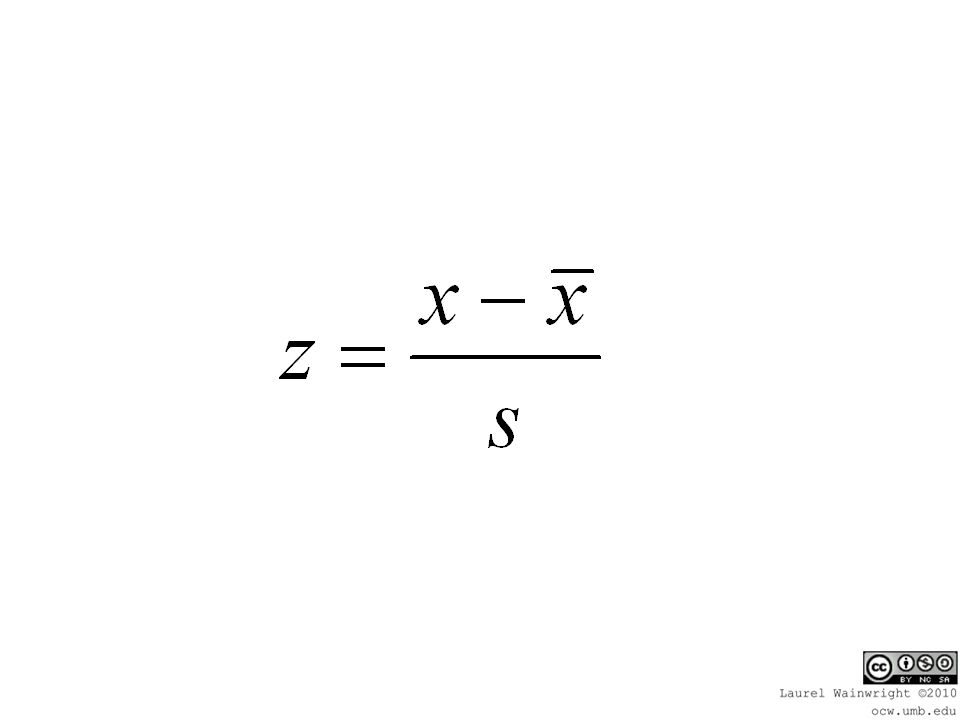
Z score: transforms raw data into distance from the mean in units of standard deviation

19
Your score was 80 in a class with a mean of 79 and a standard deviation of 4.

Similar presentations

>")


 many frequency distributions of scores.>")


