Download presentation
Presentation is loading. Please wait.

1
Dynamics of Permit Transfers in Alaska Salmon Fisheries Gunnar Knapp Professor of Economics Institute of Social and Economic Research University of Alaska Anchorage Gunnar.Knapp@uaa.alaska.edu 907-786-7717 Presented at CNREP 2010 Challenges of Natural Resource Economics & Policy New Orleans, Louisiana May 27, 2010

2
Management systems have been introduced in numerous fisheries worldwide which restrict participation in the fishery to holders of access rights Permits—right to participate in a fishery –Alaska example: Salmon limited entry permits Catch shares—right to harvest a share of the total allowable catch –Alaska example: Halibut individual fishing quotas (IFQs)
")
3
Management systems based on access rights bring significant economic benefits. More sustainable fisheries More efficient and profitable fisheries –Higher catches –Lower costs –Higher prices

4
An important issue which arises with access rights in where the holders of the access rights live. Where they live may have important economic and social consequences for regions and communities, by affecting: where fish are landed and processed where vessels are home-ported where fishing income is spent where fishing crew are hired opportunities for young people to learn about and enter into fishing the extent to which communities are (and perceive themselves as) fishing communities.
 fishing communities..")
5
Factors which may affect where holders of access rights include: Allocation of rights among residents of different regions and communities Migration of rights holders between regions and communities Transfers of rights between residents of different regions and communities

6
Transferability of access rights is controversial.

7
Most mainstream economists—and many fishermen— argue that transferability is desirable. Tietenberg (widely used resource economics textbook): –“Quotas should be freely transferable among fishermen.... With transferability, the entitlement to fish flows naturally to those gaining the most benefit from it because their costs are lower. Transferable quotas also encourage technological progress. Adopters of new cost-reducing technologies can make more money...” A practical method of facilitating entry and exit from the fishery Permit holders benefit from being able to sell to the highest bidder
: – Quotas should be freely transferable among fishermen.... With transferability, the entitlement to fish flows naturally to those gaining the most benefit from it because their costs are lower. Transferable quotas also encourage technological progress. Adopters of new cost-reducing technologies can make more money... A practical method of facilitating entry and exit from the fishery Permit holders benefit from being able to sell to the highest bidder.")
8
Other social scientists, in particular anthropologists—and some fishermen--express significant concerns about transferability. Windfall gains to initial recipients Difficulty of entry for new participants Transfers of access rights away from communities

9
I have been studying issues associated with transfers of Alaska salmon limited entry permits. 26 Alaska salmon fisheries Each fishery defined in terms of a geographic area and type of fishing gear. Limited entry implemented in mid-1970s Only permit-holders may deliver commercially harvested salmon Permits were “initially allocated” for free to persons with a history of participation in the fisheries “Point” system for determining who received permits favored local residents 11,047 transferable limited entry permits have been initially allocated, beginning in 1975 Permits are transferable by gift, inheritance or sale

10
Two types of issues are important to Alaskans with regard to geographic distribution of permit holdings Are permit holders Alaskans? Are permit holders “local residents” who live in the region where the fishery occurs? Terminology People who live in the region where the fishery occurs Local residents Alaskans Local residents People who live in other parts of Alaska Other Alaskans Non-Local residents People who live outside Alaska Non- Alaskans

11
Significant shares of Alaska salmon permits are held by non-local residents and non-Alaska residents. These shares have increased over time.

12
Alaska’s Commercial Fisheries Entry Commission (CFEC) has been tracking permit distribution for many years. FROM THE INTRODUCTION TO THE ANNUAL CFEC PERMIT DISTRIBUTION REPORT: “... Many people remain concerned that permit transfers might result in undesirable consequences with regard to the distribution of permits. There is a concern that permits will leave the state, or that permits will disappear from isolated fishing communities which are local to a limited fishery, thereby eroding the economic base. Because of these concerns about free transferability, CFEC has produced this updated report so that the legislature, the administration, and other interested parties will be kept accurately apprised of the facts... “

13
The causes and implications of changes in the distribution of permit holdings is a big and complex topic. Typology of Questions Implications For permit holdings by local residents For permit holdings by Alaskans Causes Net permit transfers between residents of different regions ?? Net migration of permit holders between regions ??

14
My research to date has focused on the causes and implications of net permit transfers for permit holdings by local residents, particularly in the Bristol Bay drift gillnet salmon fishery. Typology of Questions Implications For permit holdings by local residents For permit holdings by Alaskans Causes Net permit transfers between residents of different regions Main focus of my research Net migration of permit holders between regions

15
My talk today is about research in progress! Trends in local permit holdings Causes of changes in local permit holdings Review of research literature A theory of the causes of net permit transfers Hypotheses based on this theory Empirical evidence for hypotheses Policy issues

16
Alaska’s salmon fisheries vary widely with respect to gear, harvests, value, permit numbers, participation, and permit prices.

17
There are significant differences between fisheries with respect to the “local” share of initial allocations as well as subsequent trends.

18
In general, local permit holdings have declined for most fisheries. The extent of the decline varies widely between fisheries.

19
Alaska’s salmon fisheries vary widely with respect to the causes of changes in local permit holdings over time.

20
The Bristol Bay Drift Gillnet Salmon Fishery World’s largest sockeye salmon fishery 1980-2006 average real ex- vessel value of $154 million (2006 $) Historically 20-40% of total value of Alaska salmon fisheries Limited entry management since 1975 About 1900 permits issued Source: www.cf.adfg.state.ak.us/region2/finfish/salmon/maps/bb_all.php Bristol Bay drift gillnetter
 Historically 20-40% of total value of Alaska salmon fisheries Limited entry management since 1975 About 1900 permits issued Source: Bristol Bay drift gillnetter")
21
Bristol Bay catches vary significantly from year to year. Record catches in the early 1990s were followed by much lower catches in the 1997-98 and 2001-2003. Since 2004 catches have rebounded significantly.

22
Real (inflation-adjusted) prices in the Bristol Bay fishery declined dramatically from the late 1980s to 2001 due to competition from farmed salmon and other factors. Prices have risen slightly since 2001.

23
Falling catches and prices led to a dramatic decline in real ex-vessel value after the late 1980s. Value has rebounded sharply since 2002 to about $75 million but remains less than half the record values of the late 1980s.

24
There are twenty-six small “local” villages in the Bristol Bay region with predominantly Alaska Native populations. Historically these villages have been heavily economically dependent on the Bristol Bay fishery.

25
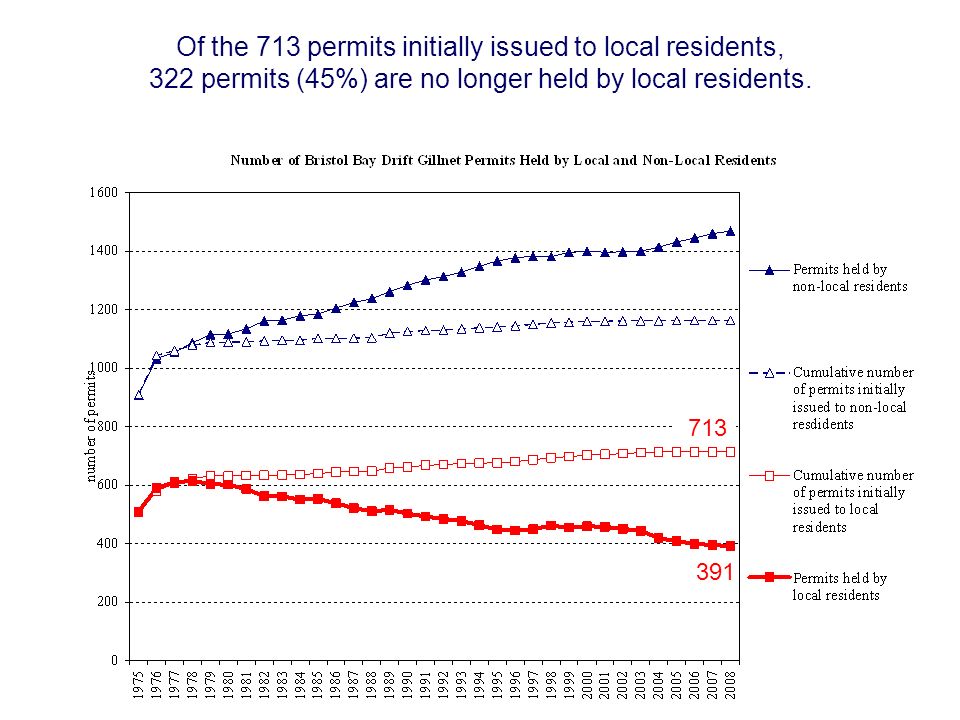
There has been a significant decline in the number and share of permits held by local Bristol Bay residents. 614 in 1978 319 in 2008

26
Of the 713 permits initially issued to local residents, 322 permits (45%) are no longer held by local residents. 391 713
27
While local permit holdings have declined, holdings by both other Alaskans and non-Alaska residents have increased.

28
Annual changes in local permit holdings have not been uniform.

29
Net transfers have been the most important cause of declining local permit holdings over time

30
Net local permit loss due to transfers declined during the 1990s. There were net gains in local permits due to transfers from 2000-2002. Net local permit loss resumed in 2003.

31
Net local permit loss due to migration began in the 1980s and has continued since then in all but a few years.

32
The relative importance of transfers and migration has changed over time.

33
There has been little theoretical or empirical analysis of inter-regional net transfers of fishery access rights. Why inter-regional net transfers occur How they are affected by economic factors How they are affected by fisheries management policies

34
In Alaska, several studies of permit transfers were undertaken in the early 1980s, in response to concerns about local permit loss. Langdon (1980) suggested two factors contributing to local permit loss would be: –Lower average earnings of rural permit holders –Less access to capital for potential rural permit buyers
 suggested two factors contributing to local permit loss would be: –Lower average earnings of rural permit holders –Less access to capital for potential rural permit buyers.")
35
Since the early 1980s: The Alaska Commercial Fisheries Commission (CFEC) has carefully documented trends in transfers and permit ownership Almost no further analysis has been done of: –The causes of local permit decline –How local permit holdings are likely to change in the future –How local permit holdings are affected by policy
 has carefully documented trends in transfers and permit ownership Almost no further analysis has been done of: –The causes of local permit decline –How local permit holdings are likely to change in the future –How local permit holdings are affected by policy")
36
An economic theory of permit transfers Permit transfers among individuals Net permit transfers between groups Net permit transfers between “local” and “non-local” fishermen

37
Every individual has a potential benefit from fishing and a potential cost of fishing which determines his potential net benefit from fishing. Benefit from fishing = value of fish sales + non-market benefit Cost of fishing = Operating cost + capital cost + opportunity cost Net benefit from fishing = Benefit from fishing - Cost of fishing

38
B1C1 Different individuals have different potential benefits, costs and net benefits from fishing. B2C2 B3C3 B4C4 C2 N1 N2 N3 N4

39
If a permit is required to fish, and permits are transferable, then every individual has a permit valuation driven by his potential net benefit from fishing and his cost of capital Benefit from fishing Cost of fishing Net benefit from fishing PERMIT VALUATION = Maximum price the individual would pay to buy a permit or Minimum price for which the individual would sell a permit Interest rate at which individual can borrow or Rate of return on alternative investments Maximum annual willingness to pay or Minimum annual willingness to accept

40
Suppose permits are not initially distributed by sale. They will not necessarily be distributed to the persons with the highest valuations. Valuation Number of permits Number of persons Valuations of permit holders Valuations of non-permit holders

41
Transfers will allocate permits to the persons with the highest valuations. These transfers are market adjustments to the initial allocation. Valuation Number of transfers Number of permits Price PERMIT SUPPLY CURVE Distribution of valuation for initial permit holders PERMIT DEMAND CURVE Distribution of valuation for non-initial permit holders Permit demand and supply before market adjustment to initial allocation

42
Market adjustments to the initial allocation may take time. We would expect transfers for market adjustments to the initial allocation to be relatively high at first and to decline over time. years Initial allocation Number of transfers per year Transfers due to market adjustments to initial allocation

43
After adjustments to the initial allocation is complete, permits will be held by the persons with the highest valuations. Valuation Number of permits Valuations of permit holders Valuations of non-permit holders Permit price Number of persons

44
If all individual permit valuations stayed the same, then after adjustments to initial allocation are complete, there would be no more permit transfers Valuation Number of permits Distribution of valuation for permit holders after adjustments Distribution of valuation for non-permit holders after adjustments Permit demand and supply after market adjustment to initial allocation Price

45
However, individual permit valuations change over time: Random changes in individual circumstances –Accidents and illness –Alternative employment opportunities Demographic changes –Aging and death of permit holders –Entry into work force of younger non-permit holders Changes in environmental, economic, and policy factors –Changes in fish abundance –Changes in fish prices –Changes in fishing costs

46
Different relative changes in individual permit valuation will lead to continuing transfers over time. Valuation Number of permits Old price New price Transfers due to changes in valuations Distribution of valuation for permit holders after changes in valuation Distribution of valuation for non-permit holders after changes in valuation

47
Following market adjustments to the initial allocation transfers will continue due to changes in individual permit valuation. years Year of initial allocation Number of transfers per year Market adjustments to initial allocation Market adjustments to changes in individual permit valuation

48
Net permit transfers between groups will occur for the same reasons as permits transfers among individuals. Causes of transfers Transfers among individuals will occur if: Net transfers among groups will occur if: Adjustments to initial allocation permits are not initially allocated to persons with the highest valuations initial allocation between groups differs from market allocation between groups Changes in individual valuation individuals experience different relative changes in permit valuation groups experience different relative changes in permit valuation

49
Suppose we divide all persons into two groups. We may draw a permit valuation curve for each group. Valuation Number of persons All valuations V1 Group 2 valuations Group 1 valuations V2V

50
If the initial allocation to the two groups differs from the market allocation, net transfers will occur between the two groups. Valuation V1V2V Number of permits M1I1M2I2 Permit price Net transfers from Group 1 to Group 2 Net transfers to Group 2 from Group 1

51
If the two groups experience different relative changes in valuation, further market driven transfers between groups may occur. Valuation V1V2 V NM1 M2 P M1* M2* V2* V* P* An increase in valuation for Group 2 results in further transfers from Group 1 to Group 2

52
Alaska salmon harvests have increased sharply since limited entry began in 1975.

53
Rising salmon prices in the 1980s led to a dramatic increase in harvest values in the years immediately after limited entry was instituted.

54
An economic theory of net permit transfers between “local” and “non-local” Alaska salmon fishermen “Local” permit holders face lower fixed costs of fishing –Lower transportation cots –Lower opportunity costs Prior to limited entry: –Catch values were low –Only persons with positive net benefits at times of low catch values participated and received permits –These were more likely to be local fishermen After limited entry was imposed: –Catch values increased due to higher catches and prices –Net benefits increased relatively more for “non-local” fishermen –Market adjustments led to net transfers from “local” to “non-local” fishermen Following market adjustments to initial allocation net transfers reflect: –Effects of changes in economic conditions in the fisheries –Differences in the rate of change in size of local and non-local permit- holder populations

55
A simple example of the effect of an increase in fishery value following the implementation of limited entry All “local” fishermen face only fixed costs of C L. All “non-local” fishermen face only fixed costs of C N. C N > C L

56
Distribution of annual revenue @ price = $1 Number of Locals Number of Non- Locals Before entry is limited, locals fish if their annual catch > C L ININ ILIL Distribution of annual revenue @ price = $1 CLCL CNCN Before entry is limited, non-locals fish only if their annual catch > C L Initial permit allocations reflect the relative geographic distribution of individuals who could fish profitably in the economic conditions prevailing before entry was limited. Initial permit allocations reflect who fished before entry was limited.

57
Distribution of annual revenue @ price = $2 Number of Locals Number of Non- Locals ININ ILIL Distribution of annual revenue @ price = $2 CLCL CNCN If prices double, the marginal net benefit of fishery participation increases more for non-locals than for locals. Marginal net benefit

58
Once there is a market for permits, the price of permits reflects the marginal economic value of a permit among all potential permit holders. If this is higher for non-local residents, permits will be transferred from locals to non-locals until the marginal economic value is equal for the two groups. Annual revenue Number of Locals Annual revenue Number of Non-Locals ININ ILIL N* N N* L

59
Hypotheses: We would expect to see relatively more net transfers from locals to non-locals: In the years immediately following the enactment of the program In fisheries for which prices increased most rapidly In years when economic conditions in the fishery have been improving From regions where population growth and interest in fishing among young people is low relative to other regions From regions where local permit holders are relatively older than permit holders from other regions

60
Local permit holders have lower average gross incomes than non-local permit holders.

61
Fewer local permit holders stopped fishing when economic conditions declined.

62
In general, fisheries with higher average earnings per permit in 1975 had lower local shares of initial permit allocations

63
In general, the local share of initial permit allocations was lowest for the highest-valued permits by the year for which permit prices are first available (1979)
")
64
In general, changes in permit prices after 1979 were negatively correlated with changes in local permit ownership due to transfers.

65
In general, the fisheries with the highest permit values have continued to have the lowest share of locally-owned permits.

66
Over time, transfers appear to reflect both adjustment to initial allocations and changes in economic conditions.

67
A disturbing paradox: We want fisheries to be profitable! We want fisheries to be fished by local residents (and Alaskans). But the more profitable a fishery is, the more likely permits are to be transferred from local to non-local residents (and non-Alaskans).
. But the more profitable a fishery is, the more likely permits are to be transferred from local to non-local residents (and non-Alaskans)..")
68
Langdon (1980) argued that continued permit loss was likely and was a major problem: “... Does [the] loss of permits by rural Alaskans... represent a serious problem? If it were the case that the rural population had declined in the recent past, if it were the case that an expanding rural population was migrating to urban centers... at a higher rate than the rate of natural increase, if it were the case that employment opportunities in the local regions and on a statewide basis were expanding more rapidly for rural residents than their loss of permits, then one might be able to argue that the decline merely represents natural attrition due to a greater integration of the rural population into the Alaska economy. Since most of these ameliorating conditions do not appear to be taking place, the outflow of permits that has occurred and that potentially can occur must be regarded as a significant threat to the rural Alaskan economic base and the well-being of rural Alaskans.”

69
From a recent paper by UAA Anthropologist Dr. Steve Langdon: Alaska designers were cognizant of some local social and economic factors and sought to avoid serious economic hardship to fishermen and damage to Native Alaskan communities when initially awarding permits. There is, however, no evidence that policy makers gave any thought to the potential dynamics of market transferability of permits or the likely patterns of resulting permit distribution. More serious is the apparent unawareness of the contradictory objectives established by policy makers themselves for limited entry... An implicit objective of Alaskan limited entry, which was nonetheless “openly discussed in the legislative process,” was to create a “professionalized, diversified fleet” which would result from keener competition among fishermen. The lack of congruence between this objective and an objective to sustain “less effective fishermen” in “subsistence-oriented communities” is quite clear. Lack of attention to the structural dynamics of the system and to the contradictory nature of initial program objectives resulted in no contingency planning for the possible deleterious effects of limited entry on Native Alaska fishermen.

70
How can we ensure that local residents (and Alaskans) participate in our fisheries? To keep permit ownership local, we need to create significant advantages local residents in acquiring permits –to offset the larger size of the outside buyer pool –To offset competitive advantages of outside buyers Our ability to do this is limited by: –Political will –Constitutional considerations –Cost

71
ADDITIONAL SLIDES NOT INCORPORATED

72
Suppose there are two groups of permit holders, “local” and “non-local,” which differ systematically with respect to fixed costs of fishing. Non-local compared to local Boat sizeLarger Catch sharehigher Operating costhigher Transport costhigher Opportunity cost of laborhigher Cost of borrowing /lower

73
The relative prices that local and non-local potential sellers (permit holders) would be willing to sell for are affected by many factors: How much they can earn from fishing, which is affected by: –How skilled they are at fishing –How aggressively they fish –What kind of boat they have –What kind of boat investments they can afford –What it costs them to go fishing—including the cost of getting themselves and their crew to Bristol Bay How much they could earn doing something else if they weren’t fishing (their “opportunity cost”) How much they need cash Non-economic factors such as how much they enjoy fishing The extent to which they prefer to transfer permits by gift or inheritance rather than sell
 would be willing to sell for are affected by many factors: How much they can earn from fishing, which is affected by: –How skilled they are at fishing –How aggressively they fish –What kind of boat they have –What kind of boat investments they can afford –What it costs them to go fishing—including the cost of getting themselves and their crew to Bristol Bay How much they could earn doing something else if they weren’t fishing (their opportunity cost ) How much they need cash Non-economic factors such as how much they enjoy fishing The extent to which they prefer to transfer permits by gift or inheritance rather than sell")
74
The relative prices that local and non-local potential buyers would be willing and able to pay for permits are affected by many factors: How much they could earn from fishing, which is affected by: –How skilled they are at fishing –How aggressively they fish –What kind of boat they have –What kind of boat investments they can afford –What it would cost them to go fishing—including the cost of getting themselves and their crew to Bristol Bay How much they could earn doing something else if they weren’t fishing (their “opportunity cost”) Their access to capital –How much they can borrow –What rate they can borrow it at Their potential tax benefits in other fisheries from fishing in Bristol Bay Non-economic factors such as how much they enjoy fishing
 Their access to capital –How much they can borrow –What rate they can borrow it at Their potential tax benefits in other fisheries from fishing in Bristol Bay Non-economic factors such as how much they enjoy fishing")
75
Over time, changes keep happening which affect all of these different factors which affect permit transfers The relative numbers of local and non-local permit holders change The relative numbers of local and non-local potential buyers change The current permit holders get more experienced The current permit holders get older (and some die) Catches—and catches people expect in the future—go up and down Prices—and prices people expect in the future—go up and down Costs—and cost people expect in the future—go up and down Opportunities in other fisheries get better or worse All these changes may affect local and non-local potential sellers differently All these changes may affect local and non-local potential buyers differently
 Catches—and catches people expect in the future—go up and down Prices—and prices people expect in the future—go up and down Costs—and cost people expect in the future—go up and down Opportunities in other fisheries get better or worse All these changes may affect local and non-local potential sellers differently All these changes may affect local and non-local potential buyers differently")
76
SIMULATION MODEL

77
EMPIRICAL MODEL

78
Alaska’s limited entry salmon fisheries provide an extremely rich source of data for analysis of permit transfers 26 limited entry salmon fisheries More than 10,000 limited entry permits More than 30 years of data for each permit (since late 1970s) Publicly available data for holder of each permit over time: –Names and permanent codes for individuals –Permit holder addresses –Linked to vessel data base (vessel name, permanent vessel ID, vessel characteristics such as length, engine type, horsepower, gear) Other data publically available for aggregated groups: –Fishery participation –Catches and earnings –Permit prices Additional non-publically available data held by CFEC potentially available for future analysis –All fish deliveries (date, volume, estimated value)
 Publicly available data for holder of each permit over time: –Names and permanent codes for individuals –Permit holder addresses –Linked to vessel data base (vessel name, permanent vessel ID, vessel characteristics such as length, engine type, horsepower, gear) Other data publically available for aggregated groups: –Fishery participation –Catches and earnings –Permit prices Additional non-publically available data held by CFEC potentially available for future analysis –All fish deliveries (date, volume, estimated value)")
79
Tentative research conclusion (but more research is needed) The more profitable a fishery is, the more likely permits are to be transferred from local to non-local residents (and non-Alaskans).
 The more profitable a fishery is, the more likely permits are to be transferred from local to non-local residents (and non-Alaskans).")
80
Changes which make the fishery more profitable or which favor people who are able to invest more in the fishery tend to increase the probability that permits will be sold from locals to non-locals. As the fishery becomes more profitable: –travel costs are less of a disadvantage for non-locals –Other fishing and work opportunities for non-locals are relatively less attractive –Permits and boats become more expensive, favoring non-locals who can borrow more money more easily Non-locals are more likely to be able to invest more in the fishery because: –They have more assets they can use as collateral –They are more likely to have friends or relatives who can loan them money –It is easier for them to do business with banks

81
POLICY ISSUES

Similar presentations


