Download presentation
Presentation is loading. Please wait.

1
Waste Reduction Improve the Environment and Reduce Costs

2
Climate Change – Why worry? Climate relatively stable for the last 10,000 years The average sea level around the UK is now about 10cm higher than it was in 1900. Source: Cox et al. [2000]

3
Climate Change – Thermohaline Circulation (THC) Heat from the equator is dispersed Stream turned off 13,000 years ago Source: Hadley Centre Recent research indicates a 30% reduction in the current
 Heat from the equator is dispersed Stream turned off 13,000 years ago Source: Hadley Centre Recent research indicates a 30% reduction in the current")
4
Climate Change – Thermohaline Circulation Source: Source: Hadley Centre

5
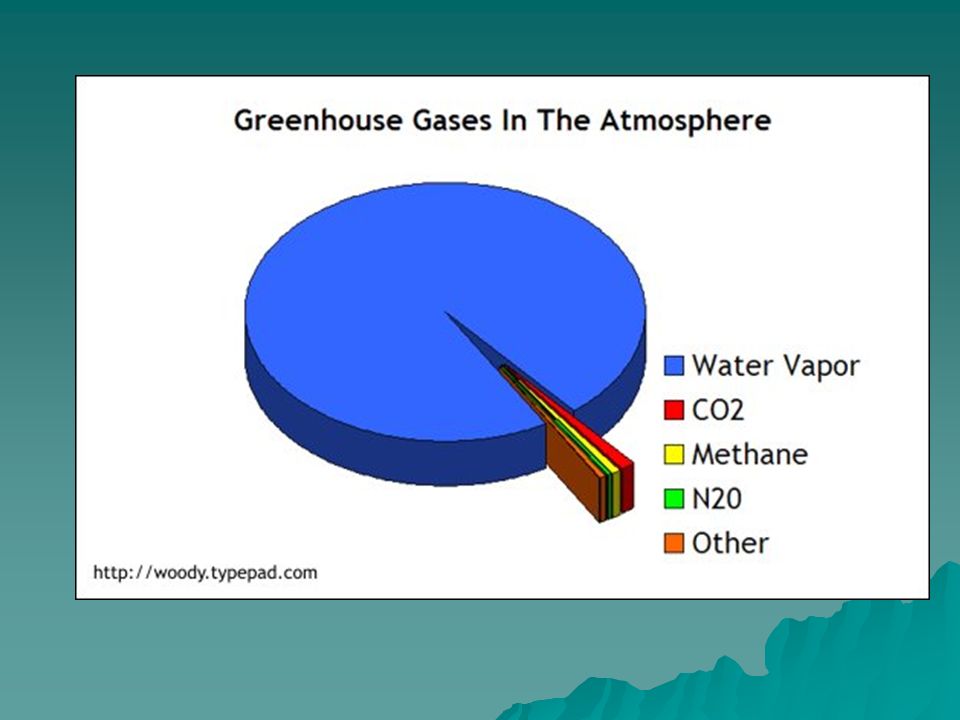
Climate Change – Why worry? Source: Hadley Centre 1.5 °C could cause –Greenland ice sheet – 3 Million Km 3 –7m rise in sea levels –10,000 billions of metric tons of methane hydrates to destabilise

10
Government action- Environmental impact –Landfill waste reduction –Product life cycle –Emissions reduction –Energy use reduction

11
Economic climate change Competition for energy Rising fuel prices Increased pressure to comply with legislation Increased need to cut overheads and production costs

12
Reduce Waste Cost for manufacturers –For every tonne of household waste produced, commercial, industrial and construction businesses produce another six tonnes –5 million tonnes of hazardous waste in England and Wales every year –Manufacturers could save around 1% of turnover through simple, yet effective, techniques to minimise waste Source: Defra

13
Increase Energy Efficiency SMEs are wasting as much as 30 % of their energy, equal to £1.1 billion or an average of £7,000 per business –Motors are the biggest energy wasters »Use a variable speed drive » A 50 % reduction in speed = 87.5 % reduction in energy consumption »This could mean payback time of less than one year

14
–Lighting Energy saving bulbs Turn unused lights off –Heating Air conditioning can double your energy bills –Buy energy efficient equipment and maintain it Compressors can often be wasting £30 in every £100 –Reduce use of materials, packaging –Reduce transport costs by sourcing locally Increase Energy Efficiency

15
Energy Units MultipleNameSymbolMultipl e NameSymbol 10 0 watt-hourW·h 10 3 kilowatt-hourkW·h10 –3 milliwatt-hourmW·h 10 6 megawatt-hourMW·h10 –6 microwatt-hourµW·h 10 9 gigawatt-hourGW·h10 –9 nanowatt-hournW·h 10 12 terawatt-hourTW·h10 –12 picowatt-hourpW·h 10 15 petawatt-hourPW·h10 –15 femtowatt-hourfW·h 10 18 exawatt-hourEW·h10 –18 attowatt-houraW·h 10 21 zettawatt-hourZW·h10 –21 zeptowatt-hourzW·h 10 24 yottawatt-hourYW·h10 –24 yoctowatt-houryW·h

16
Food Miles a term which refers to the distance food travels from the time of its production until it reaches the consumer or end- user. It is one dimension used in assessing the environmental impact of food. is part of a broader issue of sustainability which deals with a large range of issues, including local food the direct environmental, social and economic costs of food transport are over £9 billion each year

17
How Food Travels Recent findings indicate that it is not only how far the food has traveled but how it has traveled that is important to consider. The positive environmental effects of specialist organic farming may be offset by increased transportation, unless it is produced by local farms. organic farming organic farming But even then the logistics and effects on other local traffic may play a big role. traffic Also, many trips by personal cars to external shopping centres would have a negative environmental impact compared to a few truck loads to neighborhood stores that can be easily accessed by walking or cycling. shopping centreswalkingcycling shopping centreswalkingcycling A locavore endeavors to eat food from within a foodshed having a radius of 100 miles. locavore foodshedradiusmileslocavore foodshedradiusmiles

18
Criticism of food miles A comparison total energy used in food production in Europe and New Zealand, taking into account energy used to ship the food to Europe for consumers. Europe New Zealand agriculture tends to apply less fertilisers (which require large amounts of energy to produce and cause significant CO2 emissions) agriculture fertilisersCO2 emissionsagriculture fertilisersCO2 emissions and animals are able to graze year round outside eating grass instead of large quantities of brought-in feed such as concentrates. grazefeedconcentratesgrazefeedconcentrates Dairy is twice as efficient, Sheepmeat four times as efficient Sheepmeat Apples: NZ is more energy efficient pples
 agriculture fertilisersCO2 emissionsagriculture fertilisersCO2 emissions and animals are able to graze year round outside eating grass instead of large quantities of brought-in feed such as concentrates. grazefeedconcentratesgrazefeedconcentrates Dairy is twice as efficient, Sheepmeat four times as efficient Sheepmeat Apples: NZ is more energy efficient pples.")
19
Reduce transport costs by sourcing locally Food Miles Companies with under 100 tons of fruit per year have an overall energy turnover of 1.1 to 2.5 kWh/litre while companies with more than 2,000 tons per year have less than 0.5 kWh/l. Just in terms of transport and distribution, small fruit companies need 0.5-0.8 kWh/l while even though they are covering large distances, the large companies use only 0.1-0.3 kWh/l.

20
Comparative shipping Cost

21
Unit Operations

22
Equipment

23
Continuous operations UHT

24
Concentration of Liquids

25
Refrigeration Reveres Cycle Heating

26
Fermentation of Waste Cofermentation –Using food industry waste combined with waste from other sources such as sewage.

Similar presentations