Download presentation
Presentation is loading. Please wait.

1
Intelligent Use of LAPS By Ed Szoke and Steve Albers 16 December 1999

2
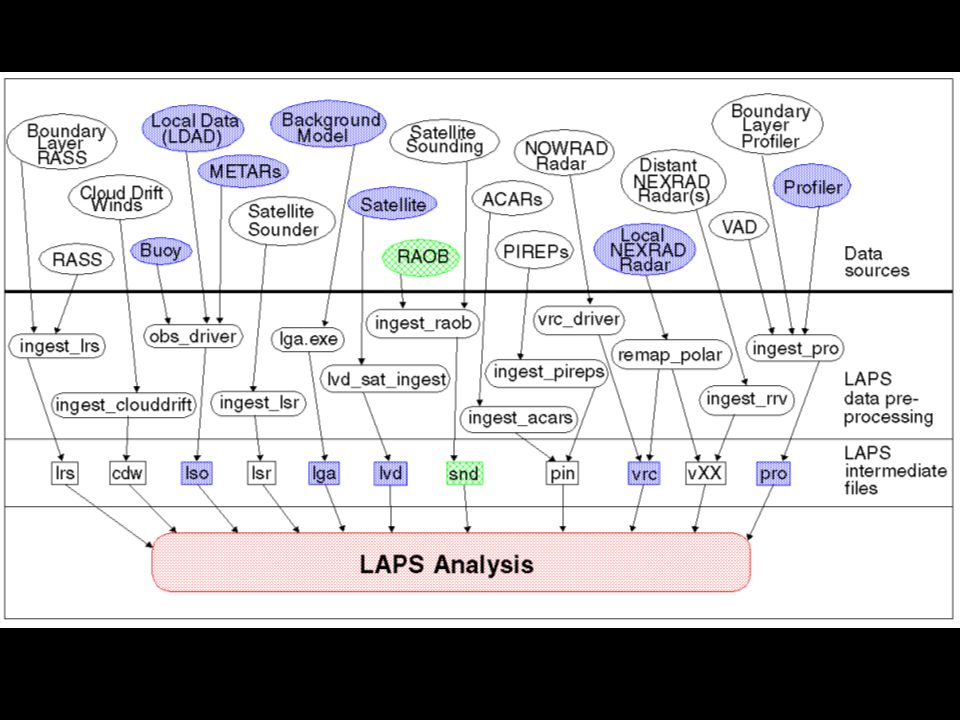
LAPS A system designed to: Exploit all available data sources Create analyzed and forecast grids Build products for specific forecast applications Use advanced display technology …All within the local weather office

3
Why do analysis in the local office?

4
“THE CONCEPT OF THE LOCAL DATA BASE IS CENTRAL TO FUTURE OPERATIONS…THE MOST COMPLETE DATA SETS WILL ONLY BE AVAILABLE TO THE LOCAL WFO. THE NEW OBSERVING SYSTEMS ARE DESIGNED TO PROVIDE INTEGRATED 3-D DEPICTIONS OF THE RAPIDLY CHANGING STATE OF THE ENVIRONMENT.” -Strategic plan for the modernization and associated restructuring of the National Weather Service

7
Data Acquisition and Quality Control

8
Local Data Local Data may be defined as that data not entering into the National Database Sources –Highway Departments Many States with full or partial networks –Agricultural Networks State run, sometimes private –Universities Experimental observations –Private Industry Environmental monitoring

10
Problems with Local Data Poor Maintenance Poor Communications Poor Calibration Result ---------------->Inaccurate, Irregular, Observations

11
Quality Control Methods Gross Error Checks Rough Climatological Estimates Statistical Models Buddy Checking Dynamical Models Use of meso-beta models

12
Requirements for QC Scheme Runnable in weather offices on small workstations Adaptable to ongoing model improvement Adaptable to daily variations in model skill

13
SOLUTION: The KALMAN FILTER Adaptable to small workstations Accommodates models of varying complexity Model error is a dynamic quantity within the filter, thus the scheme adjusts as model skill varies Requirements for QC Scheme (cont.)
")
15
LAPS Overview LAPS Grid –Horizontal Resolution = 10 km –Vertical Resolution = 50 mb –Size: 61 x 61 x 21

16
LAPS Analysis Software Analysis package has been in each version of WFO-Advanced delivered to PRC and NWS LAPS in current build (AWIPS 4.2) is primitive Awaiting requirements for build 5.0, such as resizeability, relocatability, advanced quality control techniques, etc.
 is primitive Awaiting requirements for build 5.0, such as resizeability, relocatability, advanced quality control techniques, etc.")
17
Sources of LAPS Information The LAPS homepage http://laps.fsl.noaa.gov provides access to many links including: What is in AWIPS LAPS? http://laps.fsl.noaa.gov/LAPS/AWIPS_WFO_page.htm

18
Initially (Version 4.0) NOT MUCH! AWIPS SURFACE SATELLITE RADAR SOUNDING PROFILER BACKGROUND MODEL 4.1 METARS 8bit IR Only None Inactive Network RUC (Can use Eta) 4.2 LDAD** Same Low-level Inactive Network RUC (Can use Eta) Z, Level 3 RPG, No V Full All Derived Mulitple RAOBS RASS Other Models LAPS Soundings Radars Boundary 10bit IR All levels Layer & VIS Z and V Profilers ** if Available
 4.2 LDAD** Same Low-level Inactive Network RUC (Can use Eta) Z, Level 3 RPG, No V Full All Derived Mulitple RAOBS RASS Other Models LAPS Soundings Radars Boundary 10bit IR All levels Layer & VIS Z and V Profilers ** if Available.")
20
Quote from the Field "...for the hourly LAPS soundings, you can go to interactive skew-T, and loop the editable soundings from one hour to the next, and get a more accurate idea of how various parameters are changing on an hourly basis...nice. We continue to find considerable use of the LAPS data (including soundings) for short-term convective forecasting."
 for short-term convective forecasting. .")
21
There are 3 main components 1) Temperature ( http://laps.fsl.noaa.gov/albers/laps/talks/temp/sld001.htm) 2) Moisture (http://laps.fsl.noaa.gov/albers/laps/talks/cloud/sld001.htm) 3) Wind ( http://laps.fsl.noaa.gov/albers/laps/talks/wind/sld001.htm) See Steve Albers discussion at: http://laps.fsl.noaa.gov/presentations/presentations.html The Component of LAPS
 Temperature ( 2) Moisture ( 3) Wind ( See Steve Albers discussion at: The Component of LAPS")
22
3D Temperature Interpolate from model (RUC) Insert sonde and RASS if available –normally radius of influence not used unless more than one sounding Insert surface temperature and blend upward –depending on stability and elevation Surface temperature analysis depends on –METARS and LDAD –Gradients adjusted by IR temperature
 Insert sonde and RASS if available –normally radius of influence not used unless more than one sounding Insert surface temperature and blend upward –depending on stability and elevation Surface temperature analysis depends on –METARS and LDAD –Gradients adjusted by IR temperature")
23
3D Moisture Preliminary analysis from vertical “soundings” derived from METARS and PIREPS IR used to determine cloud top (using temperature field) Radar data inserted (3-D if available) Visible satellite used
 Radar data inserted (3-D if available) Visible satellite used")
28
Products Derived from Wind Analysis

29
Case Study Example An example of the use of LAPS in convective event 13-14 May 1999 Location: DEN-BOU WFO

30
Case Study Example (cont.) Late on the 13th we see moisture returning in far eastern CO on “screaming” southerly flow. A Severe Thunderstorm Watch was issued at 4 PM (2200 UTC) for portions of northeast CO and nearby areas. Note the change in the moisture near LBF
 for portions of northeast CO and nearby areas. Note the change in the moisture near LBF.")
31
LAPS surface CAPE with CIN and METARS

32
LAPS sounding near LBF 2300 UTC

33
LAPS sounding near LBF 0000 UTC

34
LAPS sounding near LBF 0100 UTC

35
Case Study Example (cont.) On the next day, 14 May the moisture is in place. A line of storms develops along the foothills around noon LT (1800 UTC) and moves east. LAPS used to diagnose potential for severe development. A Tornado Watch issued by ~1900 UTC for portions of eastern CO and nearby areas. A brief tornado did form in far eastern CO west of GLD around 0000 UTC the 15th. Other tornadoes occurred later near GLD.
 and moves east. LAPS used to diagnose potential for severe development. A Tornado Watch issued by ~1900 UTC for portions of eastern CO and nearby areas. A brief tornado did form in far eastern CO west of GLD around 0000 UTC the 15th. Other tornadoes occurred later near GLD..")
36
NOWRAD and METARS with LAPS surface CAPE 2100 UTC

37
NOWRAD and METARS with LAPS surface CIN 2100 UTC

38
Dewpoint max appears near CAPE max, but between METARS 2100 UTC

39
Examine soundings near CAPE max at points B, E and F 2100 UTC

40
Soundings near CAPE max at B, E and F 2100 UTC

41
RUC also has dewpoint max near point E 2100 UTC

42
LAPS & RUC sounding comparison at point E (CAPE Max) 2100 UTC
 2100 UTC")
43
CAPE Maximum persists in same area 2200 UTC

44
CIN minimum in area of CAPE max 2200 UTC

45
Point E, CAPE has increased to 2674 J/kg 2200 UTC

46
Convergence and Equivalent Potential Temperature are co-located 2100 UTC

47
How does LAPS sfc divergence compare to that of the RUC? Similar over the plains. 2100 UTC

48
LAPS winds every 10 km, RUC winds every 80 km 2100 UTC

49
Case Study Example (cont.) The next images show a series of LAPS soundings from near LBF illustrating some dramatic changes in the moisture aloft. Why does this occur?

50
LAPS sounding near LBF 1600 UTC

51
LAPS sounding near LBF 1700 UTC

52
LAPS sounding near LBF 1800 UTC

53
LAPS sounding near LBF 2100 UTC

54
Case Study Example (cont.) Now we will examine some LAPS cross-sections to investigate the changes in moisture, interspersed with a sequence of satellite images showing the location of the cross-section, C-C` (from WSW to ENE across DEN)
 Now we will examine some LAPS cross-sections to investigate the changes in moisture, interspersed with a sequence of satellite images showing the location of the cross-section, C-C` (from WSW to ENE across DEN)")
55
Visible image with LAPS 700 mb temp and wind and METARS 1500 UTC Note the strong thermal gradient aloft from NW-S (snowing in southern WY) and the LL moisture gradient across eastern CO.
 and the LL moisture gradient across eastern CO.")
56
LAPS Analysis at 1500 UTC, Generated with Volume Browser

57
Visible image 1600 UTC

58
Visible image 1700 UTC

59
LAPS cross- section 1700 UTC

60
LAPS cross- section 1800 UTC

61
LAPS cross- section 1900 UTC

62
Case Study Example (cont.) The cross-sections show some fairly substantial changes in mid-level RH. Some of this is related to LAPS diagnosis of clouds, but the other changes must be caused by the satellite moisture analysis between cloudy areas. It is not clear how believable some of these are in this case.

63
Case Study Example (cont.) Another field that can be monitored with LAPS is helicity. A description of LAPS helicity is at http://laps.fsl.noaa.gov/frd/laps/LAPB/AWIPS_WFO_page.htm A storm motion is derived from the mean wind (sfc-300 mb) with an off mean wind motion determined by a vector addition of 0.15 x Shear vector, set to perpendicular to the mean storm motion Next we’ll examine some helicity images for this case. Combining CAPE and minimum CIN with helicity agreed with the path of the supercell storm that produced the CO tornado.
 with an off mean wind motion determined by a vector addition of 0.15 x Shear vector, set to perpendicular to the mean storm motion Next we’ll examine some helicity images for this case. Combining CAPE and minimum CIN with helicity agreed with the path of the supercell storm that produced the CO tornado..")
64
NOWRAD with METARS and LAPS surface helicity 1900 UTC

65
NOWRAD with METARS and LAPS surface helicity 2000 UTC

66
NOWRAD with METARS and LAPS surface helicity 2100 UTC

67
NOWRAD with METARS and LAPS surface helicity 2200 UTC

68
NOWRAD with METARS and LAPS surface helicity 2300 UTC

69
Case Study Example (cont.) Now we’ll show some other LAPS fields that might be useful (and some that might not…)
 Now we’ll show some other LAPS fields that might be useful (and some that might not…)")
70
Divergence compares favorably with the RUC

71
The omega field has considerable detail (which is highly influenced by topography

72
LAPS Topography

73
Vorticity is a smooth field in LAPS

74
Comparison with the Eta does show some differences. Are they real?

75
Stay Away from DivQ at 10 km

76
Why Run Models in the Weather Office? Diagnose local weather features to enhance conceptual models –sea/mountain breezes –modulation of synoptic scale features Take advantage of high resolution terrain data to downscale national model forecasts –orography is a data source!

77
Take advantage of unique local data –radar –surface mesonets Have an NWP tool under local control for scheduled and special support Take advantage of powerful/cheap computers Why Run Models in the Weather Office? (cont.)
.")
78
Much of what LAPS generates makes it ideal for initializing a local scale model- even if some of the products may not be particularly useful in the WFO (like the cloud analysis, etc.) LAPS Philosophy
 LAPS Philosophy")
79
Modeling Approaches Diagnostic Mode Basic Operational “Downscaling” Mode Data Assimilation and Forecast Mode

84
SFM forecast showing details of the orographic precipitation, as well as capturing the Longmont anticyclone flow on the plains

85
You can see more about our local modeling efforts at http://laps.fsl.noaa.gov/szoke/lapsreview/start.html What else in the future? (besides hopefully a more complete input data stream to AWIPS LAPS...) Learn more about a different kind of visualization, D3D, at http://laps.fsl.noaa.gov/d3d/ams99/rtII/start.html LAPS Summary
 Learn more about a different kind of visualization, D3D, at LAPS Summary.")
86
D3D Example

87
Example of Powerful Sounding Tool in D3D

Similar presentations