Download presentation
Presentation is loading. Please wait.

1
Biochemistry Lecture 12

2
Glycolysis and Catabolism
Glycolysis is a sequence of enzyme-catalyzed reaction by which glucose is converted into pyruvate Pyruvate can be further aerobically oxidized Pyruvate can be used as a precursor in biosynthesis

3
Central Importance of Glucose
Glucose is an excellent fuel Yields good amount of energy upon oxidation(-2840 kJ/mole) Can be efficiently stored in the polymeric form Many organisms and tissues can meet their energy needs on glucose only Glucose is a versatile biochemical precursor Bacteria can use glucose to build the carbon skeletons of: All the amino acids Membrane lipids Nucleotides in DNA and RNA Cofactors needed for the metabolism
 Can be efficiently stored in the polymeric form. Many organisms and tissues can meet their energy needs on glucose only. Glucose is a versatile biochemical precursor. Bacteria can use glucose to build the carbon skeletons of: All the amino acids. Membrane lipids. Nucleotides in DNA and RNA. Cofactors needed for the metabolism.")
4
FIGURE 14-1 Major pathways of glucose utilization
FIGURE 14-1 Major pathways of glucose utilization. Although not the only possible fates for glucose, these four pathways are the most significant in terms of the amount of glucose that flows through them in most cells.

5
Chapter 12, Figure 12.1, Catabolic and anabolic processes in anaerobic carbohydrate metabolism

6
Chapter 12, Figure 12.2, The two phases of glycolysis and the products of glycolysis

7
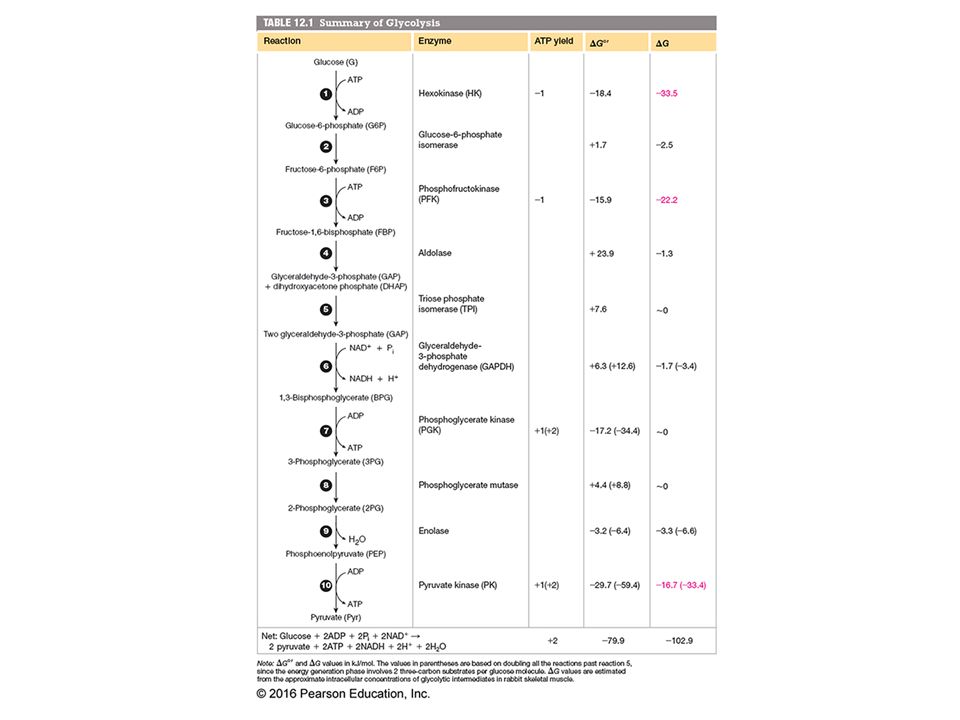
Chapter 12, Figure 12.4, An overview of glycolysis

8
FIGURE 14-2a The two phases of glycolysis
FIGURE 14-2a The two phases of glycolysis. For each molecule of glucose that passes through the preparatory phase (a), two molecules of glyceraldehyde 3-phosphate are formed; both pass through the payoff phase (b). Pyruvate is the end product of the second phase of glycolysis. For each glucose molecule, two ATP are consumed in the preparatory phase and four ATP are produced in the payoff phase, giving a net yield of two ATP per molecule of glucose converted to pyruvate. The numbered reaction steps are catalyzed by the enzymes listed on the right, and also correspond to the numbered headings in the text discussion. Keep in mind that each phosphoryl group, represented here as P, has two negative charges (—PO32–).
, two molecules of glyceraldehyde 3-phosphate are formed; both pass through the payoff phase (b). Pyruvate is the end product of the second phase of glycolysis. For each glucose molecule, two ATP are consumed in the preparatory phase and four ATP are produced in the payoff phase, giving a net yield of two ATP per molecule of glucose converted to pyruvate. The numbered reaction steps are catalyzed by the enzymes listed on the right, and also correspond to the numbered headings in the text discussion. Keep in mind that each phosphoryl group, represented here as P, has two negative charges (—PO32–).")
9
FIGURE 14-2b The two phases of glycolysis
FIGURE 14-2b The two phases of glycolysis. For each molecule of glucose that passes through the preparatory phase (a), two molecules of glyceraldehyde 3-phosphate are formed; both pass through the payoff phase (b). Pyruvate is the end product of the second phase of glycolysis. For each glucose molecule, two ATP are consumed in the preparatory phase and four ATP are produced in the payoff phase, giving a net yield of two ATP per molecule of glucose converted to pyruvate. The numbered reaction steps are catalyzed by the enzymes listed on the right, and also correspond to the numbered headings in the text discussion. Keep in mind that each phosphoryl group, represented here as P, has two negative charges (—PO32–).
, two molecules of glyceraldehyde 3-phosphate are formed; both pass through the payoff phase (b). Pyruvate is the end product of the second phase of glycolysis. For each glucose molecule, two ATP are consumed in the preparatory phase and four ATP are produced in the payoff phase, giving a net yield of two ATP per molecule of glucose converted to pyruvate. The numbered reaction steps are catalyzed by the enzymes listed on the right, and also correspond to the numbered headings in the text discussion. Keep in mind that each phosphoryl group, represented here as P, has two negative charges (—PO32–).")
10
Chapter 12, Unnumbered Figure, Page 373

11
Chapter 12, Unnumbered Figure, Page 375

12
Phosphohexose Isomerase Mechanism
FIGURE 14-4 The phosphohexose isomerase reaction. The ring opening and closing reactions (steps 1 and 4) are catalyzed by an active-site His residue, by mechanisms omitted here for simplicity. The proton (pink) initially at C-2 is made more easily abstractable by electron withdrawal by the adjacent carbonyl and nearby hydroxyl group. After its transfer from C-2 to the active-site Glu residue (a weak acid), the proton is freely exchanged with the surrounding solution; that is, the proton abstracted from C-2 in step 2 is not necessarily the same one that is added to C-1 in step 3.
 are catalyzed by an active-site His residue, by mechanisms omitted here for simplicity. The proton (pink) initially at C-2 is made more easily abstractable by electron withdrawal by the adjacent carbonyl and nearby hydroxyl group. After its transfer from C-2 to the active-site Glu residue (a weak acid), the proton is freely exchanged with the surrounding solution; that is, the proton abstracted from C-2 in step 2 is not necessarily the same one that is added to C-1 in step 3.")
13
Chapter 12, Unnumbered Figure, Page 375

14
Chapter 12, Unnumbered Figure, Page 375

15
Aldolase Mechanism FIGURE 14-5 The class I aldolase reaction. The reaction shown here is the reverse of an aldol condensation. Note that cleavage between C-3 and C-4 depends on the presence of the carbonyl group at C-2. A and B represent amino acid residues that serve as general acid (A) or base (B).
 or base (B).")
16
Chapter 12, Unnumbered Figure, Page 376

17
Chapter 12, Figure 12.4, An overview of glycolysis

18
Chapter 12, Unnumbered Figure, Page 377

19
FIGURE 14-7 The glyceraldehyde 3-phosphate dehydrogenase reaction.

20
Chapter 12, Unnumbered Figure, Page 378

21
Chapter 12, Unnumbered Figure, Page 378

22
Chapter 12, Unnumbered Figure, Page 379

23
Chapter 12, Unnumbered Figure, Page 380

25
How does food enter this process?
FIGURE Entry of dietary glycogen, starch, disaccharides, and hexoses into the preparatory stage of glycolysis.

26
Anaerobic Exercise

27
“Anaerobic Exercise” in Yeast

29
Gluconeogenesis FIGURE Carbohydrate synthesis from simple precursors. The pathway from phosphoenolpyruvate to glucose 6-phosphate is common to the biosynthetic conversion of many different precursors of carbohydrates in animals and plants. The path from pyruvate to phosphoenolpyruvate leads through oxaloacetate, an intermediate of the citric acid cycle, which we discuss in Chapter 16. Any compound that can be converted to either pyruvate or oxaloacetate can therefore serve as starting material for gluconeogenesis. This includes alanine and aspartate, which are convertible to pyruvate and oxaloacetate, respectively, and other amino acids that can also yield three- or four-carbon fragments, the so-called glucogenic amino acids (Table 14-4; see also Figure 18-15). Plants and photosynthetic bacteria are uniquely able to convert CO2 to carbohydrates, using the glyoxylate cycle (p. 639). 29
. Plants and photosynthetic bacteria are uniquely able to convert CO2 to carbohydrates, using the glyoxylate cycle (p. 639). 29.")
30
Chapter 12, Figure 12.10, Reactions of glycolysis and gluconeogenesis

31
Gluconeogenesis -Metabolic Pathways are Irreversible
∆G between the 1st & last metabolite is large & neg. - If 2 metabolites are interconvertible (metab metab 2), the path from Metab 1 Metab 2 must be different from that of Metab 2 Metab 1 A B Metab1 Metab2 Y X
, the path from Metab 1 Metab 2 must be different from that of Metab 2 Metab 1. A. B. Metab1. Metab2. Y. X.")
32
Chapter 12, Figure 12.8, Energy profile of anaerobic glycolysis

33
FIGURE (part 2) Opposing pathways of glycolysis and gluconeogenesis in rat liver. The reactions of glycolysis are on the left side, in red; the opposing pathway of gluconeogenesis is on the right, in blue. The major sites of regulation of gluconeogenesis shown here are discussed later in this chapter, and in detail in Chapter 15. Figure illustrates an alternative route for oxaloacetate produced in mitochondria. 33

34
Chapter 12, Figure 12.11, Compartmentation of bypass 1

35
FIGURE 14-17a Synthesis of phosphoenolpyruvate from pyruvate
FIGURE 14-17a Synthesis of phosphoenolpyruvate from pyruvate. (a) In mitochondria, pyruvate is converted to oxaloacetate in a biotin-requiring reaction catalyzed by pyruvate carboxylase. 35
 In mitochondria, pyruvate is converted to oxaloacetate in a biotin-requiring reaction catalyzed by pyruvate carboxylase. 35.")
36
FIGURE 14-17b Synthesis of phosphoenolpyruvate from pyruvate
FIGURE 14-17b Synthesis of phosphoenolpyruvate from pyruvate. (b) In the cytosol, oxaloacetate is converted to phosphoenolpyruvate by PEP carboxykinase. The CO2 incorporated in the pyruvate carboxylase reaction is lost here as CO2. The decarboxylation leads to a rearrangement of electrons that facilitates attack of the carbonyl oxygen of the pyruvate moiety on the γ phosphate of GTP. 36
 In the cytosol, oxaloacetate is converted to phosphoenolpyruvate by PEP carboxykinase. The CO2 incorporated in the pyruvate carboxylase reaction is lost here as CO2. The decarboxylation leads to a rearrangement of electrons that facilitates attack of the carbonyl oxygen of the pyruvate moiety on the γ phosphate of GTP. 36.")
37
FIGURE (part 1) Opposing pathways of glycolysis and gluconeogenesis in rat liver. The reactions of glycolysis are on the left side, in red; the opposing pathway of gluconeogenesis is on the right, in blue. The major sites of regulation of gluconeogenesis shown here are discussed later in this chapter, and in detail in Chapter 15. Figure illustrates an alternative route for oxaloacetate produced in mitochondria. 37

38
B. Circumventing PFK – dephosphorylation of F1,6BP
Dephosphorylation is not phosphorylation in reverse! Reverse Phosphorylation of ADP by F1,6 BP to generate F6P (and ATP) would be steeply uphill: F1,6 BP + ADP F6P + ATP ∆G° = +3.4 kcal/mol Instead, dephosphorylation is carried out: F1,6 BP + H2O F6P + PO ∆G° = -3.9 kcal/mol Reverse Phosphorylation would be mediated by PFK Dephosphorylation is mediated by F1,6BPase
 would be steeply uphill: F1,6 BP + ADP F6P + ATP ∆G° = +3.4 kcal/mol. Instead, dephosphorylation is carried out: F1,6 BP + H2O F6P + PO4 ∆G° = -3.9 kcal/mol. Reverse Phosphorylation would be mediated by PFK. Dephosphorylation is mediated by F1,6BPase.")
39
C. Circumventing Hexokinase – dephosphorylation of G6P
Mediated by G6Pase G6Pase is present only in liver and kidney Hence, these are the only tissues that can synthesize and secrete glucose into the blood

40
The Gluconeogenic Response is Activated Largely by the State of Feeding/Fasting
Glycogen Blood Glucose Blood Glucose Glucose Blood Glucose Pyruvate Alanine Acetyl CoA FA’s

41
FIGURE 14-19 Alternative paths from pyruvate to phosphoenolpyruvate
FIGURE Alternative paths from pyruvate to phosphoenolpyruvate. The relative importance of the two pathways depends on the availability of lactate or pyruvate and the cytosolic requirements for NADH for gluconeogenesis. The path on the right predominates when lactate is the precursor, because cytosolic NADH is generated in the lactate dehydrogenase reaction and does not have to be shuttled out of the mitochondrion (see text). 41
. 41.")
42
The Cory Cycle FIGURE Metabolic cooperation between skeletal muscle and the liver: the Cori cycle. Extremely active muscles use glycogen as energy source, generating lactate via glycolysis. During recovery, some of this lactate is transported to the liver and converted to glucose via gluconeogenesis. This glucose is released to the blood and returned to the muscles to replenish their glycogen stores. The overall pathway (glucose → lactate → glucose) constitutes the Cori cycle. 42
 constitutes the Cori cycle. 42.")
43
Chapter 12, Figure 12.14, Major control mechanisms affecting glycolysis and gluconeogenesis

44
Chapter 12, Figure 12.12, The Cori cycle

45
FIGURE Opposing pathways of glycolysis and gluconeogenesis in rat liver. The reactions of glycolysis are on the left side, in red; the opposing pathway of gluconeogenesis is on the right, in blue. The major sites of regulation of gluconeogenesis shown here are discussed later in this chapter, and in detail in Chapter 15. Figure illustrates an alternative route for oxaloacetate produced in mitochondria. 45

46
FIGURE 15-7 Dependence of glycolytic flux in a rat liver homogenate on added enzymes. Purified enzymes in the amounts shown on the x axis were added to an extract of liver carrying out glycolysis in vitro. The increase in flux through the pathway is shown on the y axis.

47
Hexokinase Isozymes are different enzymes that catalyze the same reaction They typically share similar sequences Their regulation is often different

48
eg. G6P is structurally similar to glucose, and competes with glucose for active site of hexokinase

49
FIGURE Opposing pathways of glycolysis and gluconeogenesis in rat liver. The reactions of glycolysis are on the left side, in red; the opposing pathway of gluconeogenesis is on the right, in blue. The major sites of regulation of gluconeogenesis shown here are discussed later in this chapter, and in detail in Chapter 15. Figure illustrates an alternative route for oxaloacetate produced in mitochondria. 49

50
FIGURE Regulation of fructose 1,6-bisphosphatase (FBPase-1) and phosphofructokinase-1 (PFK-1). The important role of fructose 2,6-bisphosphate in the regulation of this substrate cycle is detailed in subsequent figures.

51
PFK Allosteric site AMP F6P ATP Active site

52
Fructose-2,6-bisphosphate

53
FIGURE 15-16c Role of fructose 2,6-bisphosphate in regulation of glycolysis and gluconeogenesis. Fructose 2,6-bisphosphate (F26BP) has opposite effects on the enzymatic activities of phosphofructokinase-1 (PFK-1, a glycolytic enzyme) and fructose 1,6-bisphosphatase (FBPase-1, a gluconeogenic enzyme). (c) Summary of regulation by F26BP.
 has opposite effects on the enzymatic activities of phosphofructokinase-1 (PFK-1, a glycolytic enzyme) and fructose 1,6-bisphosphatase (FBPase-1, a gluconeogenic enzyme). (c) Summary of regulation by F26BP..")
54
FIGURE 15-17b Regulation of fructose 2,6-bisphosphate level
FIGURE 15-17b Regulation of fructose 2,6-bisphosphate level. (b) Both enzyme activities are part of the same polypeptide chain, and they are reciprocally regulated by insulin and glucagon.
 Both enzyme activities are part of the same polypeptide chain, and they are reciprocally regulated by insulin and glucagon.")
55
FIGURE Opposing pathways of glycolysis and gluconeogenesis in rat liver. The reactions of glycolysis are on the left side, in red; the opposing pathway of gluconeogenesis is on the right, in blue. The major sites of regulation of gluconeogenesis shown here are discussed later in this chapter, and in detail in Chapter 15. Figure illustrates an alternative route for oxaloacetate produced in mitochondria. 55

56
FIGURE 15-19 Regulation of pyruvate kinase
FIGURE Regulation of pyruvate kinase. The enzyme is allosterically inhibited by ATP, acetyl-CoA, and long-chain fatty acids (all signs of an abundant energy supply), and the accumulation of fructose 1,6-bisphosphate triggers its activation. Accumulation of alanine, which can be synthesized from pyruvate in one step, allosterically inhibits pyruvate kinase, slowing the production of pyruvate by glycolysis. The liver isozyme (L form) is also regulated hormonally. Glucagon activates cAMP-dependent protein kinase (PKA; see Figure 15-35), which phosphorylates the pyruvate kinase L isozyme, inactivating it. When the glucagon level drops, a protein phosphatase (PP) dephosphorylates pyruvate kinase, activating it. This mechanism prevents the liver from consuming glucose by glycolysis when blood glucose is low; instead, the liver exports glucose. The muscle isozyme (M form) is not affected by this phosphorylation mechanism.
, and the accumulation of fructose 1,6-bisphosphate triggers its activation. Accumulation of alanine, which can be synthesized from pyruvate in one step, allosterically inhibits pyruvate kinase, slowing the production of pyruvate by glycolysis. The liver isozyme (L form) is also regulated hormonally. Glucagon activates cAMP-dependent protein kinase (PKA; see Figure 15-35), which phosphorylates the pyruvate kinase L isozyme, inactivating it. When the glucagon level drops, a protein phosphatase (PP) dephosphorylates pyruvate kinase, activating it. This mechanism prevents the liver from consuming glucose by glycolysis when blood glucose is low; instead, the liver exports glucose. The muscle isozyme (M form) is not affected by this phosphorylation mechanism.")
57
Two Alternative Fates for Pyruvate
Pyruvate can be a source of new glucose Store energy as glycogen Generate NADPH via pentose phosphate pathway Pyruvate can be a source of acetyl-CoA Store energy as body fat Make ATP via citric acid cycle Acetyl-CoA stimulates glucose synthesis by activating pyruvate carboxylase

58
Chapter 12, Figure 12.36, Alternative pentose phosphate pathway modes

59
Pancreas Adrenal Medulla Glucagon Epinephrine Muscle Liver Brain
+ Glucagon Epinephrine Muscle Liver Brain Glycogen Glycogen + + + + Glucose (Blood) Glucose Glucose + F6P F2,6BP F6P F2,6BP + + PFK PFK F1,6BP F1,6BP PK PK Pyruvate Pyruvate
 Glucose. Glucose. + F6P. F2,6BP. F6P. F2,6BP. + + PFK. PFK. F1,6BP. F1,6BP. PK. PK. Pyruvate. Pyruvate.")
Similar presentations


 1. Why gluconeogenesis?>")


