Download presentation
Presentation is loading. Please wait.

1
Faculty of Applied Engineering and Urban Planning Civil Engineering Department Principles of Cartography Representation Lecture 2 Week 2 2 nd Semester 2007/2008 UP Copyrights 2007

2
Geographic Representation Cartographic Representation Elements of Maps Scale Projection Symbolization Map Components Map Classification Content

3
Representation and Communication A “geographic representation” is the specific process of abstracting observations of the world into things or events on a map or as geographic information, often resulting in a model. A “cartographic representation” involves the process of symbolizing the geographic representation to communicate with readers..

4
Geographic Representation FLOOD When? Where? Observations of river bank elevation and water height Measurements must be given Relationship between water height and river bank elevation.

5
Geographic Representation Geographic representations represent selected aspects of things and events Measurements, observations, and relationships are all parts of geographic representations. Relationships are usually separate from measurements and observations. Some relationships can be determined using measurements and observations. Cartographic representations that follow provide ways to show the relationships

6
Measurement The storage of measurements is a key issue for creating geographic information and relies on the types of measurement developed by Stanley Smith Stevens Stevens developed his reference scheme in the 1940s. His intent was to offer a framework for psychologists and other social sciences that could take intrinsic properties into consideration.

7
Measurement Extrinsic properties are those that are directly empirically measurable: width, height, depth, elevation, and the like. Intrinsic properties are characteristics that can be observed, but must be associated with other properties—for example, color, age, form, quality.

8
Measurement Because of the nature of intrinsic properties, Stevens proposed that measurements should be distinguished according to the ability to combine them with other measurements. For example, the measurement of a person’s height cannot be meaningful combined with the measurement of his or her hair color.

9
Measurement The four measurements and their definitions are: 1.Nominal Qualitative measurements (name, type, state) 2.Ordinal Quantitative measurements with a clear order, but without a defined 0 value (small, medium, large) 3.Interval Quantitative measurements with a defined beginning point (temperature, height, distance) 4.Ratio Quantitative measurements that provide a relationship between two properties where the 0 value indicates the absence of the relationship (particulates mg/m 3, time to cover a distance, dissolved oxygen in a liter of water)
 2.Ordinal Quantitative measurements with a clear order, but without a defined 0 value (small, medium, large) 3.Interval Quantitative measurements with a defined beginning point (temperature, height, distance) 4.Ratio Quantitative measurements that provide a relationship between two properties where the 0 value indicates the absence of the relationship (particulates mg/m 3, time to cover a distance, dissolved oxygen in a liter of water)")
11
Sinton’s Framework Applying Stevens’s measurement framework to manual cartography was relatively straightforward because of an individual’s (or organization’s) control of the design and drawing process. The use of computers and sharing of geographic information changed this because now data collection management and output are divided between numerous individuals and organizations. Sinton adevised a scheme for considering space, time, and properties in three possible roles: fixed, measured, and controlled.

12
Sinton’s Framework Sinton’s Framework was introduced in order to successfully automate cartography, especially if maps were to be used as the basis for analysis. “Analytical cartography,” as it is called, produced a number of important approaches and concepts that became critical to the success of GIS

13
Sinton’s Framework When space is fixed, a measuring device (e.g., tide gauge, stream gauge, NO 2, etc.) measures an attribute at a set interval of time (e.g., constantly, every 10 minutes, once a day, etc.). Measuring devices often use time intervals as the control. They produce information about a single place. People usually collect geographic information about multiple places by fixing the time and measuring characteristics of space or some other attribute, and controlling the space or attribute.

14
Sinton’s Framework If the attribute is fixed and the space is measured, the resulting representation is a vector representation showing the extent of the attribute; if the space is fixed and the attribute is measured, the resulting representation is a raster representation.

15
Sinton’s Framework

16
See the original paper http://proceedings.esri.com/library/userconf/proc02/pap0179/p0179.htm

17
Example Transportation systems evolve over time in response to changing travel demands and land use patterns. Land use patterns also experience frequent changes due to evolving human activities and transportation systems. In order to analyze interactions between land use changes and transportation system development, a GIS framework was proposed. It takes into account the temporal component (when), the spatial component (where), and the thematic component (what) associated with these changes and their interrelationships.
, the spatial component (where), and the thematic component (what) associated with these changes and their interrelationships..")
18
Example

19
Under this modified framework, users can choose between transportation features, land use features and time as the "fixed", the "controlled" and the "measured" components. For example, scenario 2 allows users to “fix" locations and attributes of transportation features (e.g., select highway segments with a level of service "E" in a user-specified area) and “control" time (e.g., 1995 to 2001) in order to "measure" the land use changes in the user-specified area over time.
 and control time (e.g., 1995 to 2001) in order to measure the land use changes in the user-specified area over time..")
20
Cartographic Representation Traditionally, cartographic representation was a choice of map elements, level of generalization, and visual variables, as well as many of the geographic representation elements. However, cartographic communication, in the most general sense, relies on distortions. “A good map tells a multitude of little white lies; it suppresses truth to help the user see what needs to be seen. But the value of a map depends on how well its generalized geometry and generalized content reflect a chosen aspect of reality.”

21
Map Elements For cartographic communication, we should pay special attention to the following characteristics of maps: Scale, Projection, symbolization, and generalization These are Map Elements

22
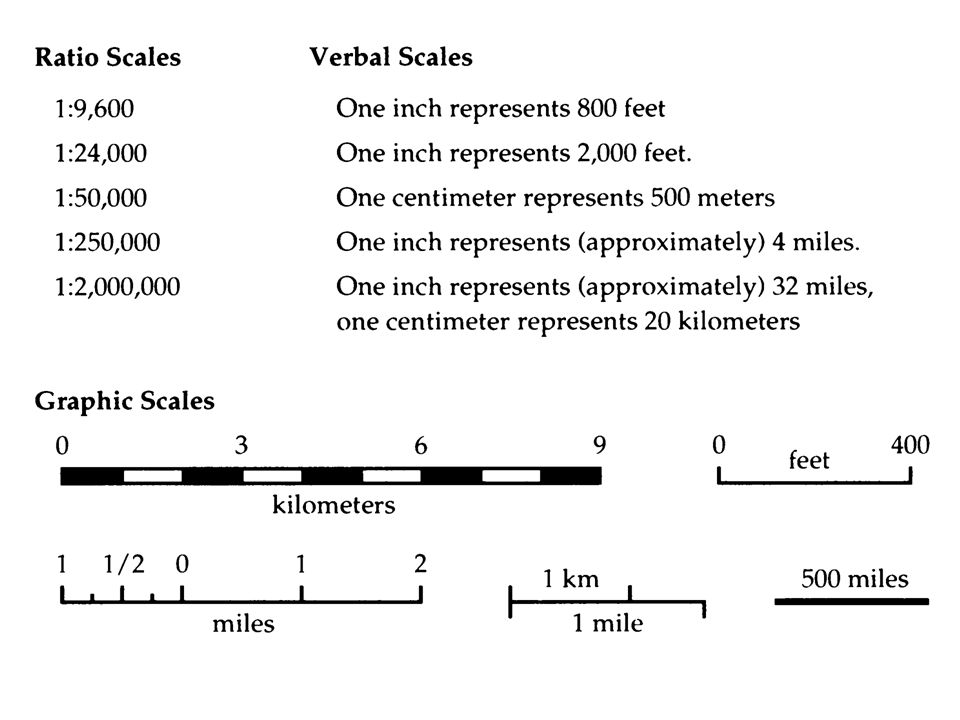
Scale Most maps are smaller than the reality they represent, and map scales tell us how much smaller. Maps can state their scale in three ways: as a ratio, as a short sentence, and as a simple graph.

24
Scale of Maps Architectural Works, Building Works, Location Drawings: 1/50, 1/100, 1/200 Site Plans, civil engineering works: 1/500, 1/1000, 1/1250, 1/2000, 1/2500 Town surveys, highway surveys: 1/1250, 1/2000, 1/2500, 1/5000, 1/10000, 1/20000, 1/50000 Mapping: 1/25000, 1/50000, 1/100000, 1/200000, 1/500000, 1/1000000

25
Scale and Accuracy Usually scale is “defined” by established conventions, rules, or possibly even laws. It has important consequences for accuracy. Large-scale maps cover small areas with significant detail and accuracy. Medium-scale maps cover larger areas with less detail and accuracy. Small-scale maps cover large areas with the least detail and accuracy.

26
Scale and Accuracy The United States Geological Survey describes the positional accuracy of their topographic products in terms of the U.S. National Map Accuracy Standard (1947) that states 90% of the points tested should fall within a fixed distance (0.02 inch or 0.5 mm) of their correct position. The points tested are only the well-defined points, which leaves open the possibility that less well-defined points are far less accurate.
 that states 90% of the points tested should fall within a fixed distance (0.02 inch or 0.5 mm) of their correct position. The points tested are only the well-defined points, which leaves open the possibility that less well-defined points are far less accurate..")
27
Scale and Accuracy

28
Map Symbols Graphic symbols complement map scale and projection by making visible the features, places, and other locational information represented on the map. By describing and differentiating features and places, map symbols serve as a graphic code for storing and retrieving data in a two- dimensional geographic framework. This code can be simple and straight forward, as on a route map drawn to show a new neighbor

29
Map Symbols When the purpose of the map is specific and straightforward, selection of map features also serves to suppress unimportant information. But sheet maps and atlas maps mass-produced by government mapping agencies and commercial map pub-

30
Map Symbols Some maps, such as geologic maps and weather charts, have complex but standardized symbologies that organize an enormous amount of data meaningful only to those who understand the field and its cartographic conventions. Although as arcane to most people as a foreign language or mathematics, these maps also benefit from symbols designed according to principles of logic and communication.

31
Map Symbols Some maps, such as geologic maps and weather charts, have complex but standardized symbologies that organize an enormous amount of data meaningful only to those who understand the field and its cartographic conventions. Although as arcane to most people as a foreign language or mathematics, these maps also benefit from symbols designed according to principles of logic and communication.

Similar presentations


 Information Representation Imagery Terrain Thematic Maps.>")


, ch3.2-3.8 (C1) Get a general idea of urban planning theories (from rading p.333-342 (A)>")


. Location – the space.>")
 E.J. McNaughton.>")