Download presentation
Presentation is loading. Please wait.

2
Unit 5 – The Atmosphere Chapters 11, 12, 13

3
Vocabulary 1.Atmosphere 2.Temperature 3.Humidity 4.Relative humidity 5.Dew point 6.Condensation nuclei 7.Orographic lifting 8.Coalescence 9.Meteorology 10.Air mass 11.Jet stream 12.Front 13.High pressure system 14.Low pressure system 15.Thermometer 16.Barometer 17.Anemometer 18.Hygrometer 19.Isopleths 20.Supercells 21.Tornado 22.Fujita tornado intensity scale 23.Tropical cyclones (hurricanes) 24.Saffir-simpson scale 25.Storm surge 26.Climate 27.Köppen classification system 28.Temperate zone 29.Tropic zone 30.Polar zone
 24.Saffir-simpson scale 25.Storm surge 26.Climate 27.Köppen classification system 28.Temperate zone 29.Tropic zone 30.Polar zone")
4
About 99 percent of the atmosphere is composed of nitrogen and oxygen, with the remaining one percent consisting of small amounts of argon, hydrogen, carbon dioxide, water vapor, and other gases. Atmospheric Composition

6
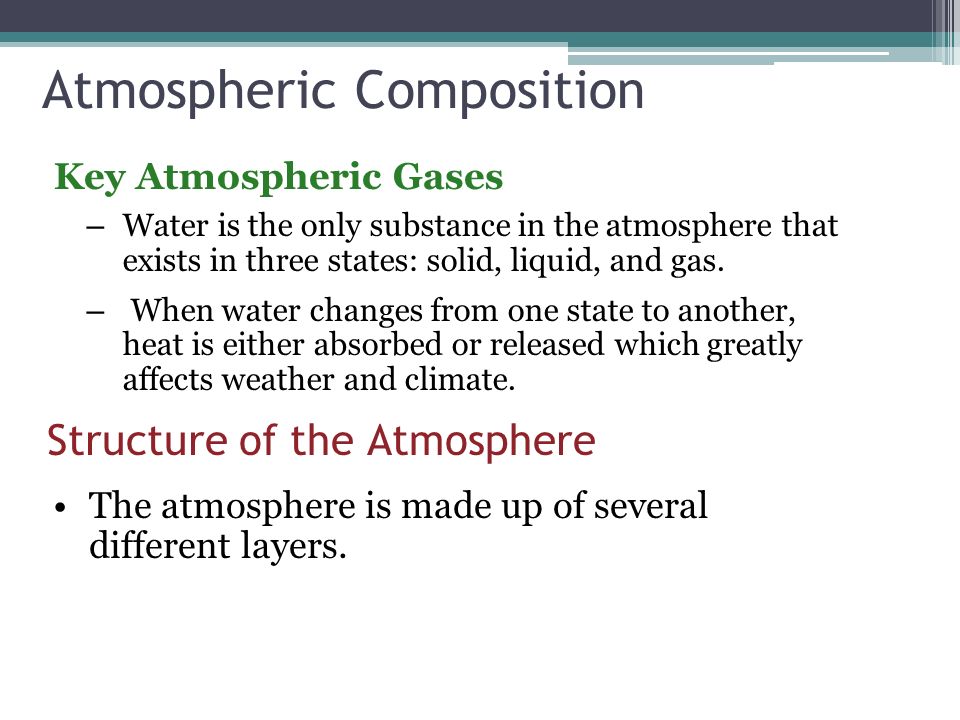
Key Atmospheric Gases – Water is the only substance in the atmosphere that exists in three states: solid, liquid, and gas. – When water changes from one state to another, heat is either absorbed or released which greatly affects weather and climate. Structure of the Atmosphere The atmosphere is made up of several different layers.

7
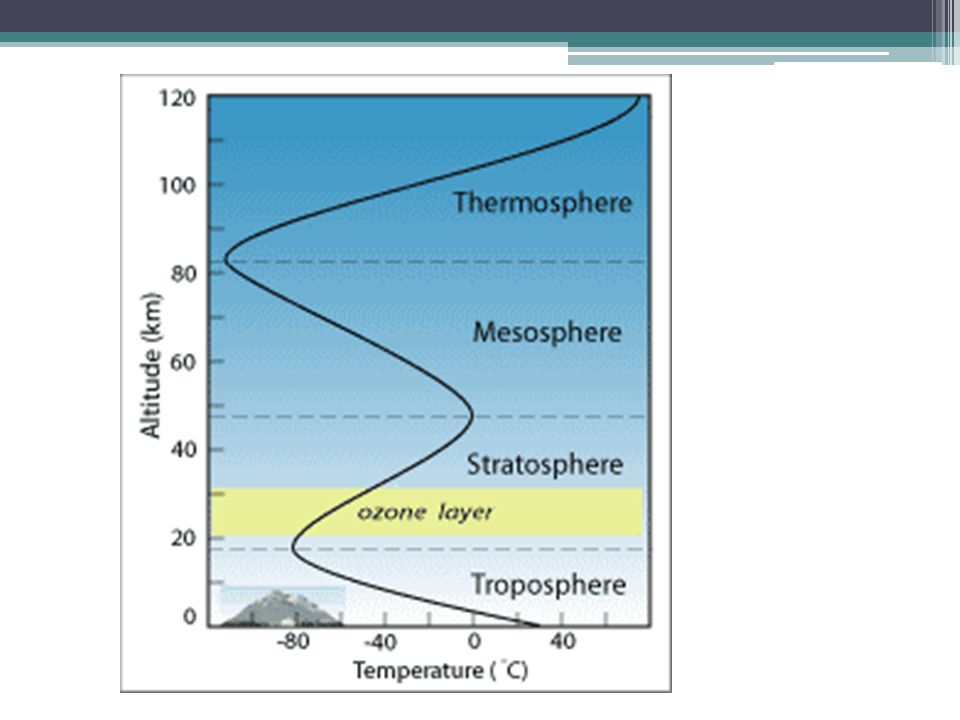
Atmospheric Composition Lower Atmospheric Layers – The troposphere – where most weather takes place and most air pollution collects – The stratosphere - made up primarily of concentrated ozone.

8
Atmospheric Composition Upper Atmospheric Layers – The exosphere, the outermost layer of Earth’s atmosphere – composed of mostly hydrogen and helium. – There is no clear boundary between the atmosphere and space. – The mesosphere is above the stratosphere. – The thermosphere is above the mesosphere.

11
What is Climate? Climate describes annual variations of temperature, precipitation, wind, and other weather variables. – The data used to describe an area’s climate include daily high and low temperatures, amounts of rainfall, wind speed and direction, humidity, and air pressure. What Causes Climates? Climates vary greatly due to: Latitude, topography, closeness to lakes and oceans, global wind patterns, ocean currents, and air masses.

12
What Causes Climates? Latitude – Earth is tilted on its axis which affects how the Sun’s rays strike Earth’s surface and the amount of solar radiation received at any given place on Earth.

13
What Causes Climates? Topographic Effects – Large bodies of water heat up and cool down more slowly than land. – Mountain climates are usually cooler because temperature generally decreases with altitude. Air Masses – Two of the main causes of weather are the movement and interaction of air masses. – Air masses form in one region and move to other regions.

14
How does the ocean effect climate? Over half the heat that reaches the earth from the sun is absorbed by the ocean's surface layer, so surface currents move a lot of heat. Currents that originate near the equator are warm; currents that flow from the poles are cold.

15
How does the ocean affect climate? Ocean water and currents affect the climate…it takes far more energy to change the temperature of water than land or air. Water warms up and cools off much more slowly than land or air. Inland climates are subject to more extreme temperature ranges than coastal climates, which are insulated by nearby water.

16
What about coastal regions? Coastal regions experience a moderate climate throughout the year. The variation in specific heats of water and land (soil) results in the unequal heating of the land and sea surfaces by sunlight. During the day land is heated quickly. The heated air rises and the comparatively cool air from the sea moves over the adjoining land area to replace the rising air. This air movement is called sea breeze. The reverse thing happens at night (land breeze). Thus the days are cooler and nights are warmer in coastal regions making a moderate climate throughout the year.
 results in the unequal heating of the land and sea surfaces by sunlight. During the day land is heated quickly. The heated air rises and the comparatively cool air from the sea moves over the adjoining land area to replace the rising air. This air movement is called sea breeze. The reverse thing happens at night (land breeze). Thus the days are cooler and nights are warmer in coastal regions making a moderate climate throughout the year..")
17
Koeppen Classification System Koeppen distinguished different climatic zones by natural vegetation.

18
Koeppen Classification System Tropical Climates – Characterized by constant high temperatures. – Tropical wet and dry zones include savannas, which are tropical grasslands. Dry Climates – Cover about 30 percent of Earth’s land area, make up the largest climatic zone. – Precipitation is low, and vegetation is scarce.

19
Koeppen Classification System Mild Climates – Mild climates can be classified into three subtypes: humid subtropical climates, marine west coast climates, and mediterranean climates. Continental Climates – Classified into three subtypes: warm summer climates, cool summer climates, and subarctic climates. – Both summer and winter temperatures can be extreme.

20
Koeppen Classification System Polar Climates – The polar climates are the coldest regions on Earth. – Precipitation is generally low because cold air holds less moisture than warm air.

21
Solar Fundamentals The Sun is the source of all energy in the atmosphere transferred through radiation, conduction and convection.

22
Temperature Versus Heat Heat is the transfer of energy that fuels atmospheric processes. Temperature is used to measure and interpret that energy. The temperature of the lower atmosphere decreases with increasing distance from Earth’s surface. Vertical Temperature Changes

23
Temperature Versus Heat Measuring Temperature – Fahrenheit (°F) – Celsius (°C) – Kelvin (K) – measures absolute zero – where molecular motion stops
 – Celsius (°C) – Kelvin (K) – measures absolute zero – where molecular motion stops")
24
A Question of Balance In meteorology, a crucial question is how solar radiation is distributed around the planet. The Sun feels hotter in the tropics because its rays strike Earth more directly, than it does in the polar regions where its rays strike Earth at a low angle. Because the Sun’s rays are more spread out when they strike Earth at a low angle, the same amount of energy is spread over a larger area.

25
What causes weather? Balancing the Budget – The continual motion of air and water reallocates heat energy among Earth’s surface, oceans, and atmosphere and brings it into balance. – Virtually everything that we consider to be weather is part of a constant redistribution of Earth’s heat energy.

26
Air Masses Air Mass Modification – Air masses move, transferring heat from one area to another and thus establishing the heat balance. – As an air mass moves, it starts to acquire some of the characteristics of the new surface beneath it. Classifying Air Masses – Air masses are classified according to their source regions. Ex. Polar, tropical, arctic

27
What are the classifications? 4 general air mass classifications categorized according to the source region. ▫polar latitudes P - located poleward of 60 degrees north and south ▫tropical latitudes T - located within about 25 degrees of the equator ▫continental c - located over large land masses--dry ▫marine m - located over the oceans----moist We can then make combinations of the above to describe various types of air masses.

28
Describing air mass types ▫cP continental polar - cold, dry, stable ▫cT continental tropical - hot, dry, stable air aloft-- unstable surface air ▫mP maritime polar - cool, moist, and unstable ▫mT maritime tropical - warm, moist, usually unstable

29
Fronts Cold Fronts – In a cold front, cold, dense air displaces warm air and forces the warm air up along a steep front. – Clouds, showers, and thunderstorms

30
Fronts Warm Fronts – In a warm front, advancing warm air displaces cold air. – A gradual frontal slope. – Characterized by cloudiness and steady, widespread precipitation.

31
Fronts Stationary Fronts – A stationary front is the result of two air masses meeting and neither advancing into the other’s territory, stalling the boundary between them.

32
Fronts Occluded Fronts – An occluded front is the result of a cold air mass overtaking a warm front, wedging the warm air upward. – Precipitation is common

33
Pressure Systems High-Pressure Systems – In a high-pressure system, air sinks, so that when it reaches Earth’s surface it spreads away from the center.

34
Pressure Systems Low-Pressure Systems – In low-pressure systems, air rises, causing an inward net flow toward the center and then upward.

35
Air Pressure and Density Air pressure increases as you near the bottom of the atmosphere because of the greater mass of the atmosphere above you. Wind Wind can be thought of as air moving from an area of high pressure to an area of low pressure. Wind speed generally increases with height in the atmosphere because there is less friction.

36
Pressure-Temperature-Density Relationship Temperature, pressure, and density are related. In the atmosphere, temperature is directly proportional to pressure. The relationship between temperature and density is inversely proportional.

37
Relative Humidity Relative humidity varies with temperature because warm air is capable of holding more moisture than cool air. Relative humidity is expressed as a percentage.

38
Global Wind Systems There are three basic zones, or wind systems, in each hemisphere. Trade winds Prevailing westerlies - responsible for most of the weather movement in US and Canada Polar easterlies – characterized by cold air

39
Global Wind Systems

40
Jet Streams Large-Scale Weather Systems – Weather systems generally follow the path of the jet stream. – The jet stream affects the intensity of weather systems by moving air of different temperatures from one region to another.

41
Cloud Formation Buoyancy is the tendency for air to rise or sink as a result of differences in density. Clouds form when warm, moist air rises, expands, and cools in a convection current resulting in cloud formation.

42
Types of Clouds

43
Gathering Weather Data Meteorologists measure the atmospheric variables of temperature, air pressure, wind, and relative humidity to make accurate weather forecasts. Two of the most important factors in weather forecasting are the accuracy and the density of the data, or the amount of data available.

44
Weather Radar Doppler Radar – Meteorologists use Doppler radar, which is based on the Doppler effect, to plot the speed at which raindrops move toward or away from a radar station. A weather radar system is used to pinpoint where rain is falling.

45
Weather Satellites One of the main uses of satellites in orbit around Earth is to observe weather. Satellites track clouds but not necessarily precipitation.

46
Weather Satellites Infrared Imagery – Infrared images allow meteorologists to determine the temperature of a cloud and infer the type it is and estimate its height, which is related to strength.

47
Surface Analysis To plot data nationwide or globally, meteorologists use isopleths. Isopleths are lines that connect points of equal or constant values, such as pressure or temperature. – Lines of equal pressure are called isobars. – Lines of equal temperature are called isotherms.

48
Surface Analysis Isobars also indicate the locations of high- and low-pressure systems.

49
Short-Term Forecasts Weather systems change directions, speed, and intensity with time in response to changes in the upper atmosphere. Forecasts Digital Forecasts – Digital forecasting is the main method used by modern meteorologists and it is highly dependent on the density of the data available. Analog Forecasts – Analog forecasting is useful for conducting monthly or seasonal forecasts, which are based mainly on the past behavior of cyclic weather patterns.

50
Long-Term Forecasts Accuracy Declines with Time – Long-term forecasts involving months and seasons are based largely on patterns or cycles involving changes in the atmosphere, ocean currents, and solar activity. The most accurate and detailed forecasts are short-term in nature.

51
The Weather Station Model ©Steve Kluge 2007 Some images from the NYSED Earth Science Reference TablesSteve Kluge Get accompanying notes here Draw a Station Model

52
Decoding the Coded Pressure 196 Insert a decimal point to the left of the last digit 19.6 Put a “9” or “10” in front of the result Place a “9” in front if the value is higher than 500. Place a “10” in front if the value is lower than 500. Coded pressure 196= 1019.6 mb Decode these coded pressures: 002 993 280 000 1000.2 999.3 1028.01000.0 Back to the Station Model How to encode pressures ©S. Kluge 2007

53
Encoding the Pressure 1013.5 Remove the decimal point 10135 Report the last 3 digits 135 Pressure 1013.5 = 135 encoded pressure Encode these pressures: 1032.7 987.3 1012.2 1000.1 327 873 122001 Back to the Station Model Back to Decoding Pressures ©S. Kluge 2007

54
The Barometric Trend + 19 / + means “Higher now than it was 3 hours ago” (- means “Lower now than it was 3 hours ago” ) 19 means the pressure has changed by 1.9 mb / means the pressure is currently rising ( \ means the pressure is currently falling ) Back to the Station Model What was the pressure 3 hours ago?Here? 1017.7 1003.5 ©S. Kluge 2007

55
Back to the Station Model ©S. Kluge 2007

56
Back to the Station Model NE at 25 Knots E at 5 Knots SE at 10 Knots ©S. Kluge 2007

57
Temperature= 45F Dewpoint= 32F Wind NE at 20 knots Overcast Visibility= 1.5 miles Rain Showers Pressure Now= 997.3 mb Pressure 3 hrs. ago= 1000.2mb Barometer Falling Precipitation in last 6 hrs.=.53 in. Draw a Station Model for These Conditions: ©S. Kluge 2007 Back to the Station Model

58
How Thunderstorms Form For a thunderstorm to form, three conditions must exist. 1.An abundant source of moisture. 2.The lifting of air so that the moisture can condense and release latent heat. 3.The portion of the atmosphere through which the cloud grows must be unstable. All thunderstorms, regardless of intensity, have certain characteristics in common.

59
Stages of Development A thunderstorm usually has three stages: the cumulus stage, the mature stage, and the dissipation stage. The stages are classified according to the direction in which the air is moving.

60
Tornadoes A tornado is a violent, whirling column of air in contact with the ground. Before a tornado reaches the ground, it is called a funnel cloud. The air in a tornado is made visible by dust and debris drawn into the swirling column, or by the condensation of water vapor into a visible cloud.

61
Tropical Cyclones Formation of Tropical Cyclones – Tropical cyclones require two basic conditions to form: 1. An abundant supply of very warm ocean water 2. Some sort of disturbance to lift warm air and keep it rising – They occur most frequently in the late summer and early fall, when Earth’s oceans contain their greatest amount of stored heat energy.

62
Tropical Cyclones Movement of Tropical Cyclones – Tropical cyclones move according to the wind currents that steer them. Classifying Hurricanes The Saffir-Simpson hurricane scale ranges from Category 1 hurricanes to Category 5 storms, which can have winds in excess of 155 mph.

63
Hurricane Hazards Storm Surges – A storm surge occurs when hurricane-force winds drive a mound of ocean water, sometimes as high as 6 m above normal sea level, toward coastal areas where it washes over the land. – Floods are an additional hurricane hazard.

64
Test Review Terms: Storm surge, exosphere, troposphere, mesosphere, stratosphere, thermosphere, doppler effect, station model, dew point, condensation nuclei, coalescence What do severe thunderstorms need to form? What are associated with severe thunderstorms? Weather vs. climate Compare and contrast characteristics of low pressure systems and high pressure systems. What are types of weather associated with each? Draw the symbols of each.

65
Test Review What are the 2 main gases making up the atmosphere? Air masses – what are they? Know the types and how to place them on a map (cT, cP, cA, mT, mP) What are the 3 methods of energy transfer? Atmosphere layers - describe temp. changes in each layer; why does the temperature increase with height in the stratosphere? Is weather forecasting more accurate today than 100 years ago? Why? What are isopleths? Isobars? Isotherms?
 What are the 3 methods of energy transfer. Atmosphere layers - describe temp. changes in each layer; why does the temperature increase with height in the stratosphere. Is weather forecasting more accurate today than 100 years ago. Why. What are isopleths. Isobars. Isotherms .")
66
Test Review Be able to draw a station model from given data.

67
The Weather Station Model ©Steve Kluge 2007 Some images from the NYSED Earth Science Reference TablesSteve Kluge Get accompanying notes here Draw a Station Model

68
Decoding the Coded Pressure 196 Insert a decimal point to the left of the last digit 19.6 Put a “9” and a “10” in front of the result 919.6 1019.6 Test the results against the range of normal atmospheric pressures 919.6 is below the range of normal pressures….REJECTED! 1019.6 is within the range of normal pressures….ACCEPTED! Coded pressure 196= 1019.6 mb Decode these coded pressures: 002 993 280 000 1000.2 999.3 1028.01000.0 Back to the Station Model How to encode pressures ©S. Kluge 2007

69
Encoding the Pressure 1013.5 Remove the decimal point 10135 Report the last 3 digits 135 Pressure 1013.5 = 135 encoded pressure Encode these pressures: 1032.7 987.3 1012.2 1000.1 327 873 122001 Back to the Station Model Back to Decoding Pressures ©S. Kluge 2007

70
The Barometric Trend + 19 / + means “Higher now than it was 3 hours ago” (- means “Lower now than it was 3 hours ago” ) 19 means the pressure has changed by 1.9 mb / means the pressure is currently rising ( \ means the pressure is currently falling ) Back to the Station Model What was the pressure 3 hours ago?Here? 1017.7 1003.5 ©S. Kluge 2007

71
Back to the Station Model ©S. Kluge 2007

72
Back to the Station Model NE at 25 Knots E at 5 Knots SE at 10 Knots ©S. Kluge 2007

73
Temperature= 45F Dewpoint= 32F Wind NE at 20 knots Overcast Visibility= 1.5 miles Rain Showers Pressure Now= 997.3 mb Pressure 3 hrs. ago= 1000.2mb Barometer Falling Precipitation in last 6 hrs.=.53 in. Draw a Station Model for These Conditions: ©S. Kluge 2007 Back to the Station Model

Similar presentations


 WordDefinitionPicture Weather the state of the atmosphere at a given time and place.>")
