Download presentation
Presentation is loading. Please wait.

1
Ex St 801 Statistical Methods Introduction

2
Basic Definitions STATISTICS : Area of science concerned with extraction of information from numerical data and its use in making inference about a population from data that are obtained from a sample.

3
Basic Definitions (cont.) POPULATION : set representing all measurements of interest to the investigator. PARAMETER : an unknown population characteristic of interest to the investigator.

4
Basic Definitions (cont.) SAMPLE : subset of measurements selected from the population of interest. STATISTIC: a sample characteristic of interest to the investigator.

5
Some Frequently Used Statistics and Parameters

6
Basic Definitions (cont.) STATISTICAL INFERENCE : making an "INFORMED GUESS" about a parameter based on a statistic. ( This is the main objective of statistics. )
.")
7
STATISTICAL INFERENCE GATHER DATA MAKE INFERENCES POPULATION SAMPLE PARAMETERS SAMPLE STATISTICS

8
More Basic Definitions A VARIABLE is a characteristic of an individual or object that may vary for different observations. A QUANTITATIVE VARIABLE measures a variable scale. A QUALITATIVE VARIABLE categorizes the values of the variable.

9
RAISIN BRAN EXAMPLE A cereal company claims that the average amount of raisins in its boxes of raisin bran is two scoops. A random sample of five boxes was taken off the production line, and an analysis revealed an average of 1.9 scoops per box.

10
Components of the Problem Identify the population Identify the sample Identify the symbol for the parameter Identify the symbol for the statistic Is the variable quantitative or qualitative?

11
ASPIRIN AND HEART ATTACKS 1 Twenty thousand doctors participated in a study to determine if taking an aspirin every other day would result in a reduction of heart attacks.

12
ASPIRIN AND HEART ATTACKS 2 The physicians were randomly divided into two groups. The first group (called the treatment group) received an aspirin every other day, while the other group (called the control group) received a placebo.
 received an aspirin every other day, while the other group (called the control group) received a placebo..")
13
ASPIRIN AND HEART ATTACKS 3 At the end of the study, there had been 104 heart attacks in the treatment group and 189 heart attacks in the control group.

14
Identifying Components of the Problem Identify the population Identify the sample Identify the symbol for the parameter Identify the symbol for the statistic Is the variable quantitative or qualitative?

15
Five Steps in a Statistical Study : 1. Stating the problem 2. Gathering the data 3. Summarizing the data 4. Analyzing the data 5. Reporting the results

16
Stating the Problem Specifically identifying the population to be sampled Identifying the parameter(s) being studied
 being studied")
17
Stating the Problem Example A researcher wanted to determine if a vitamin supplement would reduce the rate of certain cancers. A large study was conducted in China and the results indicated that people who had the vitamin supplement had a significantly lower cancer rate. Do the results of this study apply to Americans? Why or why not?

18
Gathering the Data SURVEYS –Random Sampling –Stratified Sampling –Cluster Sampling –Systematic sampling

19
Gathering the Data EXPERIMENTS –Completely Randomized Design –Randomized Block Design –Factorial Design

20
More Definitions DESCRIPTIVE STATISTICS: Organizing and describing sample information. (Descriptive Statistics describe how things are.)
.")
21
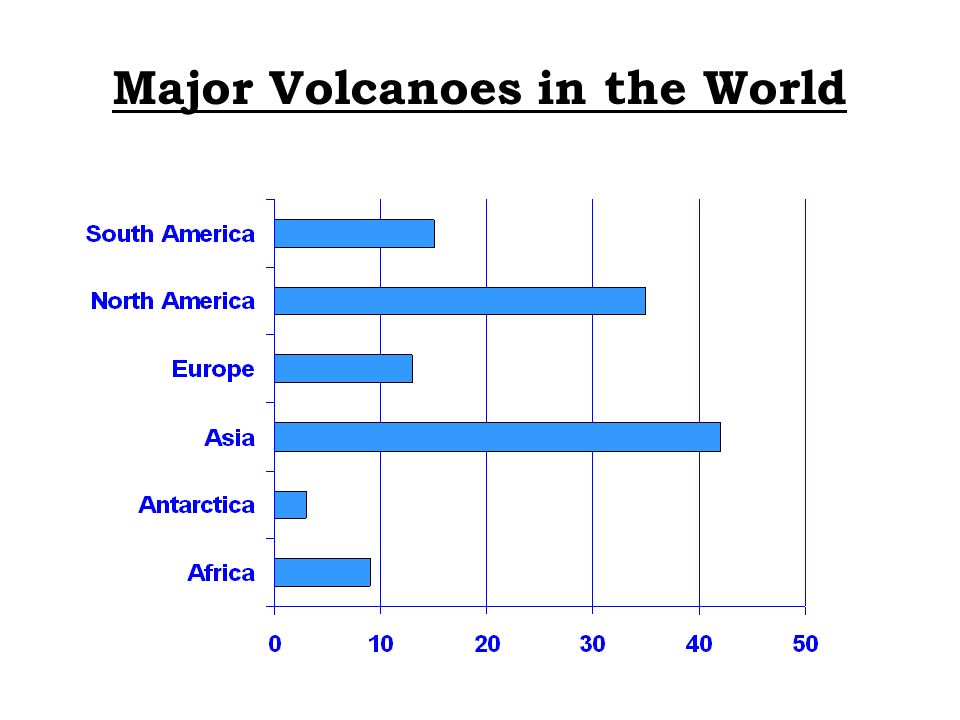
Graphical Displays for Qualitative Data PIE CHART BAR CHART

22
Major Volcanoes in the World

24
Graphical Displays for Quantitative Data HISTOGRAM STEM AND LEAF DISPLAY

25
Histogram of Major Volcanoes in the World

26
Life Expectancies in 33 Developed Nations

27
Histogram of Life Expectancies in 33 Developed Nations

28
Stem-Leaf Display for Elevation KEY: UNIT = 1000 1 | 2 REPRESENTS 12000 STEM LEAF 0 001111 0 222333 0 444444444455555555 0 6666667777777 0 8888888999999999999 1 0000000000000111111 1 22222222333333 1 44555 1 67777 1 8889999

29
Construction of a Stem-Leaf Display List the stem values, in order, in a vertical column Draw a vertical line to the right of the stem values For each observation, record the leaf portion of the observation in the row corresponding to the appropriate stem Reorder the leaves from the lowest to highest within each stem row

30
Construction of a Stem-Leaf Display (cont.) If the number of leaves appearing in each stem is too large, divide the stems into two groups, the first corresponding to leaves 0 through 4, and the second corresponding to leaves 5 through 9. (This subdivision can be increased to five groups if necessary). Provide a key to your stem and leaf coding, so the reader can reconstruct the actual measurements.
. Provide a key to your stem and leaf coding, so the reader can reconstruct the actual measurements..")
31
Numerical Measures for Summarizing Data TYPES: 1. Measures of CENTRAL TENDENCY 2. Measures of VARIABILITY 3. Measures OF RELATIVE LOCATION

32
The Arithmetic Mean The ARITHMETIC MEAN of a set of n measurements (y 1, y 2,..., y n ) is equal to the sum of the measurements divided by n.
 is equal to the sum of the measurements divided by n.")
33
The mathematical notation for the ARITHMETIC MEAN is:

34
The Median The MEDIAN of a set of n measurements (y 1, y 2,..., y n ) is the value that falls in the middle position when the measurements are ordered from the smallest to the largest.
 is the value that falls in the middle position when the measurements are ordered from the smallest to the largest.")
35
RULE FOR CALCULATING THE MEDIAN 1 Order the measurements from the smallest to the largest. 2 A)If the sample size is odd, the median is the middle measurement. B)If the sample size is even, the median is the average of the two middle measurements.
If the sample size is odd, the median is the middle measurement. B)If the sample size is even, the median is the average of the two middle measurements..")
36
Example A random sample of six values were taken from a population. These values were: y 1 =7, y 2 =1, y 3 =10, y 4 =8, y 5 =4, and y 6 =12. What are the sample mean and sample median for these data?

37
Sample Mean

38
CALCULATIONS FOR THE SAMPLE MEDIAN ( Ordered Sample) MEDIAN = ( 7 + 8 ) / 2 = 7.5 y 2 =1, y 5 =5, y 1 =7, y 4 =8, y 3 =10, y 6 =12
 MEDIAN = ( ) / 2 = 7.5 y 2 =1, y 5 =5, y 1 =7, y 4 =8, y 3 =10, y 6 =12")
39
Consider the following sample: 4 18 36 39 41 42 43 44 44 45 46 47 48 49 49 50 51 53 54 60 Which measure of central tendency best describes the central location of the data: THE SAMPLE MEAN OR SAMPLE MEDIAN?

40
STEM LEAF 0 4 0 1 1 8 2 3 3 69 4 12344 4 567899 5 0134 5 6 0

41
MEASUREMENTS OF VARIABILITY RANGE VARIANCE STANDARD DEVIATION

42
Deviation The DEVIATION of an observation y i from the sample mean is equal to: Deviations to the left of the sample mean are negative and deviations to the right of the sample mean are positive. Also, notice that the larger the squared deviation, the further away the observation is from the mean.

43
Formula for the Sample Variance

44
Obs. 1 7 0 0 2 1 -6 36 3 10 3 9 4 8 1 1 5 4 -3 9 6 12 5 25 80 1 7 49 2 1 1 3 10 100 4 8 64 5 4 16 6 12 144 42374 Y (Y-Y) (Y-Y) 2 Obs. Y Y 2
 (Y-Y) 2 Obs. Y Y 2.")
45
Calculation of Sample Variance

46
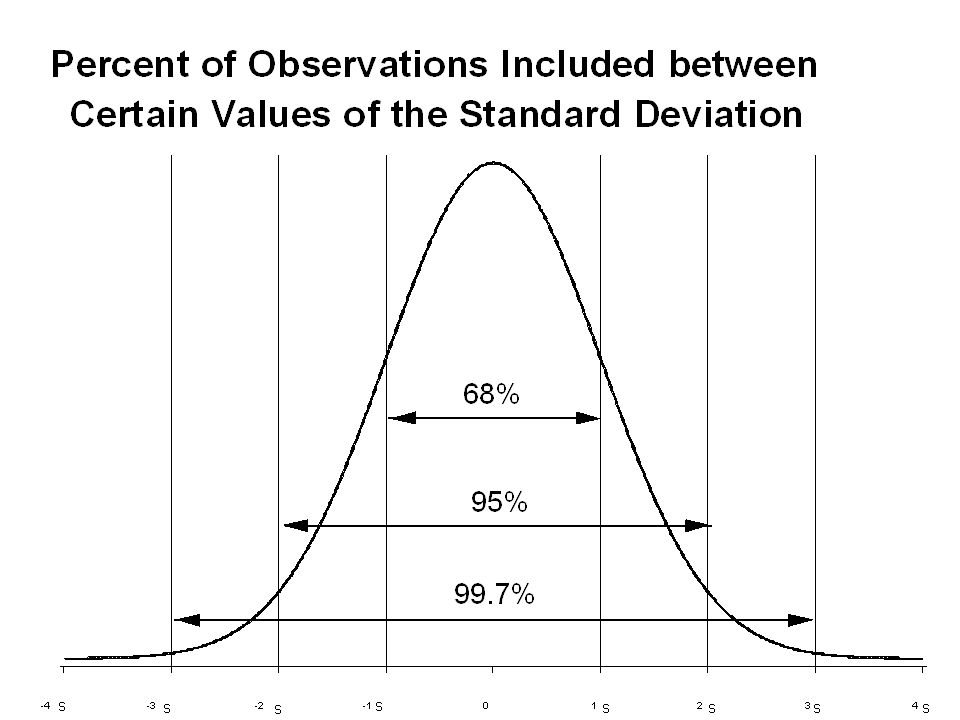
THE EMPIRICAL RULE Given a large set of measurements possessing a mound-shaped histogram, then the interval contains approximately 68% of the measurements. the interval contains approximately 95% of the measurements. the interval contains approximately 99.7% of the measurements.

48
Major Volcanoes in the World

49
TWO MEASURES OF RELATIVE STANDING Percentile Quartile

50
The P th Percentile is the value Xp such that p% of the measurements will fall below that value and (100-p)% of the measurements will fall above that value. p% (100-p)% XpXp
% XpXp.")
51
Quartiles divide the measurements into four parts such that 25% of the measurements are contained in each part. The first quartile (Lower Quartile) is denoted by Q 1, the second by Q 2, and the third (Upper Quartile) by Q 3. Q1Q2Q3 25%
 is denoted by Q 1, the second by Q 2, and the third (Upper Quartile) by Q 3. Q1Q2Q3 25%.")
52
Box and Whisker Plot Life Expectancies in 33 Developed Nations

53
Calculating Fence Values Lower Inner Fence: Q1 - 1.5 (IQR) Upper Inner Fence: Q3 + 1.5 (IQR) Lower Outer Fence: Q1 - 3 (IQR) Upper Outer Fence: Q3 + 3 (IQR)
 Upper Inner Fence: Q (IQR) Lower Outer Fence: Q1 - 3 (IQR) Upper Outer Fence: Q3 + 3 (IQR)")
54
EXAMPLE: Construct a Box-and-Whisker Plot for the elevations of volcanoes in Africa 1,650 5,981 7,745 9,281 10,023 11,400 12,198 13,451 19,340 Median = Q 1 = Q 2 = IQR = Lower Inner Fence = Upper Inner Fence = Lower Outer Fence = Upper Outer Fence =

55
BOX AND WHISKER PLOT MAJOR VOLCANOES IN AFRICA

56
Ex St 801 Statistical Methods The End

Similar presentations