Download presentation
Presentation is loading. Please wait.

1
Opener – Wed., Jan. 18th: I’ll give you the data to use to
Please write these 2 questions, then I’ll give you the data to use to answer them. (i) State which nutrient shows the shortest mean residence time in a temperate forest. (1 mark) (ii) Identify the biome in which potassium has the longest mean residence time. (1 mark)
 State which nutrient shows the shortest mean. residence time in a temperate forest. (1 mark) (ii) Identify the biome in which potassium has the. longest mean residence time. (1 mark)")
2
Mean residence time / years
Ecosystems require an input of energy, water and nutrients to maintain themselves. Nutrients may be reused through recycling within ecosystems. Nutrient cycling within an ecosystem has been studied in many biomes. One factor studied is the mean residence time (MRT), which is the amount of time needed for one cycle of decomposition (from absorption by organism to release after death). The table below gives the mean residence time for certain nutrients in four different biomes. In addition, the plant productivity is also shown. (Plant productivity gives an indication of the quantity of biomass potentially available to consumers.) Mean residence time / years Biome Carbon Nitrogen Phos-phorus Potass-ium Cal-cium Magn-esium Plant productivity /g Cm–2 yr–1 Sub-arctic forest 353.0 230.0 324.0 94.0 149.0 455.0 360 Temperate forest 4.0 5.5 5.8 1.3 3.0 3.4 540 Chaparral 3.8 4.2 3.6 1.4 5.0 2.8 270 Tropical rainforest 0.4 2.0 1.6 0.7 1.5 1.1 900
, which is the amount of time needed for one cycle of decomposition (from absorption by organism to release after death). The table below gives the mean residence time for certain nutrients in four different biomes. In addition, the plant productivity is also shown. (Plant productivity gives an indication of the quantity of biomass potentially available to consumers.) Mean residence time / years. Biome. Carbon. Nitrogen. Phos-phorus. Potass-ium. Cal-cium. Magn-esium. Plant productivity /g Cm–2 yr–1. Sub-arctic forest Temperate forest Chaparral Tropical rainforest")
3
And the winners are... (i) potassium/K 1 (ii) sub-arctic forest 1
On IB markschemes (answer keys)... “/” = “;” =
... / = ; =")
4
“Entangled Bank” –Origin of Species, C. Darwin
It is interesting to contemplate an entangled bank, clothed with many plants of many kinds. With birds singing on the bushes, with various insects flitting about, and with worms crawling through the damp earth, and to reflect that these elaborate constructed forms, so different from each other, and dependent on each other in so complex a manner, have all been produced by laws acting around us.

5
“Entangled Bank” –Origin of Species, C. Darwin
... There is grandeur in this view of life, with its several powers, having been originally breathed into a few forms or into one; and that, whilst this planet has gone cycling on according to the fixed laws of gravity, from so simple a beginning endless forms so beautiful and most wonderful have been, and are being, evolved'. (Chapter 14: Recapitulation and Conclusion) Darwin. C (1859) Origin of Species
 Darwin. C (1859) Origin of Species.")
6
IB “Core” Topics: Ecology 5.1 5.2 5.3

7
5.1 Communities 5.1.1 Define species, habitat, population, community, ecosystem and ecology. 5.1.2 Distinguish between autotroph and heterotroph. 5.1.3 Distinguish between consumers, detritivores and saprotrophs. 5.1.4 Describe what is meant by a food chain, giving three examples, each with at least three linkages (four organisms). 5.1.5 Describe what is meant by a food web. 5.1.6 Define trophic level. 5.1.7 Deduce the trophic level of organisms in a food chain and a food web. 5.1.8 Construct a food web containing up to 10 organisms, using appropriate information. 5.1.9 State that light is the initial energy source for almost all communities. 5.1.10 Explain the energy flow in a food chain. 5.1.11 State that energy transformations are never 100% efficient. 5.1.12 Explain reasons for the shape of pyramids of energy. 5.1.13 Explain that energy enters and leaves ecosystems, but nutrients must be recycled. 5.1.14 State that saprotrophic bacteria and fungi (decomposers) recycle nutrients.
 Describe what is meant by a food web Define trophic level Deduce the trophic level of organisms in a food chain and a food web Construct a food web containing up to 10 organisms, using appropriate information State that light is the initial energy source for almost all communities Explain the energy flow in a food chain State that energy transformations are never 100% efficient Explain reasons for the shape of pyramids of energy Explain that energy enters and leaves ecosystems, but nutrients must be recycled State that saprotrophic bacteria and fungi (decomposers) recycle nutrients.")
9
“Infertile Offspring”
Female horse, male donkey mule Female tiger, male lion liger

10
5.1.2 Autotroph vs.Heterotroph
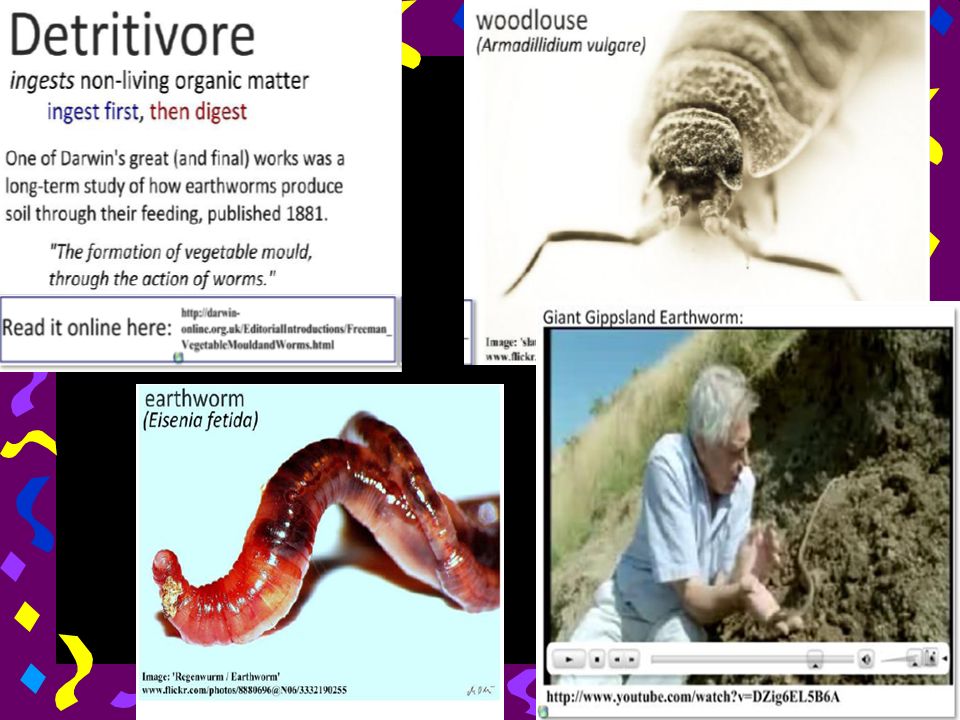
5.1.3 Consumers, etc.

11
Decomposers Saprotrophic bacteria & fungi recycle nutrients (organic molecules) of dead organisms
 of dead organisms.")
12
5.1.14 Decomposition—how’s it work?
Decomposition: forms soil, recycles nutrients, reduces high energy C cmpds Begins w/secretion of extra-cellular digestive enzymes produced by sap. Bacteria, fungi Secreted onto dead organism Hydrolyze biol. Molecs that made up the dead organism soluble, so absorbed by sap. Oxidized, release CO2 & N Gives energy to the bact/fungi but also returns matter to abiotic envt

15
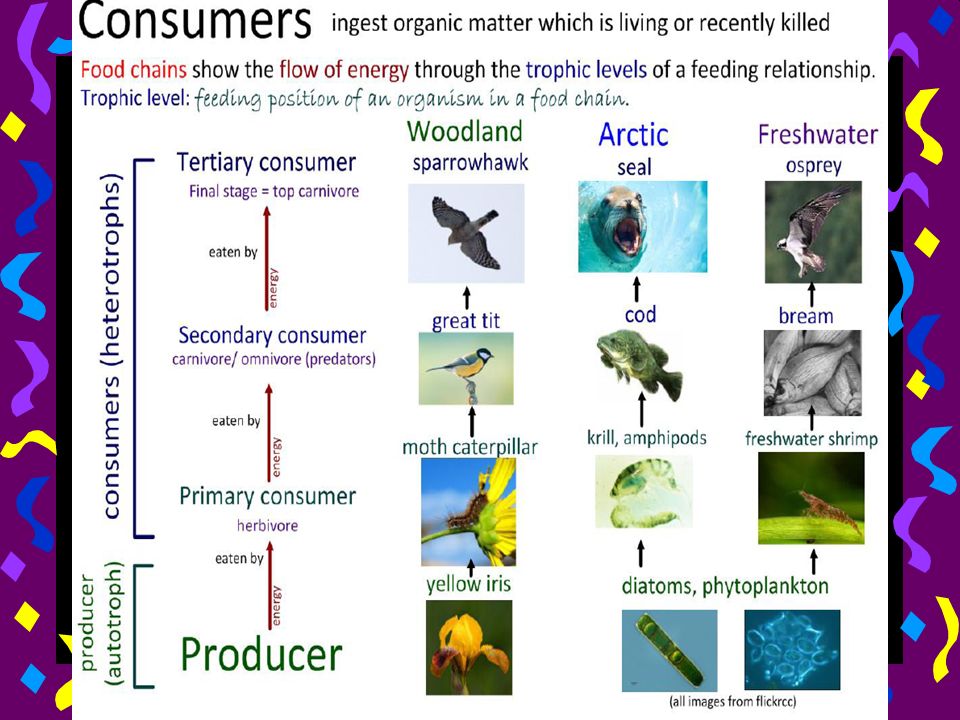
5.1.4 Food Chains Simple linear flow Who eats whom
ARROWS: Energy & matter flowing through links in chain Amt energy each level Energy each level? REAL examples, common names ok But more specific than “tree”, “fish” Producer, consumers—no decomp.

17
Who’s the producer? Primary consumer? Tertiary consumer?

18
Bushgrass impala cheetah lion
Who’s the producer? Primary consumer? Tertiary consumer?

19
Buckwheat gopher gopher snake red tailed kite
WHY are big predators so rare?

20
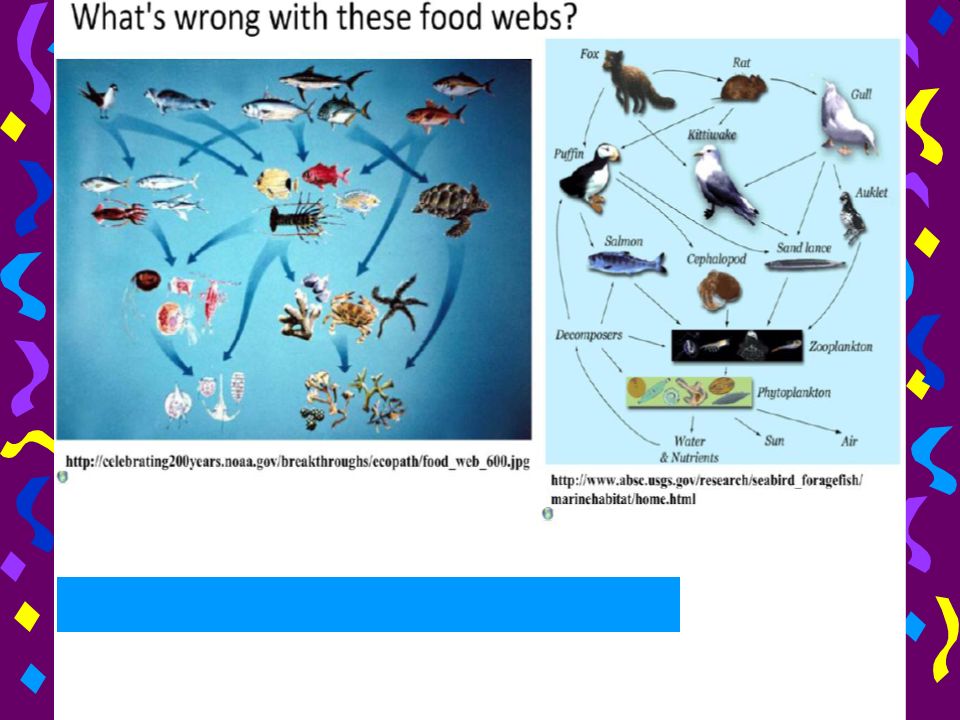
5.1.5 Food Webs Diagram, shows how chains linked BENEFITS:
More complex interactions b/w species and community/ecosystem >1 producer supports community Consumer can have diff food diff trophic levels

21
5.1.6 Trophic Level Defines feeding rel’ship of it to others in food web/chain Consumer can be in different TLs—depends on who prey is

22
5.1.8 Construct Food Web

24
Phytoplankton sea whip reef shark
algae Diadarma marine omnivores groupers Snappers & reef sharks can be either secondary or tertiary consumers (depending on food source)
")
26
5.1.7 TL in food chain/web

27
Who’s the most important in the food web??
Producers or Decomposers

29
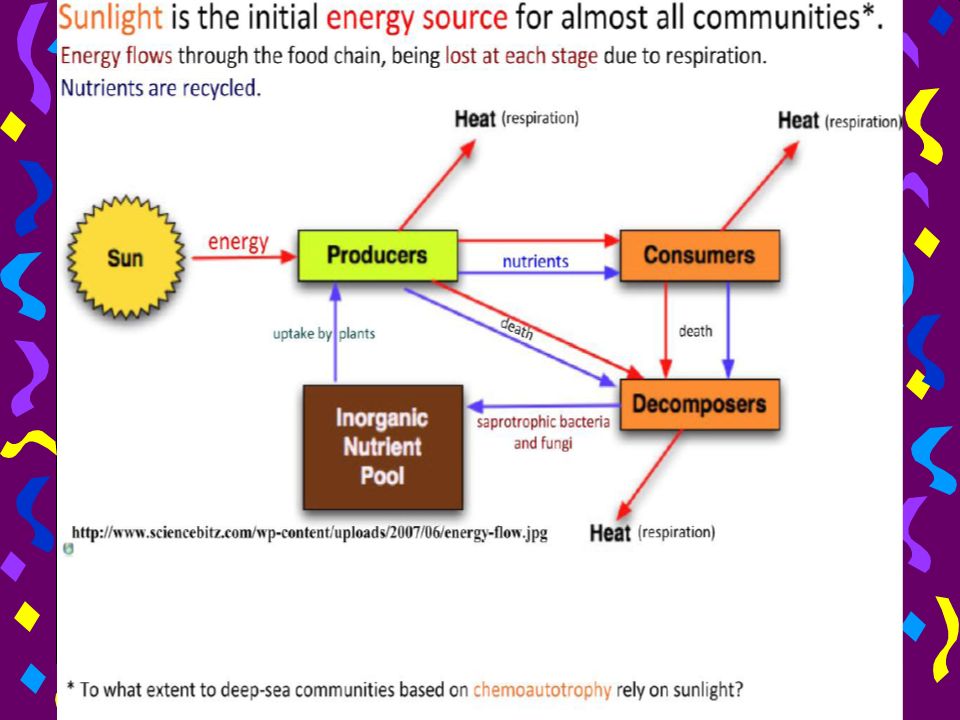
Light & Food Chains Chain/web/community interactions maintained by energy Sunlight = energy source for most aquatic & terrestrial communities Chlorophyll = principle trap of sun’s energy In producers’ chloroplasts Other communities—chemical energy

31
Efficiency not 100% ~ % 1 TL will be assimilated at next higher TL Model: typical loss of energy from solar radiation through various trophic levels tapering of the model volume of 1 layer is 10% of the layer below in part, this loss of energy makes food chains ~short

32
5.1.11 Efficiency not 100% Extreme environments (arctic)
initial trapping of energy by producers is low food chains are short Tropical rainforest trapping of energy is more efficient food chains are longer, webs are more complex

33
5.1.12 Shape of energy pyramids
Solar not shown Flow of energy Units: energy/unit area/unit time kJ m-2 yr-1 Narrowing shape—why? Gradual loss along chain

34
Energy LOSS...WHY? Prey’s not 100% eaten detritivores
Not all that is eaten is digested decomposers Death before being eaten Heat energy from respiration rxns ULTIMATELY...all energy lost as heat

35
5.1.10 Energy flow in food chain
Not all solar energy comes in contact w/chlorophyll (not trapped in synthesis of org. cmpds) Photosynthesis Consumers feed on producers, pass on energy in food Need lots producers in food web Fewer & fewer of higher TLs
 Photosynthesis. Consumers feed on producers, pass on energy in food. Need lots producers in food web. Fewer & fewer of higher TLs.")
36
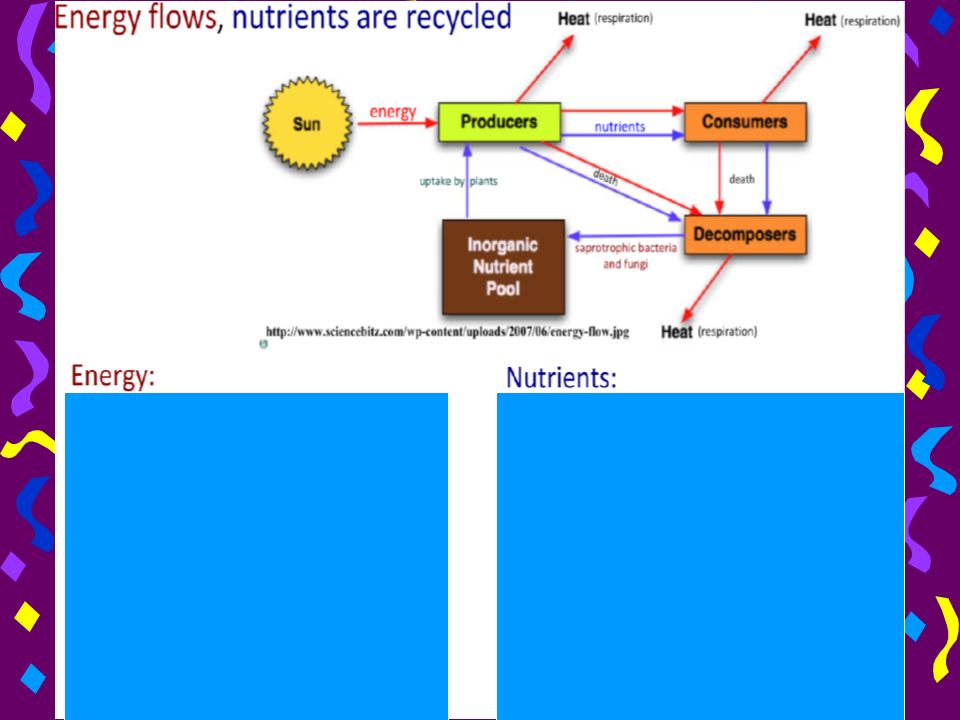
5.1.13 Energy vs Nutrients Energy Flows, Matter Cycles
Energy lost as each TL; top of pyramid tapers b/c ultimately all lost as heat Producers convert inorg molecs into organic ones; diff levels take it in and use for growth...C, N, Water cycles

38
Why are big predators rare?
Energy, matter lost at each stage # organisms each link in chain Higher TL organisms less common Most chains have 4 TL Top carnivores must feed over wide area/territory to find food As population decreases, more vulnerable to ‘catastrophes’ ... ‘super’ top predators unlikely b/c evolutionary disadvantageous

Similar presentations