Download presentation
Presentation is loading. Please wait.

1
Gina Martin Wachovia Economics 704.383.6805 gina.martin@wachovia.com Economic Outlook Oil, the Fed, and Housing – Oh My! National Marine Bankers Association September 13, 2005

2
Economic Growth Slowing Down

3
What’s Behind Slower Growth in 2006? Business Cycle – Expansion Sets In Oil Prices - $65 and $2.50 (or more!) Housing – ATM Starting to Run Low Autos – Borrowing from Future Sales Rates – 250 bps in 14 months, More to Come Long Rates – Where Do Rates Go From Here?
 Housing – ATM Starting to Run Low Autos – Borrowing from Future Sales Rates – 250 bps in 14 months, More to Come Long Rates – Where Do Rates Go From Here .")
4
Income Keeps Consumers Spending Personal Income and Spending Both Series Are Year over Year % Change of 3 Month Moving Average

5
Income Keeps Consumers Spending Part II

6
Consumers Indeed Better Off Household Net Worth, Billions of Dollars 2000 Peak: $43.5 Trillion Current: $48.8 Trillion

7
Homeowners Equity and Mortgage Debt

8
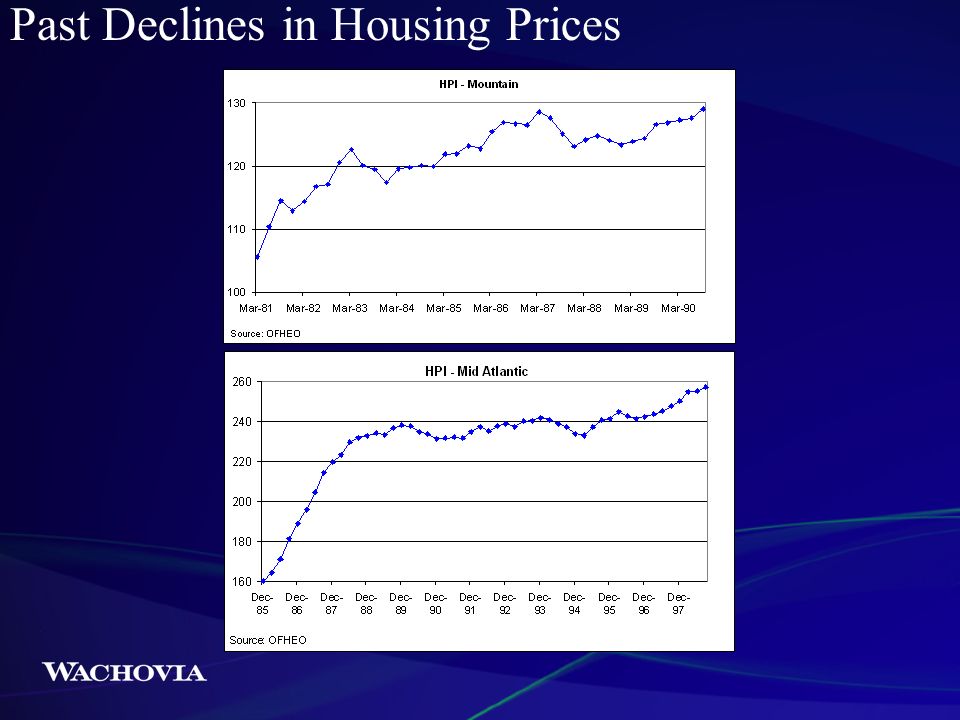
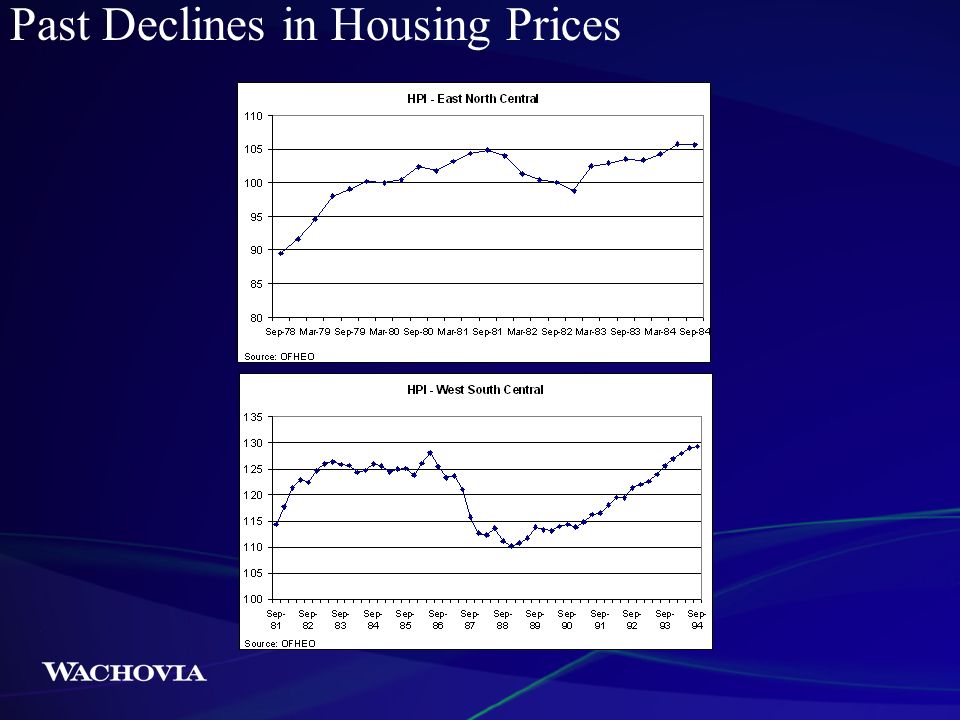
Past Declines in Housing Prices

11
Corporate Profits Revive Business Sector (In Billions of Dollars, SAAR)
")
12
Low Rates Have Helped Clean Up Balance Sheets Merrill Lynch Corporate Bond Index less Merrill Lynch Government Bond Index

13
Businesses Have Cash To Burn Both Series Are Year over Year % Change Corporate is Net Cash Flow with Inventory Valuation and Capital Consumption Adjustments, 12 quarter moving average

14
Steady Employment Gains Boost Income Nonfarm Employment Growth Monthly Change, In Thousands, Seasonally Adjusted August @ 169,000

15
Longer Term Challenges Remain U.S. Unemployment Rate by Education Level

16
Short Rates Still Accommodative, But the Gap is Closing

17
Fighting Future Inflation Productivity and Unit Labor Costs

18
Oil – Will Energy Inflation Pass Through? Personal Consumption of Gasoline and Oil as a Percent of Disposable Income Spot Price of a Barrel of Oil

19
Refined Product Prices Continue to Trend Higher

20
What About Long Term Rates? 10-Year and Inflation10-Year and Growth

21
A Little Help Net Purchases of U.S. Treasuries by the Rest of the World

22
Twin Deficits Remain a Weight Federal Budget Deficit as % of GDPCurrent Account Deficit as % of GDP

23
Government Expenditures Seasonally Adjusted Annual Rates, Billions of $

24
Entitlements: A Major Threat Going Forward Social Security, Medicare, and Medicaid Spending as a Percent of GDP Percent of GDP Note: Social Security and Medicare projections based on the intermediate assumptions of the 2004 Trustees’ Reports. Medicaid projections based on CBO’s January 2004 short-term Medicaid estimates and CBO’s December 2003 long-term Medicaid projections under mid-range assumptions. Source: GAO analysis based on data from the Office of the Chief Actuary, Social Security Administration, Office of the Actuary, Centers for Medicare and Medicaid Services, and the Congressional Budget Office. Medicare Medicaid Social Security

Similar presentations

: The total market value of goods and services.>")


 (2011) Aging Baby Boomers Their Impact on the Economy and Financial Services Industry.>")


