Download presentation
Presentation is loading. Please wait.

1
Statistics From BSCS: Interaction of experiments and ideas, 2 nd Edition. Prentice Hall, 1970 and Statistics for the Utterly Confused by Lloyd Jaisingh, McGraw-Hill, 2000

2
What is statistics? a branch of mathematics that provides techniques to analyze whether or not your data is significant (meaningful) Statistical applications are based on probability statements Nothing is “proved” with statistics Statistics are reported Statistics report the probability that similar results would occur if you repeated the experiment
 Statistical applications are based on probability statements Nothing is proved with statistics Statistics are reported Statistics report the probability that similar results would occur if you repeated the experiment.")
3
Statistics deals with numbers Need to know nature of numbers collected – Continuous variables: type of numbers associated with measuring or weighing; any value in a continuous interval of measurement. Examples: – Weight of students, height of plants, time to flowering – Discrete variables: type of numbers that are counted or categorical Examples: – Numbers of boys, girls, insects, plants

4
Can you figure out… Which type of numbers (discrete or continuous?) – Numbers of persons preferring Brand X in 5 different towns – The weights of high school seniors – The lengths of oak leaves – The number of seeds germinating – 35 tall and 12 dwarf pea plants – Answers: all are discrete except the 2 nd and 3 rd examples are continuous.
 – Numbers of persons preferring Brand X in 5 different towns – The weights of high school seniors – The lengths of oak leaves – The number of seeds germinating – 35 tall and 12 dwarf pea plants – Answers: all are discrete except the 2 nd and 3 rd examples are continuous.")
5
Populations and Samples Population includes all members of a group – Example: all 9 th grade students in America – Number of 9 th grade students at SR – No absolute number Sample – Used to make inferences about large populations – Samples are a selection of the population – Example: 6 th period Accelerated Biology Why the need for statistics? – Statistics are used to describe sample populations as estimators of the corresponding population – Many times, finding complete information about a population is costly and time consuming. We can use samples to represent a population.

6
Sample Populations avoiding Bias Individuals in a sample population – Must be a fair representation of the entire pop. – Therefore sample members must be randomly selected (to avoid bias) – Example: if you were looking at strength in students: picking students from the football team would NOT be random
 – Example: if you were looking at strength in students: picking students from the football team would NOT be random.")
7
Is there bias? A cage has 1000 rats, you pick the first 20 you can catch for your experiment A public opinion poll is conducted using the telephone directory You are conducting a study of a new diabetes drug; you advertise for participants in the newspaper and TV All are biased: Rats-you grab the slower rats. Telephone-you call only people with a phone (wealth?) and people who are listed (responsible?). Newspaper/TV-you reach only people with newspaper (wealth/educated?) and TV( wealth?).
 and people who are listed (responsible ). Newspaper/TV-you reach only people with newspaper (wealth/educated ) and TV( wealth )..")
8
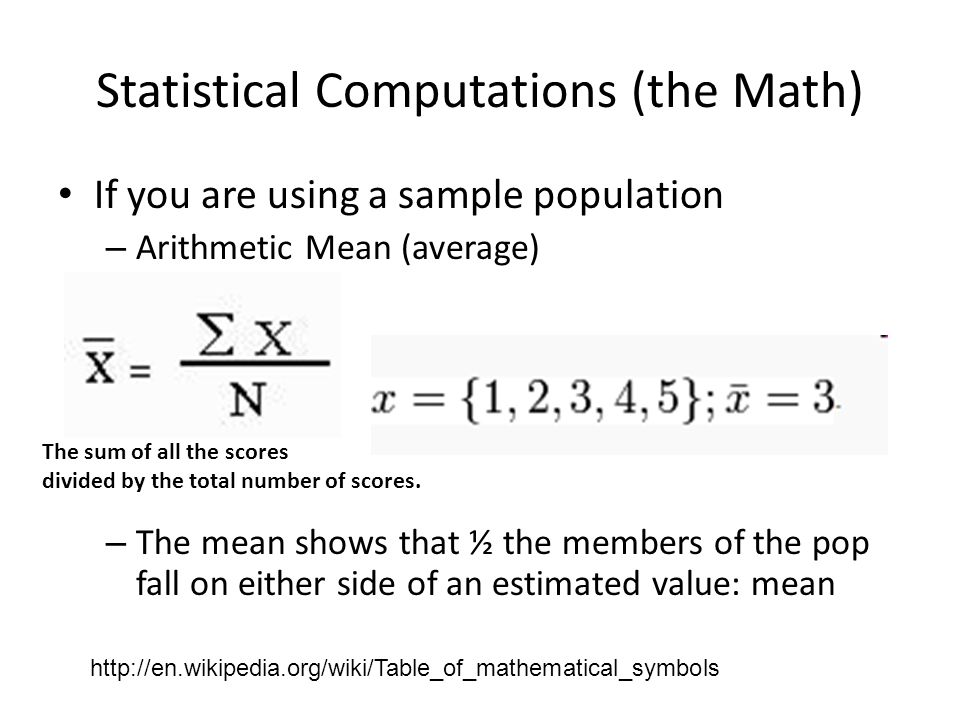
Statistical Computations (the Math) If you are using a sample population – Arithmetic Mean (average) – The mean shows that ½ the members of the pop fall on either side of an estimated value: mean The sum of all the scores divided by the total number of scores. http://en.wikipedia.org/wiki/Table_of_mathematical_symbols
9
Looking at profile of data: Distribution What is the frequency of distribution, where are the data points? Class (height of plants-cm)Number of plants in each class 0.0-0.93 1.0-1.910 2.0-2.921 3.0-3.930 4.0-4.920 5.0-5.914 6.0-6.92 Distribution Chart of Heights of 100 Control Plants
Number of plants in each class Distribution Chart of Heights of 100 Control Plants.")
10
Histogram-Frequency Distribution Charts This is called a “normal” curve or a bell curve This is an “idealized” curve and is theoretical based on an infinite number derived from a sample

11
Mode and Median Mode: most frequently seen value (if no numbers repeat then the mode = 0) Median: the middle number – If you have an odd number of data then the median is the value in the middle of the set – If you have an even number of data then the median is the average between the two middle values in the set.
 Median: the middle number – If you have an odd number of data then the median is the value in the middle of the set – If you have an even number of data then the median is the average between the two middle values in the set.")
12
Variance (s 2 ) Mathematically expressing the degree of variation of scores (data) from the mean A large variance means that the individual scores (data) of the sample deviate a lot from the mean. A small variance indicates the scores (data) deviate little from the mean
 deviate little from the mean.")
13
http://www.mnstate.edu/wasson/ed602calcvardevs.htm Calculating the variance for a whole population Σ = sum of; X = score, value, µ = mean, N= total of scores or values OR use the VAR function in Excel

14
http://www.mnstate.edu/wasson/ed602calcvardevs.htm Calculating the variance for a Biased SAMPLE population Σ = sum of; X = score, value, n -1 = total of scores or values-1 (often read as “x bar”) is the mean (average value of x i ).mean Note the sample variance is larger…why?
 is the mean (average value of x i ).mean Note the sample variance is larger…why")
15
Heights in Centimeters of Five Randomly Selected Pea Plants Grown at 8-10 °C PlantHeight (cm) Deviations from mean Squares of deviation from mean (x i )(x i - x)(x i - x) 2 A1024 B71 C6-24 D800 E911 Σ x i = 40Σ (x i - x) = 0Σ (x i - x) 2 = 10 X i = score or value; X (bar) = mean; Σ = sum of
 Deviations from mean Squares of deviation from mean (x i )(x i - x)(x i - x) 2 A1024 B71 C6-24 D800 E911 Σ x i = 40Σ (x i - x) = 0Σ (x i - x) 2 = 10 X i = score or value; X (bar) = mean; Σ = sum of")
16
Variance helps to characterize the data concerning a sample by indicating the degree to which individual members within the sample vary from the mean Finish Calculating the Variance Σ x i = 40Σ (x i - x) = 0Σ (x i - x) 2 = 10 There were five plants; n=5; therefore n-1=4 So 10/4= 2.5
 = 0Σ (x i - x) 2 = 10 There were five plants; n=5; therefore n-1=4 So 10/4= 2.5")
17
Standard Deviation An important statistic that is also used to measure variation in biased samples. S is the symbol for standard deviation Calculated by taking the square root of the variance So from the previous example of pea plants: The square root of 2.5 ; s=1.6 Which means the measurements vary plus or minus +/- 1.6 cm from the mean

18
What does “S” mean? We can predict the probability of finding a pea plant at a predicted height… the probability of finding a pea plant above 12.8 cm or below 3.2 cm is less than 1% S is a valuable tool because it reveals predicted limits of finding a particular value

19
Pea Plant Normal Distribution Curve with Std Dev

20
The Normal Curve and Standard Deviation http://classes.kumc.edu/sah/resources/sensory_processing/images/bell_curve.gif A normal curve: Each vertical line is a unit of standard deviation 68% of values fall within +1 or -1 of the mean 95% of values fall within +2 & -2 units Nearly all members (>99%) fall within 3 std dev units
 fall within 3 std dev units")
21
Standard Error of the Sample Means AKA Standard Error The mean, the variance, and the std dev help estimate characteristics of the population from a single sample So if many samples were taken then the means of the samples would also form a normal distribution curve that would be close to the whole population. The larger the samples the closer the means would be to the actual value But that would most likely be impossible to obtain so use a simple method to compute the means of all the samples

22
A Simple Method for estimating standard error Standard error is the calculated standard deviation divided by the square root of the size, or number of the population Standard error of the means is used to test the reliability of the data Example… If there are 10 corn plants with a standard deviation of 0.2 Se x = 0.2/ sq root of 10 = 0.2/3.03 = 0.006 0.006 represents one std dev in a sample of 10 plants If there were 100 plants the standard error would drop to 0.002 Why? Because when we take larger samples, our sample means get closer to the true mean value of the population. Thus, the distribution of the sample means would be less spread out and would have a lower standard deviation.

23
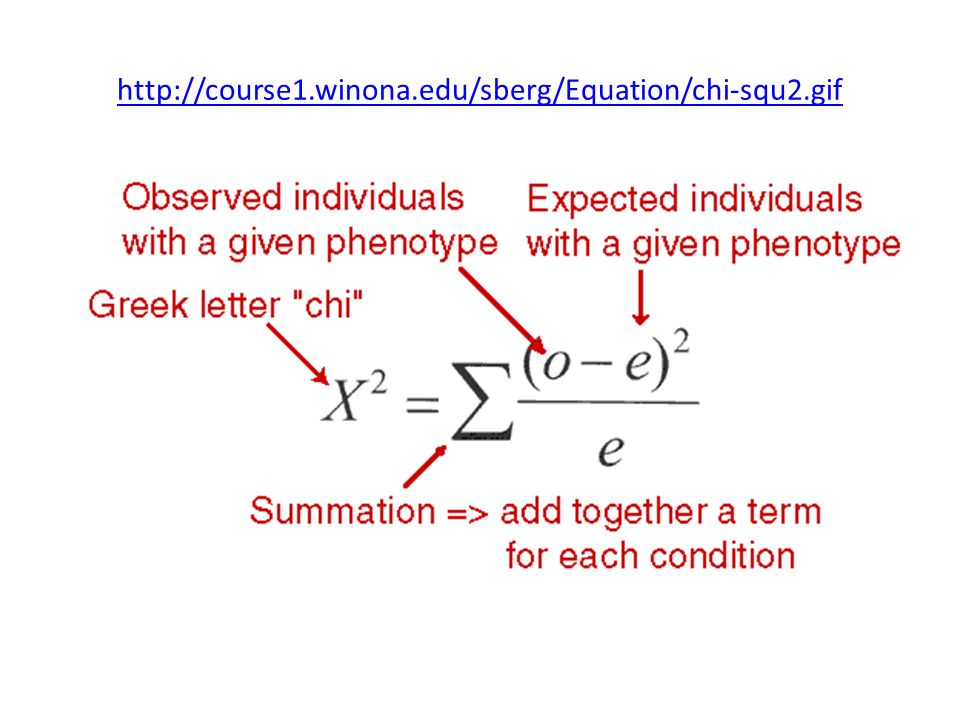
Chi square Used with discrete values Phenotypes, choice chambers, etc. Not used with continuous variables (like height… use t-test for samples less than 30 and z-test for samples greater than 30) O= observed values E= expected values http://www.jspearson.com/Science/chiSquare.html
 O= observed values E= expected values")
24
http://course1.winona.edu/sberg/Equation/chi-squ2.gif
25
Interpreting a chi square Calculate degrees of freedom # of events, trials, phenotypes -1 Example 2 phenotypes-1 =1 Generally use the column labeled 0.05 (which means there is a 95% chance that any difference between what you expected and what you observed is within accepted random chance. Any value calculated that is larger means you reject your null hypothesis and there is a difference between observed and expect values.

26
How to use a chi square chart http://faculty.southwest.tn.edu/jiwilliams/probab2.gif

Similar presentations


>")


