Download presentation
Presentation is loading. Please wait.

2
Warm up Activity The Bikini Bottom gang loves science class and
wanted to do a little research. Read the description for the experiment and use your knowledge of the scientific method to answer the questions. Flower Power SpongeBob loves to garden and wants to grow lots of pink flowers for his pal Sandy. He bought a special Flower Power fertilizer to see if it will help plants produce more flowers. He plants two plants of the same size in separate containers with the same amount of potting soil. He places one plant in a sunny window and waters it every day with fertilized water. He places the other plant on a shelf in a closet and waters it with plain water every other day. What did SpongeBob do wrong in this experiment? Explain. What should SpongeBob do to test the effectiveness of Flower Power fertilizer? Write an experiment.

5
Scientific Method No Yes Yes No Identify the Problem (Observe)
Form a Hypothesis (Problem Statement) Create an Experiment Perform the Experiment Analyze the Data Is your data inaccurate of the experiment flawed? Modify the Experiment Communicate the results Scientific Method No Yes Yes No
 Create an Experiment. Perform the Experiment. Analyze the Data. Is your data inaccurate of the experiment flawed Modify the Experiment. Communicate the results. Scientific Method. No. Yes. Yes. No.")
6
Identify the Problem/Observation
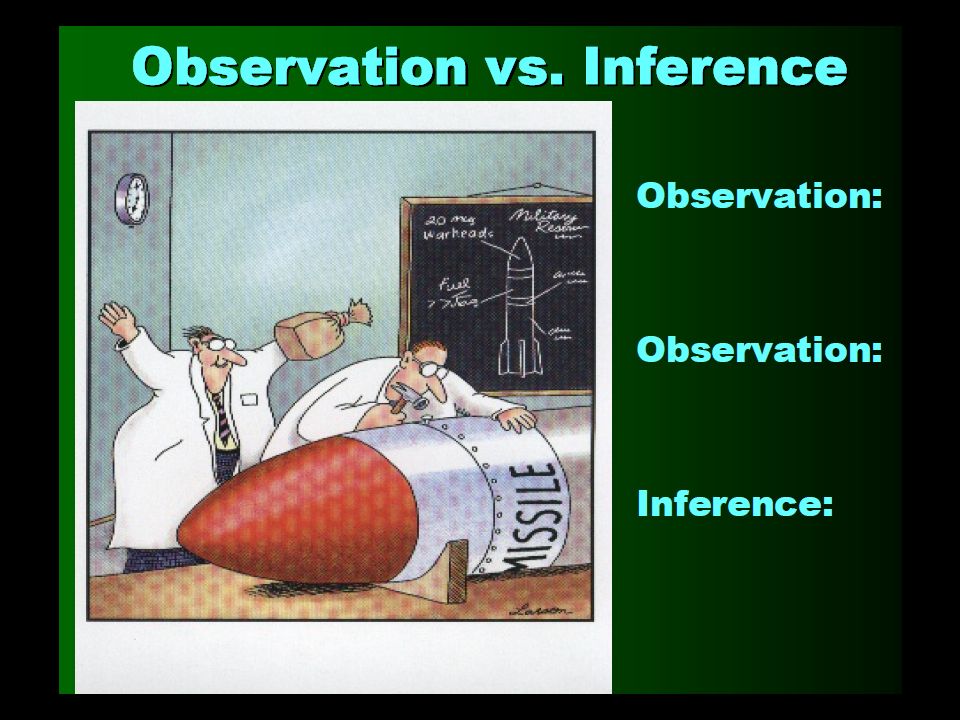
•The scientific method begins with observation. •An observation is a visible or provable fact. •An inference is an opinion, or conclusion, based on observed facts.

9
Identify the Problem/Observation

10
Important terms: Independent (manipulated) variable: condition or event under study (choose 1) .Graphing-x axis Dependent (responding) variable: condition that could change under the influence of the independent variable (measure this). Y-axis Controlled variables: conditions which could effect the outcome of the experiment so they must be held constant between groups.
 variable: condition that could change under the influence of the independent variable (measure this). Y-axis. Controlled variables: conditions which could effect the outcome of the experiment so they must be held constant between groups.")
11
Hypothesis(Problem Statement)
Does Not Have To Be An IF….THEN Statement!

14
Is your data inaccurate or the experiment flawed?
Analyze your data Is your data inaccurate or the experiment flawed?

17
Medical Science Scientific Method High Cholesterol Observation
Patient has high cholesterol Hypothesis (prediction) Certain chemicals may dissolve cholesterol deposits. Create Experiment/ Experiment Give 100 patients these chemicals, give 100 patients placebo. Analyze Data Same number lower their cholesterol as placebo patients. Revise hypothesis? Try different combo of chemicals. New test? Re-run medical test. Observe results. Results Lipitor reduces cholesterol.
 Certain chemicals may dissolve cholesterol deposits. Create Experiment/ Experiment. Give 100 patients these chemicals, give 100 patients placebo. Analyze Data. Same number lower their cholesterol as placebo patients. Revise hypothesis Try different combo of chemicals. New test Re-run medical test. Observe results. Results. Lipitor reduces cholesterol.")
18
Everyday Science Scientific Method Car Repair Observation
Engine won’t turn over. Hypothesis (prediction) Predict battery is dead. Experiment Replace battery. Analyze Data Engine now turns over. Revise hypothesis? Not needed. New test? Results Cars won’t work without a fully charged battery.
 Predict battery is dead. Experiment. Replace battery. Analyze Data. Engine now turns over. Revise hypothesis Not needed. New test Results. Cars won’t work without a fully charged battery.")
19
Making Spaghetti Sauce
Everyday Science Scientific Method Making Spaghetti Sauce Observation Spaghetti sauce should be red. Hypothesis (prediction) Try a tomato sauce. Experiment Heat pot of tomato sauce. Analyze Data Taste the sauce - bland. Revise hypothesis? Use tomato sauce and garlic! New test? Add garlic, taste - not so bland. Result The Final Recipe.
 Try a tomato sauce. Experiment. Heat pot of tomato sauce. Analyze Data. Taste the sauce - bland. Revise hypothesis Use tomato sauce and garlic! New test Add garlic, taste - not so bland. Result. The Final Recipe.")
20
Theories and Natural Laws
Theory: a description of the world that covers a relatively large number of phenomena and has met many observational and experimental tests Law of Nature: theory (or group of theories) that has been tested extensively and seems to apply everywhere in the universe-they become part of the conceptual framework of a particular field
 that has been tested extensively and seems to apply everywhere in the universe-they become part of the conceptual framework of a particular field.")
21
Specifically, scientific laws must be simple, true, universal, and absolute. They represent the cornerstone of scientific discovery, because if a law ever did not apply, then all science based upon that law would collapse. Examples: Newton's laws of motion the laws of thermodynamics Boyle's law of gases the law of conservation of mass and energy

22
Theory: what one or more hypotheses become once they have been verified and accepted to be true. an explanation of a set of related observations or events based upon proven hypotheses and verified multiple times by detached groups of researchers. ***Unfortunately, even some scientists often use the term "theory" in a more colloquial sense, when they really mean to say "hypothesis." That makes its true meaning in science even more confusing to the general public.

23
In general, both a scientific theory and a scientific law are accepted to be true by the scientific community as a whole. Both are used to make predictions of events. Both are used to advance technology.

25
Warm up Activity Super Snails
Gary is not the smartest snail in Bikini Bottom and believes he can improve his brain power by eating Super Snail Snacks. In order to test this hypothesis, he recruits SpongeBob and several snail friends to help him with the experiment. The snails ate one snack with each meal every day for three weeks. SpongeBob created a test and gave it to the snails before they started eating the snacks as well as after three weeks. Based on the data provided, do the Super Snail Snacks work? Explain your answer.

26
DRY/MIX Graphing Rules for graphing:
- important tool for expressing data so that it is easier to read and interpret Rules for graphing: --place the manipulated/independent variable (the one that was changed) on the x axis. --place the dependent/responding variable (the results of that change) on the y axis. DRY/MIX DRY MIX y scale = largest y value – smallest y value x scale = largest x value – smallest x value # of lines on the y axis # of lines on the x axis The graph should cover at least ¾ of the grid
 on the x axis. --place the dependent/responding variable (the results of that change) on the y axis. DRY/MIX. DRY. MIX. y scale = largest y value – smallest y value x scale = largest x value – smallest x value. # of lines on the y axis # of lines on the x axis. The graph should cover at least ¾ of the grid.")
27
Points to remember when graphing
Label each axis Title graph Start scale at a # that will give you a REASONABLE graph. Make sure you include all points Each axis DOES NOT have to start with the same #. Intervals All data points fit Max space is covered Draw Best Fit line (don’t connect dots)
")
28
The lines on scientific graphs are usually drawn either straight or curved. These "smoothed" lines do not have to touch all the data points, but they should at least get close to most of them. They are called best-fit lines Title Name y-axis

29
Use when comparing data from different groups

30
Use with a total of 100% or when looking at parts of a whole.

31
Use when graphing #’s vs. #’s
Use when tracking a change over time.

Similar presentations