Download presentation
Presentation is loading. Please wait.

1
Balanced Scorecard Bruce C Hartman MGT 400

2
Operating Assumptions for the Information Age Cross Functions Links in Supply Chains Customer Segments Global Scale Innovation Knowledge Workers

3
The Value Chain Customer need identified Customer Need satisfied

4
BSC as a Management System Defined top-down by strategy Balances –External and internal processes –Outcomes (lag) and drivers (lead) –Objective and subjective factors
 and drivers (lead) –Objective and subjective factors")
5
Goals of BSC Clarify and translate vision and strategy Link measures with strategic objectives Plan set targets and align Enhance feedback and learning

6
Financial Accounting vs BSC Why won’t financial accounting measure the right things? The HBS Council on Competitiveness gives these reasons. Less supportive of long term investment Emphasis on short term returns, improving current share prices Favors readily measurable returns Underinvestment in tangible assets where short term returns cannot be seen Overinvestment in acquisitions rather than internal development projects Easily valued assets rather than hard-to value assets Can operate inefficiently while short term earnings are ok. Companies with strong asset bases don’t have to exploit undervalued assets with hostile tender offers, leveraged buyouts, junk bonds.

7
Lack of Transparency A high-level committee of the AICPA on financial reporting says a more balanced(!!) approach to reporting is needed. –Provide more information about plans, opportunities, risks and uncertainties. (SWOT? E&I Audit?) –Focus more on factors that create long term value –Focus more on non-financial measures like how key processes are performing –Align info reported externally with info reported internally to senior management
 –Focus more on factors that create long term value –Focus more on non-financial measures like how key processes are performing –Align info reported externally with info reported internally to senior management.")
8
Types of Measures Outcomes –Final results: e.g.? –Lagging indicators Performance Drivers –Targets for process performance: e.g.? –Leading indicators

9
Strategy as Theory Strategy is a theory. It’s about chains of cause and effect. Can’t be proved! Only can be proved false! Based on assumptions. Strategic assumptions and plans cause decisions which causes what we do which results in outcomes. StrategyDecisions ExecutionOutcomes

10
Disproving the Theory If Strategy theory is right then: –the plans cause the decisions which cause the effects. –the Performance Drivers should change as predicted. –the Outcomes should change in the predicted direction. If a measure does not change as anticipated, what could be wrong? –An assumption could be wrong or not apply. –A causal link could not work as expected. –There might not be a causal link– only coincidental. The theory is disproved! What do we do? Modify the theory!

11
Double Loop Learning What is double loop learning? StrategyDecisionsExecution Measures let us question if assumptions are valid or causal links are effective Measures tell if we are implementing the strategy as planned.

12
How do we modify the theory? It’s like analyzing experimental results in science. Like cosmology or evolution. A company dialog is required!!

13
Types of Measures Financial Customer Internal and Business Value Chain Learning and Growth

14
Framework for Translation

15
Chain of Causality You need a mix of measures Outcomes Performance drivers

16
Where to start? Authors say: –it’s easier to drive a BSC top down than up. –Why? –it is easier to define a Balanced Scorecard for an SBU than for a complex corporation. –Why? This is based on their consulting experience.

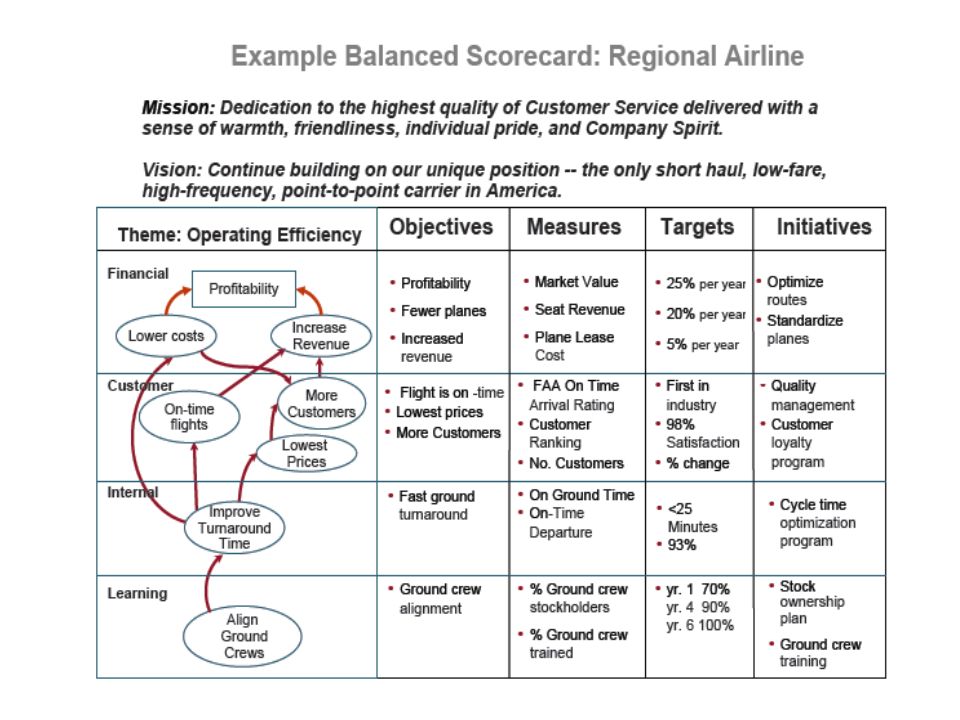
18
Example Department of Energy Procurement Unit FAA Logistics Center UCSD Oak Knoll Academy Balanced Scorecard Institute has other examples.Balanced Scorecard Institute

Similar presentations


>")


