Download presentation
Presentation is loading. Please wait.

1
Project Time Con trol

2
Control = Monitor + Compare + Analysis + Action Definition: Controlling Controlling involves making sure that the results achieved are in line with the planned results. The main feature of control is action to correct performance deviations and to insure that expected results are forthcoming. Controlling involves making sure that the results achieved are in line with the planned results. The main feature of control is action to correct performance deviations and to insure that expected results are forthcoming.

3
Process of Project Time Control 1. Establish an operational schedule. 2. Measure and report progress (Establish a progress monitoring and information feedback procedure). 3. Compare actual achievement with planned. 4. Check and analyze time progress and determine effect on completion date and milestones. 5. Plan corrective action Bring work back to schedule. Modify schedule. 6. Implement corrective action. 7. Update operational schedule. 1. Establish an operational schedule. 2. Measure and report progress (Establish a progress monitoring and information feedback procedure). 3. Compare actual achievement with planned. 4. Check and analyze time progress and determine effect on completion date and milestones. 5. Plan corrective action Bring work back to schedule. Modify schedule. 6. Implement corrective action. 7. Update operational schedule.
. 3. Compare actual achievement with planned. 4. Check and analyze time progress and determine effect on completion date and milestones. 5. Plan corrective action Bring work back to schedule. Modify schedule. 6. Implement corrective action. 7. Update operational schedule. 1. Establish an operational schedule. 2. Measure and report progress (Establish a progress monitoring and information feedback procedure). 3. Compare actual achievement with planned. 4. Check and analyze time progress and determine effect on completion date and milestones. 5. Plan corrective action Bring work back to schedule. Modify schedule. 6. Implement corrective action. 7. Update operational schedule..")
4
1.Establish Operational Schedule For project control purposes a hierarchy of schedules may be needed, depending on who will use it. Key Dates Schedule For owners and top-level management in terms of MILESTONES or KEY DATES. Key Dates Schedule For owners and top-level management in terms of MILESTONES or KEY DATES. Detailed Schedule For engineers, work supervisors, material suppliers and subcontractors. A schedule of that particular engineer/supervisor work responsibility. Provide him with a day-to-day forecast of field operations. Critical activities and free float values should be noted. Covers limited time spans (2 weeks or 30 days). Tabular listings and computer-printed bar charts are common forms. Detailed Schedule For engineers, work supervisors, material suppliers and subcontractors. A schedule of that particular engineer/supervisor work responsibility. Provide him with a day-to-day forecast of field operations. Critical activities and free float values should be noted. Covers limited time spans (2 weeks or 30 days). Tabular listings and computer-printed bar charts are common forms.
. Tabular listings and computer-printed bar charts are common forms. Detailed Schedule For engineers, work supervisors, material suppliers and subcontractors. A schedule of that particular engineer/supervisor work responsibility. Provide him with a day-to-day forecast of field operations. Critical activities and free float values should be noted. Covers limited time spans (2 weeks or 30 days). Tabular listings and computer-printed bar charts are common forms..")
5
2.Measure and Report Progress Methods Estimated number of working days req. to complete the activity. Estimated % completion of the activity. Quantities of work units put in place.Methods Estimated number of working days req. to complete the activity. Estimated % completion of the activity. Quantities of work units put in place. Equations Working days to complete = d (1 - P/100) Working days to complete = d (1 – (W/T)) Where d= total activity duration in working days P = estimated percentage of completion W= number of work units put into place. T= total number of work units associated with the activity. Based on the assumption of straight-line variation between time and work accomplishmentEquations Working days to complete = d (1 - P/100) Working days to complete = d (1 – (W/T)) Where d= total activity duration in working days P = estimated percentage of completion W= number of work units put into place. T= total number of work units associated with the activity. Based on the assumption of straight-line variation between time and work accomplishment
 Working days to complete = d (1 – (W/T)) Where d= total activity duration in working days P = estimated percentage of completion W= number of work units put into place. T= total number of work units associated with the activity. Based on the assumption of straight-line variation between time and work accomplishmentEquations Working days to complete = d (1 - P/100) Working days to complete = d (1 – (W/T)) Where d= total activity duration in working days P = estimated percentage of completion W= number of work units put into place. T= total number of work units associated with the activity. Based on the assumption of straight-line variation between time and work accomplishment.")
6
2.Measure and Report Progress How often? Balance between management benefits and costs and efforts. To serve other reports benefits such as cost control. According to project characteristics and peculiarities. Balance between management benefits and costs and efforts. To serve other reports benefits such as cost control. According to project characteristics and peculiarities. Weekly Progress reports A common procedure in many industries. Listing those activities that started, finished, or were in progress during the week and indicating their stages of completion. Must include procurement, material delivery information, ….. Chose a cutoff date, to be selected to serve both time management and labor cost accounting. A common procedure in many industries. Listing those activities that started, finished, or were in progress during the week and indicating their stages of completion. Must include procurement, material delivery information, ….. Chose a cutoff date, to be selected to serve both time management and labor cost accounting.

7
WEEKLY PROGRESS REPORT Project: Highway bridgeWeek ending: Wednesday, July 21 (working day 27) Job. No: 7903-50Prepared by: K.M. ActivityActivity Number Date Started Date Completed Percent Complete Working days to complete A110-July 151000 B115---13 C130--802 D150July 15 1000 E160July 16July 211000 2.Measure and Report Progress

8
Field Progress Narrative To accompany weekly progress reporting. Discussion of projected project features. General statement about time status. Critical or low float activities in difficulty. Potential trouble spots. Exceptionally well project areas. To accompany weekly progress reporting. Discussion of projected project features. General statement about time status. Critical or low float activities in difficulty. Potential trouble spots. Exceptionally well project areas. 2.Measure and Report Progress

9
3.Compare and Analysis of Project Progress Concerned primarily with determining the effect of the latest information on the project completion date and any milestone goals. 1 st - A quick and simple check for critical activities status. 2 nd - Check the possibility of a new critical path. Concerned primarily with determining the effect of the latest information on the project completion date and any milestone goals. 1 st - A quick and simple check for critical activities status. 2 nd - Check the possibility of a new critical path. SIGNS OF DANGER: Activities fall behind LS schedule. Resource availability delays. Realizing that time duration of future activities have been materially underestimated. Change logic becomes necessary. SIGNS OF DANGER: Activities fall behind LS schedule. Resource availability delays. Realizing that time duration of future activities have been materially underestimated. Change logic becomes necessary.

10
4.Corrective Actions When there are small delays that are within network time contingency, no action is usually required. Time Reduction Technique Otherwise use Time Reduction Technique to bring project back on schedule. Make periodic job progress meetings to enhance time management efficiency. Weekly, biweekly, monthly. Project managers, field supervisors, major subcontractors, material suppliers, and owner representative. When there are small delays that are within network time contingency, no action is usually required. Time Reduction Technique Otherwise use Time Reduction Technique to bring project back on schedule. Make periodic job progress meetings to enhance time management efficiency. Weekly, biweekly, monthly. Project managers, field supervisors, major subcontractors, material suppliers, and owner representative.

11
5.Network Updating (Rescheduling) Making necessary network corrections and re-computing activity times and float times. Concerned with determining the effect of schedule deviations and plan changes on the portions of the project yet to be constructed. Making necessary network corrections and re-computing activity times and float times. Concerned with determining the effect of schedule deviations and plan changes on the portions of the project yet to be constructed. INFORMATION NEEDED: New activities to be added. Existing activities to be deleted. Changes in the resource availability and delivery dates. Changes in the job logic. New estimate of the time required to finish unfinished activities. Changes in the scope of work. ………………………………. INFORMATION NEEDED: New activities to be added. Existing activities to be deleted. Changes in the resource availability and delivery dates. Changes in the job logic. New estimate of the time required to finish unfinished activities. Changes in the scope of work. ……………………………….

12
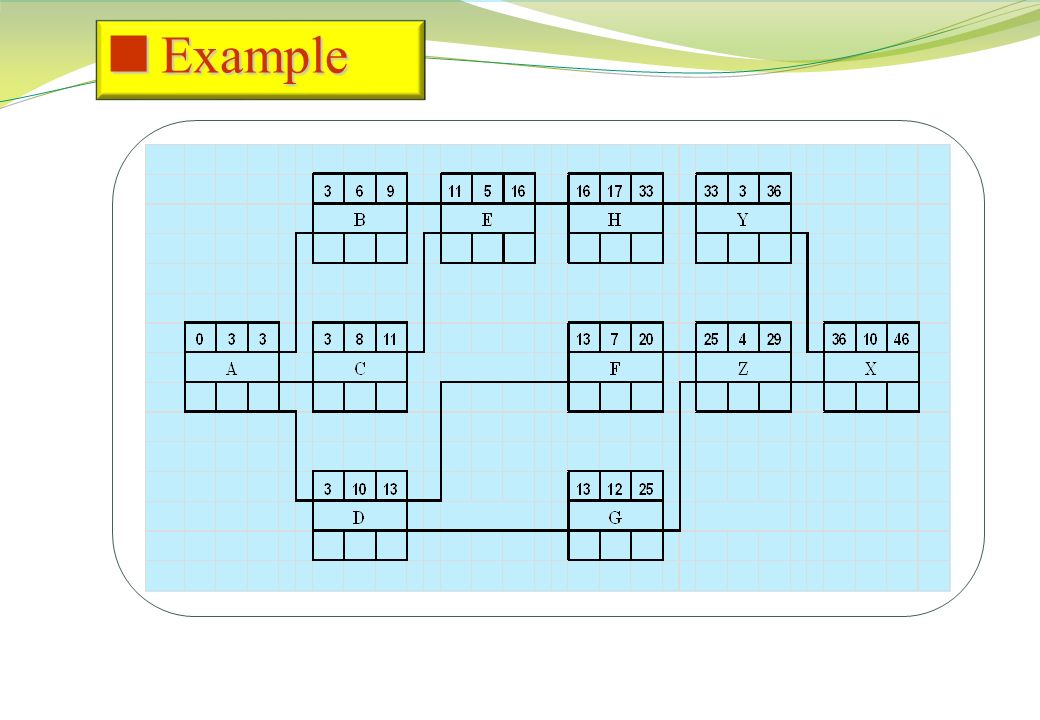
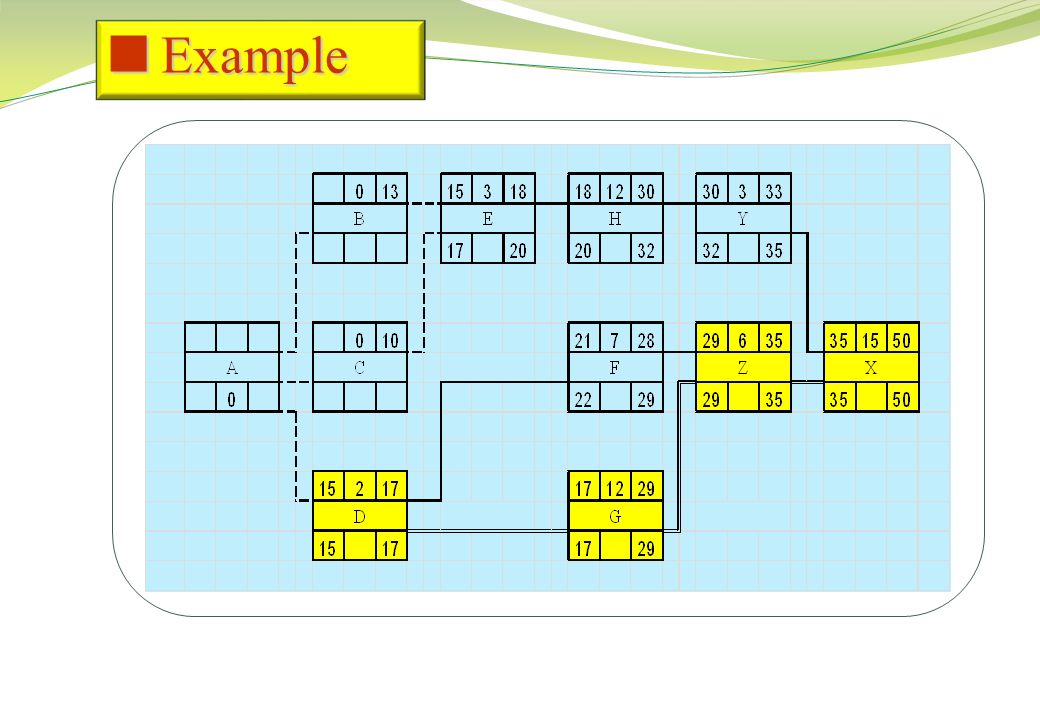
The initial AON diagram for a small engineering project is shown below with its planned activity times in days. At the end of the 15 th day, the field progress report gives you the following information: Activity “A” was completed on schedule. Activity “B” started as planned but four days were lost due to waiting for the required resources. Activity “C” was completed one day earlier. The remaining duration of Activity “D” is 2 days. The duration of activity “H” will be reduced to 12 days instead of 17 days. The activity “F” cannot start until the morning of day 22. Activity “Z” is expected to take two days more. Due to owner requirement the volume of work of activity “X” will be increased by 50%. Required: Construct the updated AON diagram, calculate the early and late start times of each activity, and indicate the critical path. The initial AON diagram for a small engineering project is shown below with its planned activity times in days. At the end of the 15 th day, the field progress report gives you the following information: Activity “A” was completed on schedule. Activity “B” started as planned but four days were lost due to waiting for the required resources. Activity “C” was completed one day earlier. The remaining duration of Activity “D” is 2 days. The duration of activity “H” will be reduced to 12 days instead of 17 days. The activity “F” cannot start until the morning of day 22. Activity “Z” is expected to take two days more. Due to owner requirement the volume of work of activity “X” will be increased by 50%. Required: Construct the updated AON diagram, calculate the early and late start times of each activity, and indicate the critical path. Example

Similar presentations


![Management Information Systems [MOIS470]](/7/1716465/big_thumb.jpg "Management Information Systems [MOIS470]>")

 Dr. Atef Z Ghalwash Faculty of Computers & Information Helwan University.>")


