Download presentation
Presentation is loading. Please wait.

1
Chapter 11: The Data Survey Supplemental Material Jussi Ahola Laboratory of Computer and Information Science

2
Contents Information theoretic measures and their calculation Features used in the data survey Cases

3
Good references Claude E. Shannon and Warren Weawer: The Mathematical Theory of Communication Thomas M. Cover and Joy A. Thomas: Elements of Information Theory David J.C. MacKay: Information Theory, Probability and Neural Networks

4
Entropy Measure of information content or ”uncertainty”: H(x) ≥ 0, with equality iff p i =1 for one i max H(x), when p i is same for every i
 ≥ 0, with equality iff p i =1 for one i max H(x), when p i is same for every i")
5
Calculating entropy

6
BIN0.00.10.20.30.40.50.60.70.80.91.0 Y11222177953 P(Y)0.025 0.05 0.0250.175 0.2250.1250.075 MEASUREACTUALNORMALIZED H max (X)=H max (Y)3.4591 H(x)3.3340.964 H(y)3.0670.887 BIN0.00.10.20.30.40.50.60.70.80.91.0 X24753444331 P(X)0.050.10.1750.1250.0750.100 0.075 0.025
 MEASUREACTUALNORMALIZED H max (X)=H max (Y) H(x) H(y) BIN X P(X)")
7
Joint and conditional entropies and mutual information Joint entropy H(X,Y) describes information content of the whole data Conditional entropy H(X|Y) measures the average uncertainty that remains about x when y is known Mutual information I(X;Y)=H(X)-H(X|Y) measures the amount of information that y conveys about x, or vice versa
 describes information content of the whole data Conditional entropy H(X|Y) measures the average uncertainty that remains about x when y is known Mutual information I(X;Y)=H(X)-H(X|Y) measures the amount of information that y conveys about x, or vice versa")
8
Calculating conditional entropy BIN0.00.10.20.30.40.50.60.70.80.91.0 P(y)0.025 0.05 0.0250.175 0.2250.1250.075 P(x|y)110.5 10.143 0.1110.20.333 BIN0.00.10.20.30.40.50.60.70.80.91.0 P(x)0.025 0.05 0.0250.175 0.2250.1250.075 P(y|x)110.5 10.143 0.1110.20.333 MEASUREACTUALNORMALIZED H(X,Y)5.3221 H(X|Y)2.2550.676 H(Y|X)1.9880.648 I(X;Y)1.0790.3518
 P(x|y) BIN P(x) P(y|x) MEASUREACTUALNORMALIZED H(X,Y) H(X|Y) H(Y|X) I(X;Y)")
9
Relationships of entropies H(X,Y) H(X) H(Y) H(X|Y)I(X;Y)H(Y|X)
 H(X) H(Y) H(X|Y)I(X;Y)H(Y|X)")
10
Features Entropies calculated from raw input and output signal states Signal H(X), H(Y): Indicates how much entropy there is in one data set input/output signal without regard to the output/input signal(s), ratio: sH/sH max
, H(Y): Indicates how much entropy there is in one data set input/output signal without regard to the output/input signal(s), ratio: sH/sH max")
11
Features Channel H(X),H(Y): Measures the average information per signal at the input/output of the communication channel, ratio: cH/sH max Channel H(X|Y),H(Y|X): Reverse/forward entropy measures how much information is known about the input/output given the output/input, ratio: cH(|)/sH max
,H(Y): Measures the average information per signal at the input/output of the communication channel, ratio: cH/sH max Channel H(X|Y),H(Y|X): Reverse/forward entropy measures how much information is known about the input/output given the output/input, ratio: cH(|)/sH max")
12
Features Channel H(X,Y): The average uncertainty over the data set as whole, ratio: cH(X,Y)/cH(X)+cH(Y) Channel I(X;Y): The amount of mutual information between input and output, ratio: cI(X,Y)/cH(Y)
: The average uncertainty over the data set as whole, ratio: cH(X,Y)/cH(X)+cH(Y) Channel I(X;Y): The amount of mutual information between input and output, ratio: cI(X,Y)/cH(Y)")
13
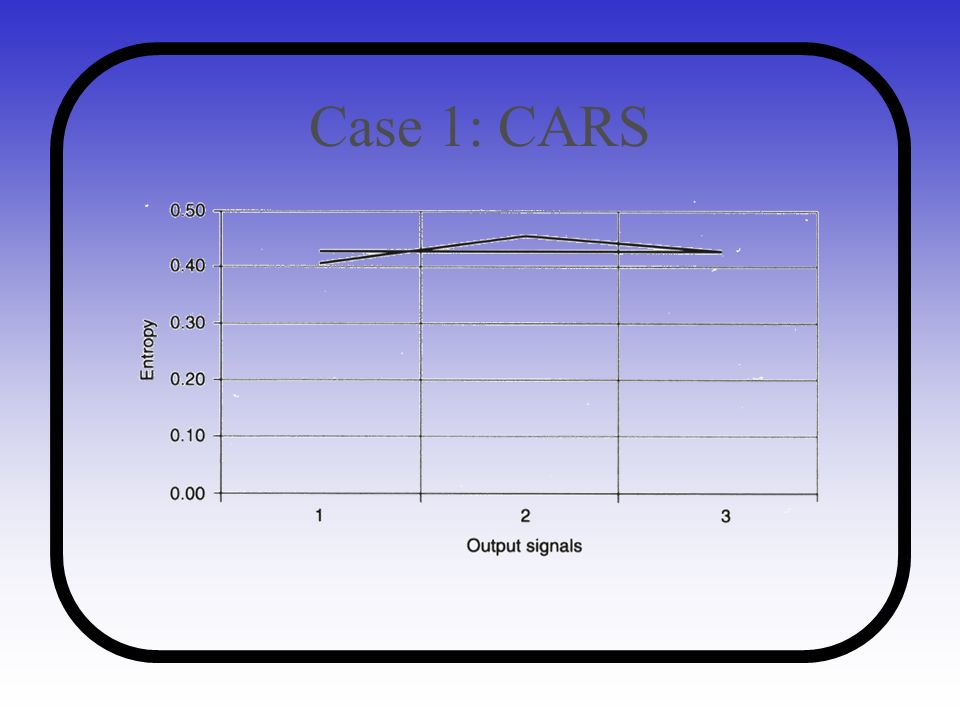
Case 1: CARS 8 variables about different car properties (brand, weight, cubic inch size, production year etc.) Three subtasks: predicting origin, brand and weigth
 Three subtasks: predicting origin, brand and weigth")
14
Case 1: CARS

17
Entropic analysis confirmed a number of intuitions about the data that would be difficult to obtain by other means Only a simple model is needed

18
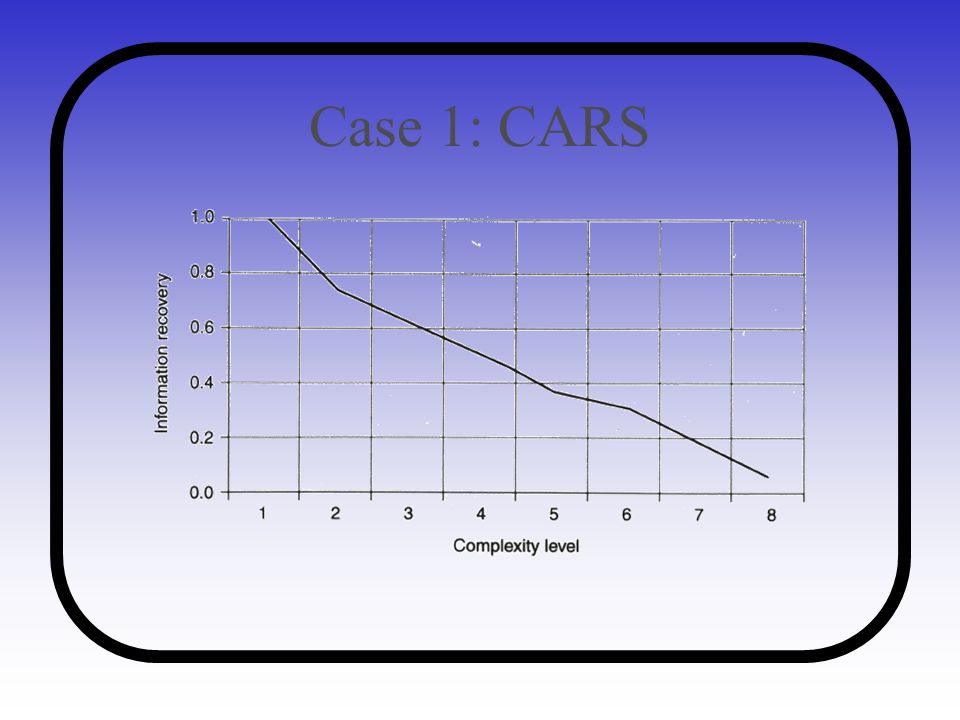
Case 1: CARS

21
Requires a complex model and still the prediction can’t be done with complete certainty Different brands have different levels of certainty

22
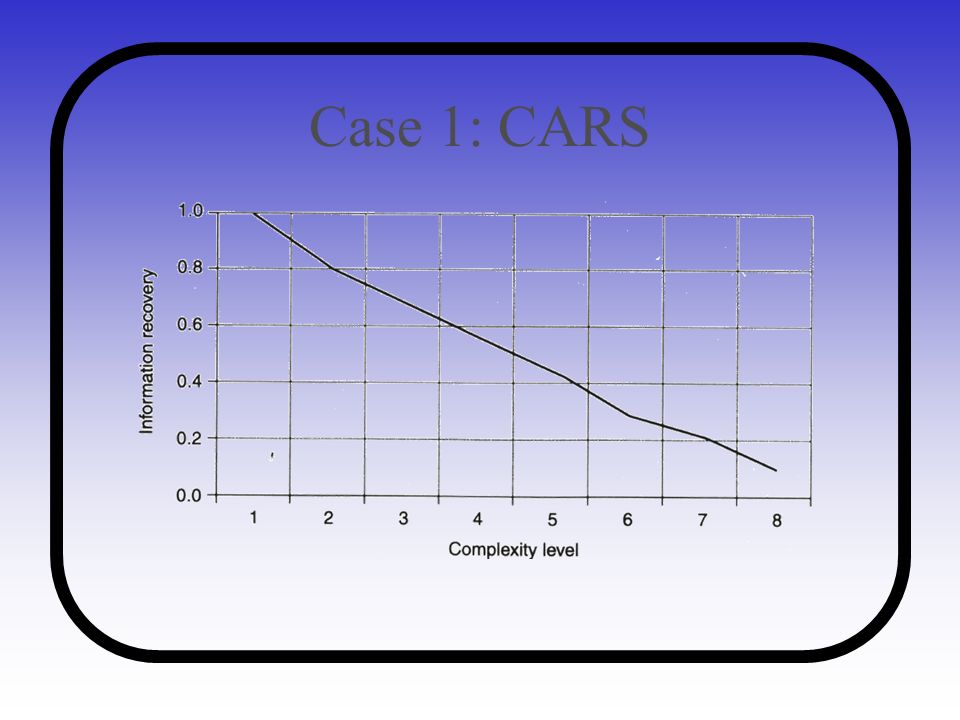
Case 1: CARS

25
Some form of generalized model has to be built The survey provides the information needed for designing the model

26
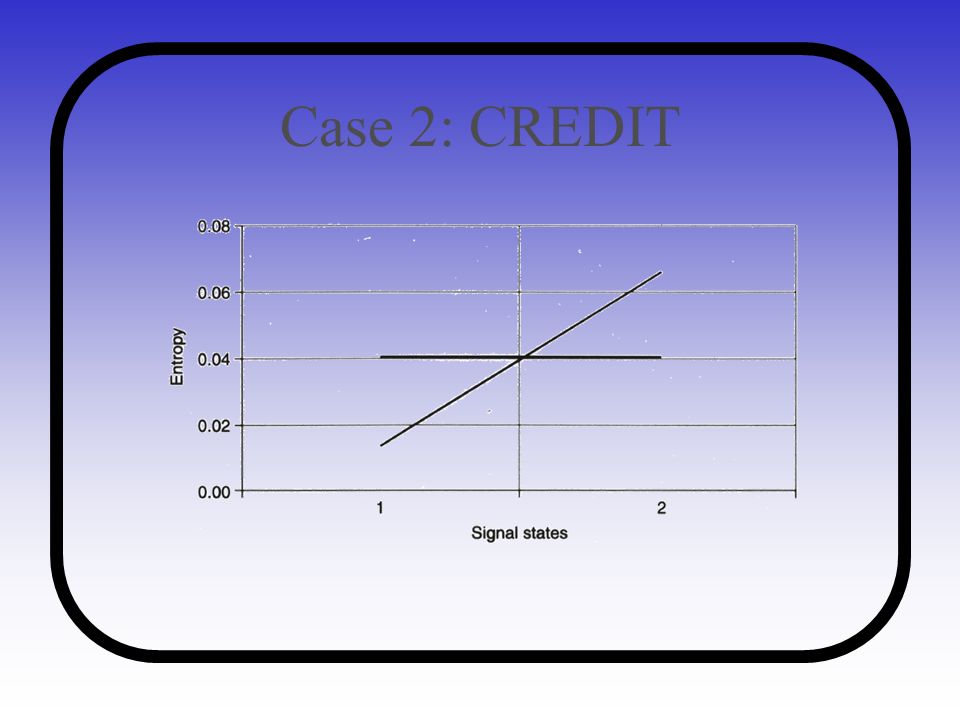
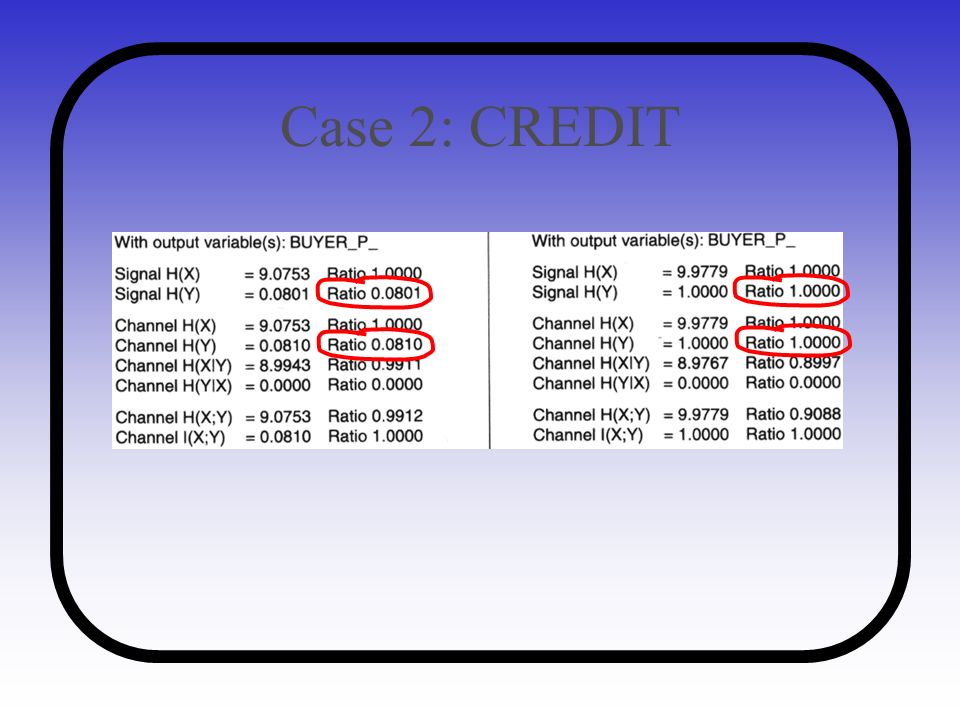
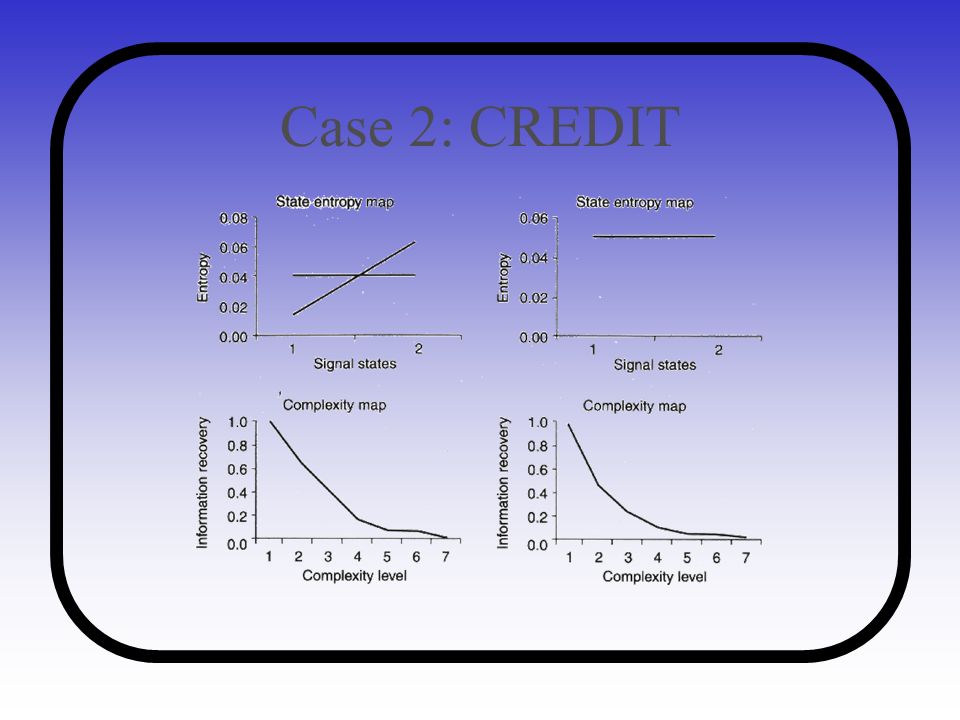
Case 2: CREDIT Included information from a credit card survey Objective was to build an effective credit card solicitation program

27
Case 2: CREDIT

33
It was possible determine that a model good enough to solve the problem could be built This model should be rather complex, even with the balanced data set

34
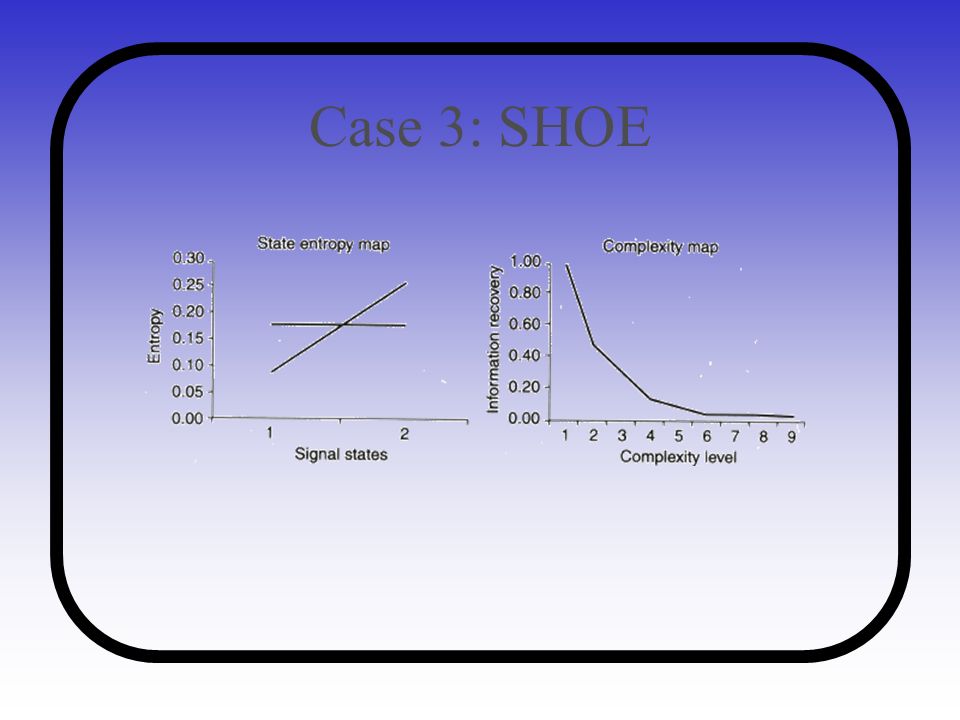
Case 3: SHOE Data was about the behaviour of buyers of a running shoe manifacturer Objective was to predict and target customers who fit the profile as potential members in their buyers program

35
Case 3: SHOE

37
A moderately good, but quite complex, model could be built Not useful predictor in the real-world, because of the frequently introduced new shoe styles

Similar presentations


 17 July 2005, Q-Logic Meets Q-Info.>")
, and output (Y= {y 0, y 1,….,y K-1 }) alphabet.>")
 response Response: which category the stimulus belongs to ? What is the “information.>")

