Download presentation
Presentation is loading. Please wait.

1
2005 Red River Valley Farm Averages Ron Dvergsten, Dean Management Education Keith Torgerson, NDSCS

2
Farms in the Annual Red River Valley Annual Report FINAN, the analysis software, allows us to take a closer look at the farms in a region or state. We can create summaries of: Farm Size (based on Gross Income) Type of Farm (based on 70% of gross income) Age of Operator Other special sorts based on location, production practices, enterprise selection and size, etc.
 Type of Farm (based on 70% of gross income) Age of Operator Other special sorts based on location, production practices, enterprise selection and size, etc..")
3
Farm Management Education Is Concerned With: 1. Creating an awareness of the need for accurate financial & enterprise records. 2. Stimulating individuals and families to establish goals and set priorities. 3. Developing the farm operator’s understanding of the function of management.

4
Farm Management Education Is Concerned With: 4. Developing fundamentals of resource management (Financial & Human). 5. Developing student skills in analyzing and interpreting farm business records. 6. Developing skills in analyzing data to improve the organization and efficiency of the farm business.
. 5. Developing student skills in analyzing and interpreting farm business records. 6. Developing skills in analyzing data to improve the organization and efficiency of the farm business..")
5
Ask Yourself these Questions. How do I compare? With my previous farm history? With local or county information? With area and statewide information? Is my farm getting the financial returns that I want or need? How do I go about making my farm business more efficient or profitable? This year is more difficult because of how much input costs varied.

6
Some Challenges For 2009 Fall Harvest Many of you spent a great deal of extra money to get the crop off. The number of Sugar Beet and Corn Acres that people could not harvest because of the wet fall Protein Discounts on Spring Wheat

7
Total Farm Assets Total farm assets decreased $49,156 over last year. (Cost) 2003 $1,040,285 2004 $1,109,799 2005 $1,072,106 2006 $1,162,753 2007 $1,319,822 2008 $1,594,701 2009 $1,545,551
 2003 $1,040, $1,109, $1,072, $1,162, $1,319, $1,594, $1,545,551.")
8
Total Farm Liabilities Total farm liabilities increased $2,797 from last year 2003 $479,715 2004 $518,780 2005 $516,592 2006 $543,610 2007 $576,908 2008 $681,055 2009 $683,852

9
Net Worth Change This year we had a positive Net Worth change of $6,849 2003 $80,856 2004 $40,762 2005 -$ 1,326 2006 $96,816 2007 $161,030 2008 $165,651 2009 $6,849

10
Farm Receipts Farm receipts decreased by $54,703 due mainly to the lower commodity prices 2003 $544,816 2004 $599,921 2005 $546,515 2006 $604,651 2007 $729,735 2008 $897,727 2009 $843,024

11
Government Payments This includes direct, crp, and disaster payments. 2003 $48,363 2004 $36,881 2005 $54,301 2006 $29,339 2007 $26,431 2008 $36,533 2009 $23,746

12
Farm Expenses Cash farm expenses were down $66,846 2003 $433,152 2004 $427,807 2005 $454,623 2006 $508,716 2007 $602,429 2008 $718,042 2009 $651,196

13
How the $738,039 was spent including family living

14
Net Farm Income This is the net cash farm income after being adjusted first for inventory change and than for depreciation This is the calculated profit for the year If more money than indicated on net farm income is spent on family living, personal taxes, and new investments, it must be taken from inventory sales, the capital replacement dollars, new borrowings, or from off farm income. It is also calculated under the cost balance sheet.

15
Net Farm Income For Valley Net farm income for farms in the Valley averaged $76,592 which was a decrease of $201,098 from 2008. Net farm income for the low 20% of the farms averaged a negative $79,432. Net farm income for the high 20% of the farms averaged $305,178 Net farm income for the people in the 40%-60% averaged $46,419

16
Net Farm Income (Profit) By Year
 By Year")
17
Some Factors That Caused the Drop in Net Farm Income High Discounts on Wheat and Corn Sales Loss in inventory value. For example, if you had 5,000 bushels of Soybeans on the beginning balance sheet that where valued @ $10.00 and you sold them for a $1 less, that would decrease net farm income by $5,000. High Input Costs Difficult Harvest Crop left in the field

18
Crops and Feed Inventory Change This year we had a negative inventory change of $70,541 compared to a positive change of $144,392 last year

19
$ Expense/$ Income This year and last year it cost a Valley farmer about 80.5 cents (accrual) compared to 64.4 cents (accrual) to make a dollar’s worth of income. This number is the operating expense ratio and does not include interest or depreciation expense.

20
Fuel Cost/Acre Decreased this Year

21
Acres Farmed Stayed Steady

22
Farm Equipment Purchases, A Good Useful Pickup is Tough to Beat.

23
Machinery Purchased Machinery purchased for the year was $125,021 up $12,734 from last year

24
Non-Farm Income and Family Living Information

25
Apparent Family Living

26
Non Farm Income Average Non Farm Income was $19,123

27
Net Return for Crops Does not include Government Transition Payments Does include Crop Insurance and RA and CRC insurance

28
Crop Yields, Costs and Returns

29
Spring Wheat Yield This year the spring wheat yield was up 1 bushel per acre 2003 61 bu 2004 64 bu 2005 42 bu 2006 53 bu 2007 48 bu 2008 63 bu 2009 64 bu

30
Spring Wheat Fertilizer Costs Per Acre

31
Spring Wheat Negative Return/Acre The net return per acre of wheat on cash rented land was positive this year 2009 Average -$21.77 Low 20% - $111.40 High 20% $49.66

32
Soybeans Net Return/Acre Soybeans returned $33.13 per acre. Average yield was 31 bu per acre

33
Corn Yields & Net Return per Acre YieldNet Return 2003 127 bu $21.84 2004105 bu -$11.63 2005145 bu $37.54 2006138 bu $51.51 2007 131 bu $140.54 2008 155 bu $132.49 2009 132 bu -$47.95

34
Corn Fertilizer Costs Per Acre

35
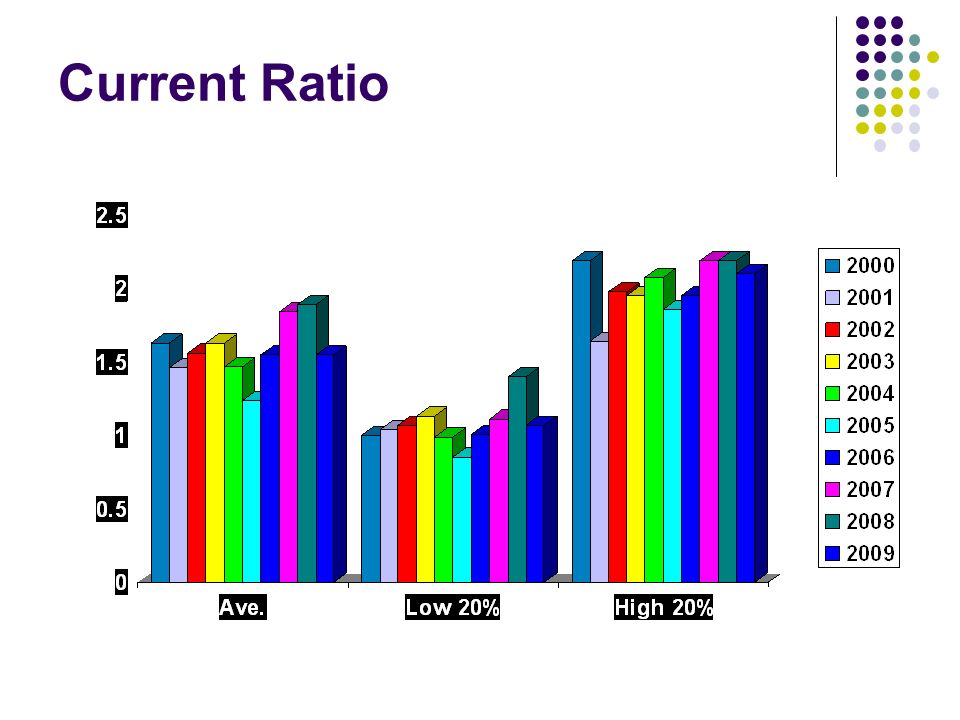
Current Ratio

37
Working Capital Decreased

38
Working Capital/Group

39
Rate of Return on Equity/Year (Cost)
")
40
Rate of Return on Equity/Group

41
Capital Replacement Dollars/Year decreased for each group

42
Capital Replacement Dollars/Group

43
Operating Expense Ratio/Year

44
Operating Expense Ratio Increased from last year

45
Net Farm Income/Year

46
Net Farm Income/Group

47
Conclusions about the ratios Start to compare your information to the last 3 to 5 years of data. Determine your own trend lines. Compare your data to the area averages. How does your business stack up? Evaluate possible changes if needed.

48
Where are we headed? Major increase in the use technology. Precision agriculture Biotechnologies (Livestock & Crops) Internet Find new Suppliers, products, markets Evaluating new technologies or products E-Commerce Are you working with partners to use capital more efficiently? Is your business a low cost producer? How about value added industries???
 Internet Find new Suppliers, products, markets Evaluating new technologies or products E-Commerce Are you working with partners to use capital more efficiently. Is your business a low cost producer. How about value added industries .")
49
We will continue to use the same tax form as in past years.

50
For more information call 1-800-959-6282 ext. 0797 1-800-342-4325 ext 2630 For More Information Farm Business Management

51
A Educational Program of North Dakota Career and Technical Education

52
Thank You

Similar presentations

 and.>")


 3. Cash Flow Statement.>")


