Download presentation
Presentation is loading. Please wait.

1
Algebra 2 Graphing Linear Inequalities in Two Variables

2
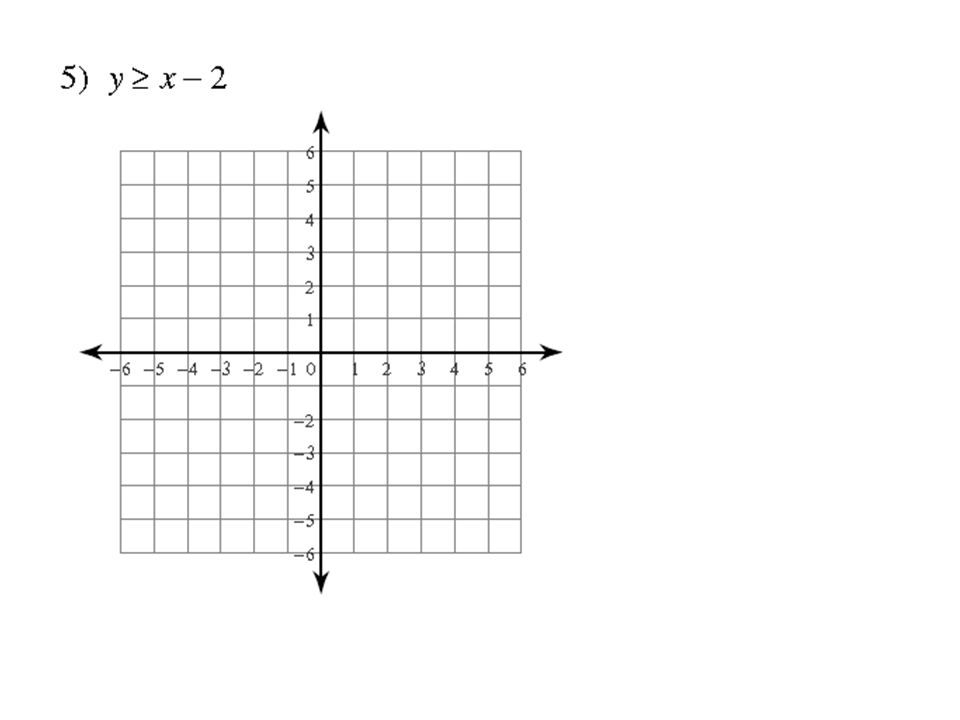
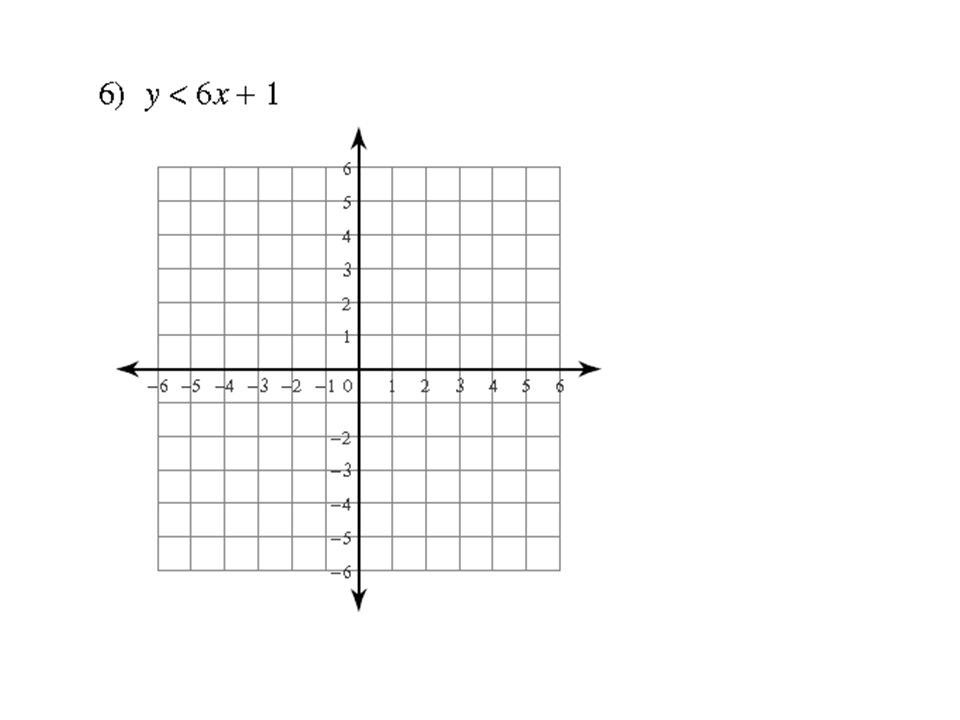
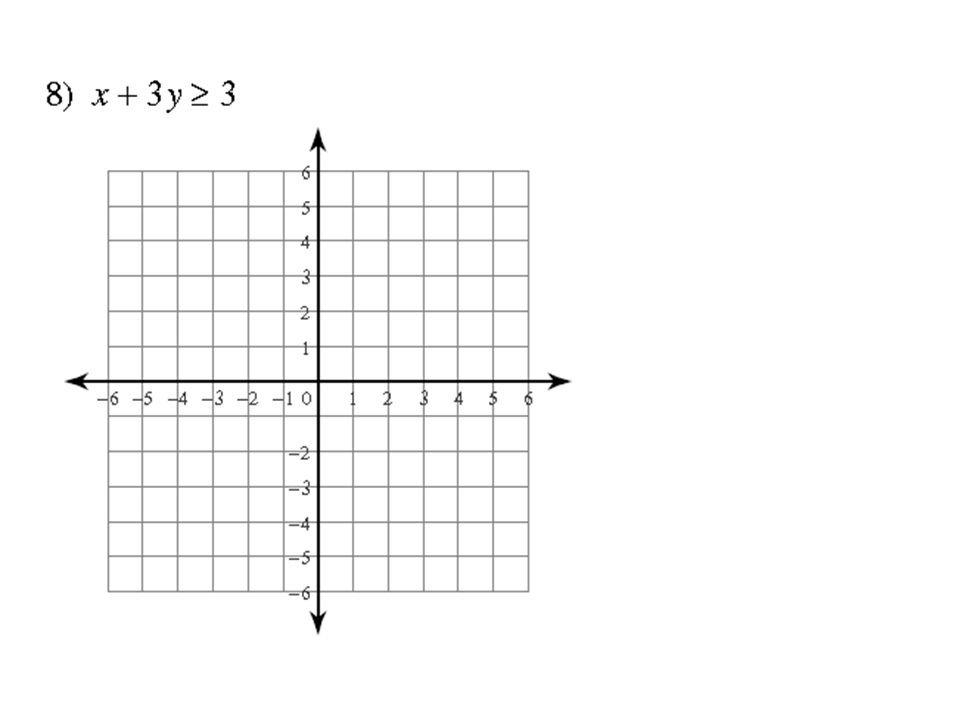
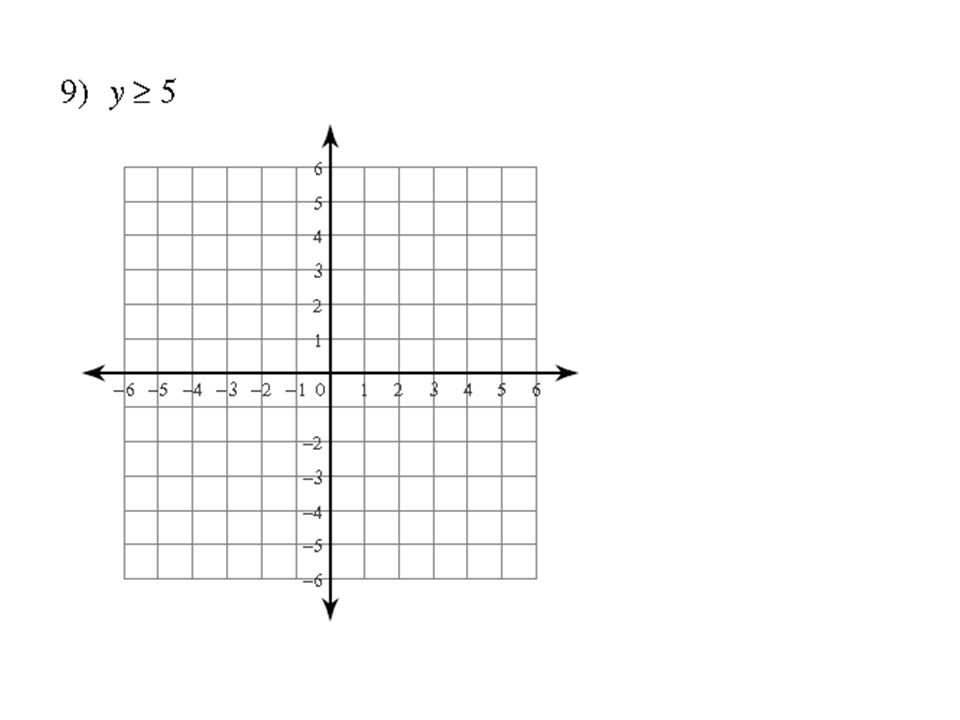
Types of Graphs of Linear Inequalities in Two Variables The lines that are graphed will be either solid or dashed based on the inequality symbol: will be dashed lines ≤ or ≥ will be solid lines One side of the line will be shaded.

3
Questions that you need to answer when graphing linear equations in two variables 1.Will the line be solid or dashed? 2.Is the line in slope-intercept form? 3.What is the slope of the line? 4.What is the y-intercept of the line? 5.Where do you start when you graph? 6.How do you find another point on your line? 7.Which side do you shade on?

4
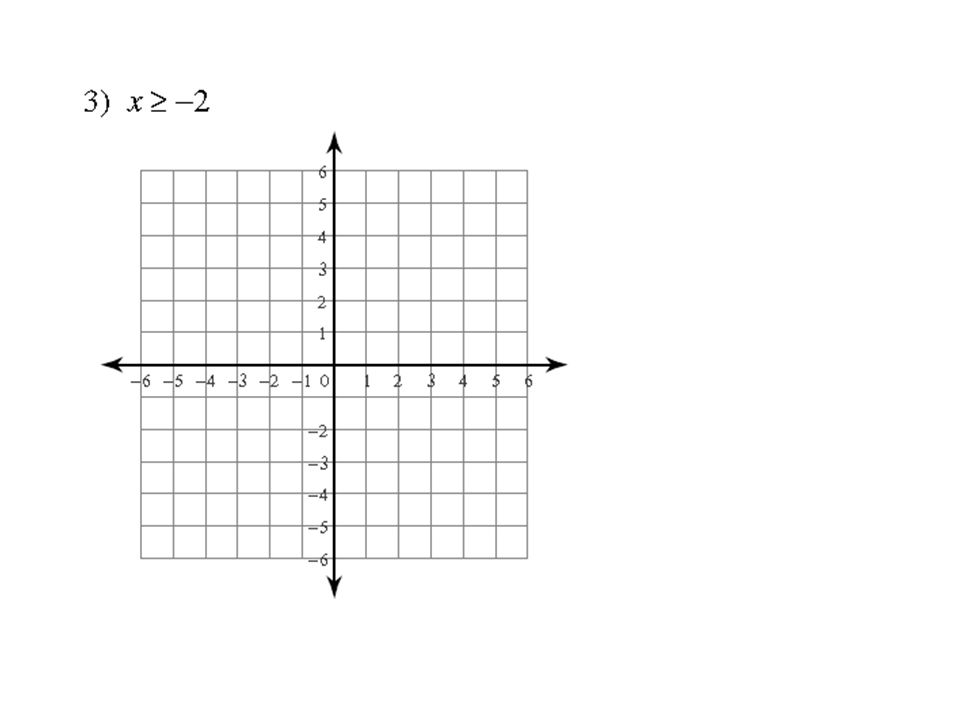
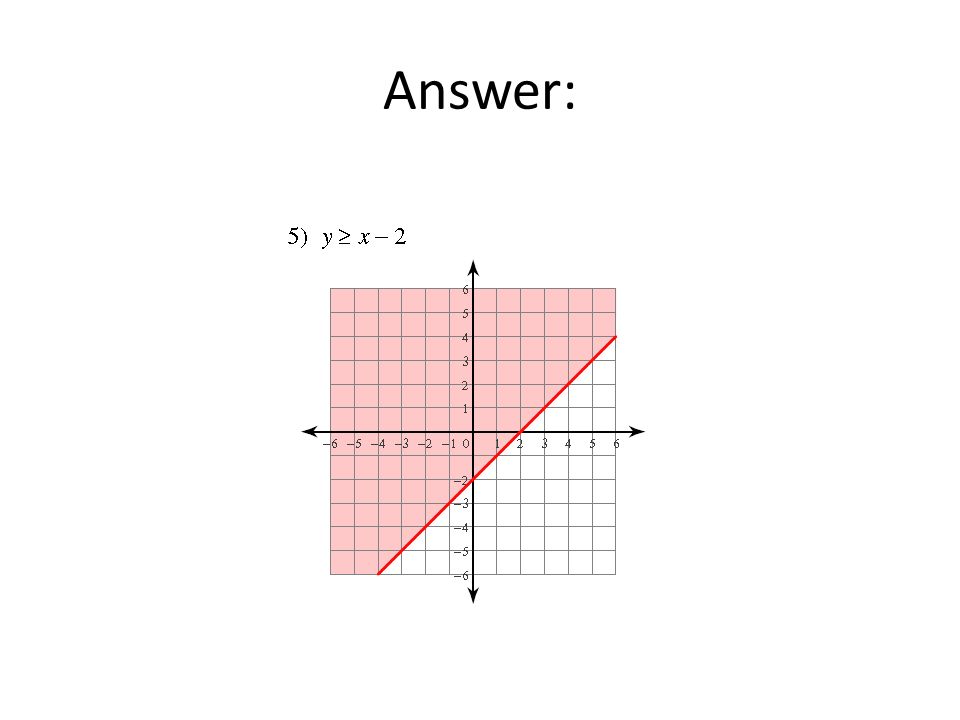
Answer: 1.Will the line be solid or dashed? Solid because ≥ 2.Is the line in slope-intercept form? yes 3.What is the slope of the line? m = -2/1 4.What is the y-intercept of the line? b = -2 5.Where do you start when you graph? (0, -2) 6.How do you find another point on your line? From (0, -2) move down 2 spaces and right one space 7.Which side do you shade on? ≥ means shade above your y-intercept
 6.How do you find another point on your line. From (0, -2) move down 2 spaces and right one space 7.Which side do you shade on. ≥ means shade above your y-intercept.")
6
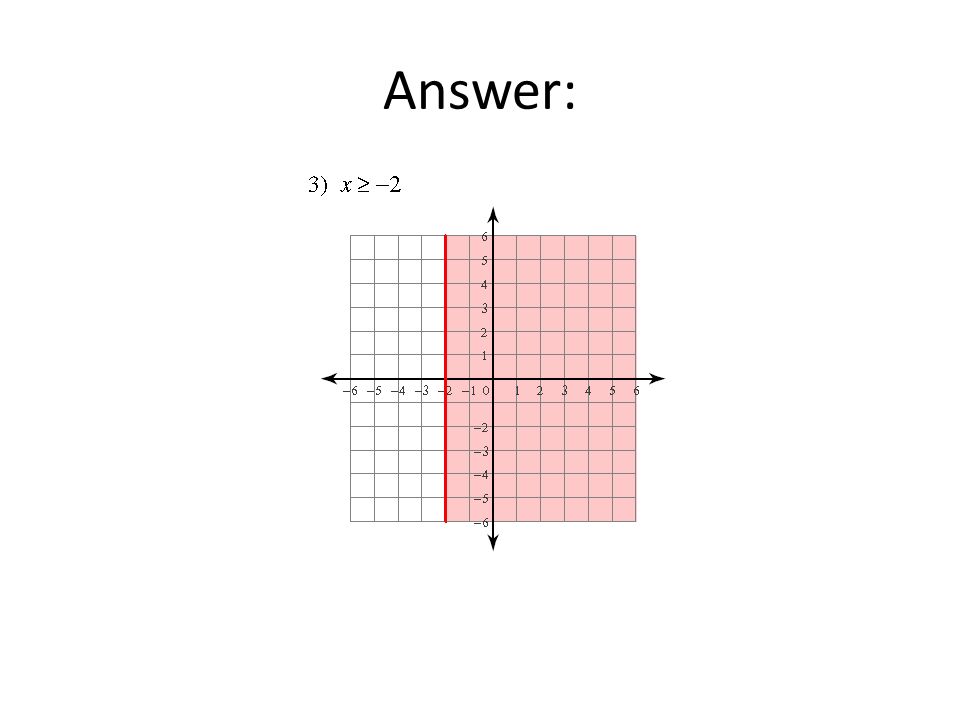
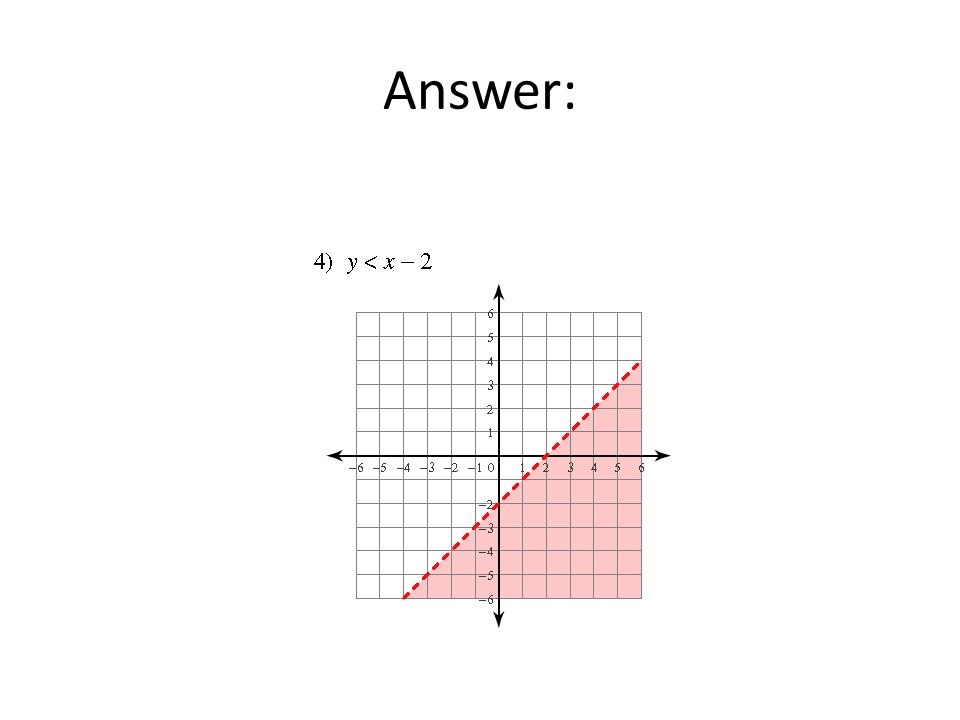
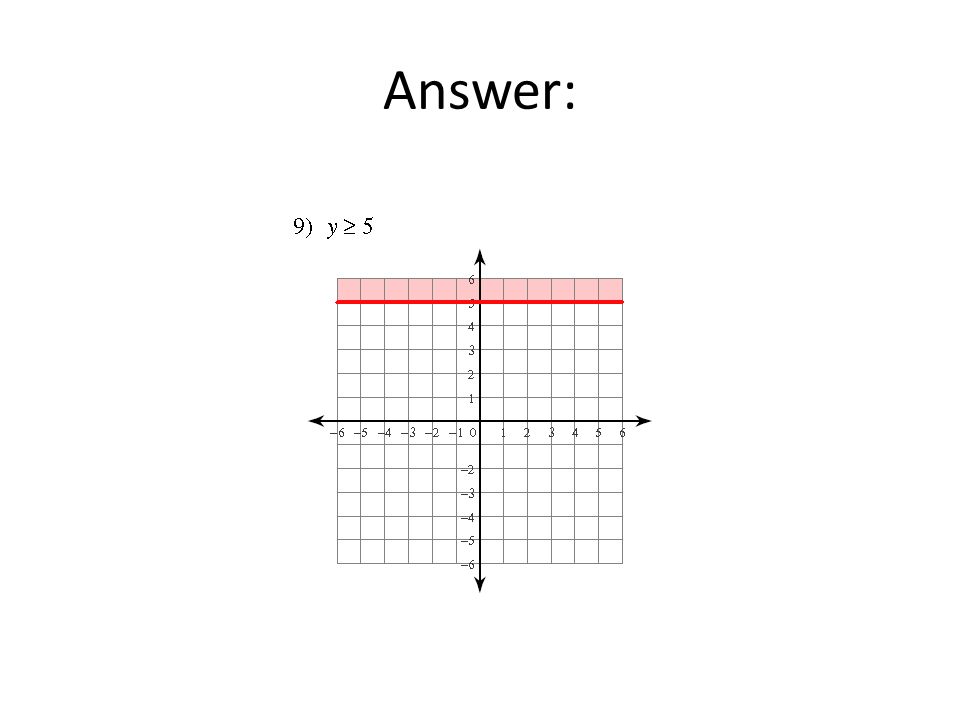
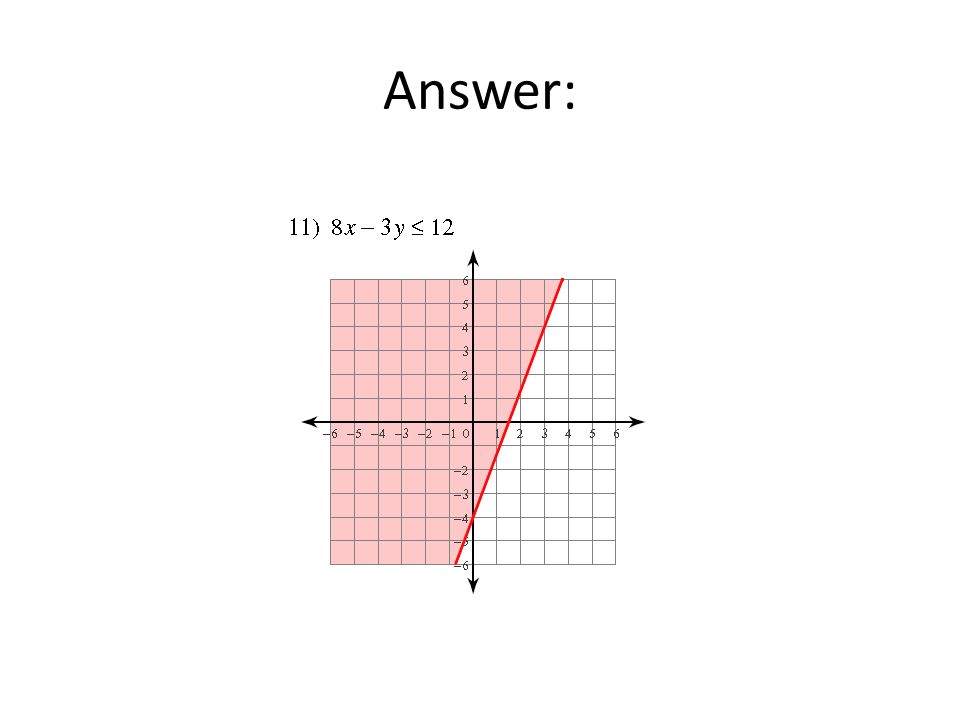
Answer:

Similar presentations


 y < – 3 and ( b ) x < 2 in a coordinate plane. Test the point (0,0). Because (0,0) is.>")
 y < –3 and ( b ) x < 2 in a coordinate plane. Test the point (0,0). Because (0,0) is.>")


>")
