Download presentation
Presentation is loading. Please wait.

1
CMS Quality Strategy Robert Anthony
Deputy Director, Quality Measurement & Value-based Incentives Group Center for Clinical standards and Quality September 17, 2015

2
Our Vision to optimize health outcomes by improving clinical quality and transforming the health system.

3
Our Three Aims Better Health for the Population Lower Cost Through
Better Care for Individuals Lower Cost Through Improvement Three-part aim: Better Care: Improve the overall quality, by making health care more patient-centered, reliable, accessible, and safe. Healthy People and Communities: Improve the health of the U.S. population by supporting proven interventions to address behavioral, social, and environmental determinants of health in addition to delivering higher-quality care. Affordable Care: Reduce the cost of quality health care for individuals, families, employers, and government.

4
National Quality Strategy promotes better health, better healthcare, and lower costs through
Make care safer by reducing harm caused in the delivery of care Ensure that each person and family are engaged as partners in their care Promote effective communication and coordination of care Promote effective prevention and treatment practices for the leading causes of mortality, starting with cardiovascular disease Work with communities to promote wide use of best practices to enable healthy living Make quality care more affordable for individuals, families, employers, and governments by developing and spreading new health care delivery models Six Priorities 4

5
The Six Priorities Have Become the Goals for the CMS Quality Strategy
Making care safer Strengthen person and family engagement Promote effective communication and coordination of care Promote effective prevention and treatment Work with communities to promote best practices of healthy living Make care affordable

6
CMS Vision for Quality Measurement
Align measures with the National Quality Strategy and Six Measure Domains Implement measures that fill critical gaps within the 6 domains Develop measures meaningful to patients and providers, focused on outcomes (including patient-reported outcomes), safety, patient experience, care coordination, appropriate use, and cost Align measures across CMS programs whenever possible Parsimonious sets of measures; core sets of measures Removal of measures that are no longer appropriate (e.g., topped out or process distal from outcome) Align measures with states, private payers, boards and specialty societies
, safety, patient experience, care coordination, appropriate use, and cost. Align measures across CMS programs whenever possible. Parsimonious sets of measures; core sets of measures. Removal of measures that are no longer appropriate (e.g., topped out or process distal from outcome) Align measures with states, private payers, boards and specialty societies.")
7
Make Care Safer Objectives Reduce inappropriate and unnecessary care
Prevent or minimize harm in all settings Improve support for a culture of safety Goal 1 Goal 2 Goal 3 Goal 4 Goal 5 Goal 6

8
Improve support for a culture of safety
Make Care Safer Objective Desired Outcomes Improve support for a culture of safety Improved application of safety practices in our programs to involve all team members, patients, and families and assure that the patient voices are heard Organizations exhibit strong leadership that educates and empowers the workforce to recognize harm and increase reporting of errors Increased access to understandable health information Expanded use of evidence-based services and primary care Disparities of care are eliminated Expand use of patient experience surveys across all settings and programs and assign higher weight in VBP programs Incorporate the measure of use of AHRQ culture of safety tools into IQR then HVBP and reward improvement Incorporate measures of harm/safe practices into all quality and VBP programs Goal 1 Goal 2 Goal 3 Goal 4 Goal 5 Goal 6

9
Reduce inappropriate and unnecessary care
Make Care Safer Objective Desired Outcomes Reduce inappropriate and unnecessary care Health care organizations continually assess events in accordance with evidence-based practices Health care cost reductions are attributed to the reduction of unnecessary, duplicative, and inappropriate care Improved achievement of patient-centered goals of care is evident Disparities of care are eliminated Publicly report Appropriate Use measures Work with OC and others to create a 5 star domain on Appropriate Use on Compare/Marketplace sites Through E&O (ODFs, Measure forums, Grand Rounds, NPCs, etc.), work with stakeholders such as NQF and others to ensure that Appropriate Use is seen as a safety issue, not just a cost issue Goal 1 Goal 2 Goal 3 Goal 4 Goal 5 Goal 6
, work with stakeholders such as NQF and others to ensure that Appropriate Use is seen as a safety issue, not just a cost issue. Goal 1. Goal 2. Goal 3. Goal 4. Goal 5. Goal 6.")
10
Prevent or minimize harm in all settings
Make Care Safer Objective Desired Outcomes Prevent or minimize harm in all settings HACs and HAIs are reduced Medication error rates are improved Falls are decreased Visibility of harm is improved in all settings Use of evidence-based services and primary care is expanded Patient and family access to understandable health information is increased Disparities of care are eliminated Use patient-centered quality measures related to harm in all models Develop new collaborative models of care that incentivize team based practice and use evidence based medicine to reduce harm Enable multi-disciplinary teamwork through sharing of best practices (LANs), coordination and collaboration Incentivize multi-disciplinary teamwork in all models to coordinate care and reduce waste Goal 1 Goal 2 Goal 3 Goal 4 Goal 5 Goal 6
, coordination and collaboration. Incentivize multi-disciplinary teamwork in all models to coordinate care and reduce waste. Goal 1. Goal 2. Goal 3. Goal 4. Goal 5. Goal 6.")
11
Partnership for Patients and QIO work: Hospital Acquired Condition (HAC) Rates Show Improvement
2010 – Preliminary data show a 9% reduction in HACs across all measures Many areas of harm dropping dramatically (2010 to 2013 for these leading indicators) Ventilator-Associated Pneumonia (VAP) Early Elective Delivery (EED) Obstetric Trauma Rate (OB) Venous thromboembolic complications (VTE) Falls and Trauma Pressure Ulcers 55.3% ↓ 52.3% ↓ 12.3% ↓ 12.0% ↓ 11.2% ↓
 Ventilator-Associated Pneumonia (VAP) Early Elective Delivery (EED) Obstetric Trauma Rate (OB) Venous thromboembolic complications (VTE) Falls and Trauma. Pressure Ulcers. 55.3% ↓ 52.3% ↓ 12.3% ↓ 12.0% ↓ 11.2% ↓")
12
Reduced Potential for Adverse Drug Events
Measurement Period n= 44,640 instances of potential adverse drug events identified and prevented d= 195,352 opportunities for adverse drug events Total Beneficiaries = 57, 657 44,640 Potential adverse drug events were prevented

13
85,149 fewer days with urinary catheters for beneficiaries
Reducing HAC in Hospitals - Fewer infections 85,149 fewer days with urinary catheters for beneficiaries

14
Strengthen Person and Family Engagement
Objectives Ensure care delivery incorporates patient and caregiver preferences Improve experience of care for patients, caregivers and families Promote patient self-management Goal 1 Goal 2 Goal 3 Goal 4 Goal 5 Goal 6

15
Strengthen Person and Family Engagement
Objective Desired Outcomes Patients are partners at all levels of care Care and treatment reflects patients’ personal values and goals Coordination and communication occurs within and across care teams, including patients, families, and caregivers Patient and family preferences are central in decision processes and implementation Joint development of treatment goals and longitudinal plans of care Information is updated and available for use by patients Achievement of patient-centered goals that focus on prevention Improved coordination and communication within and across organizations Disparities in care are eliminated Ensure all care delivery incorporates patient and caregiver preferences Collaborate with states through new delivery systems and payment models to include ways to measure how patients experience care Develop patient experience surveys for ages and settings where none exist (e.g., Home and Community-Based Services experience survey and Pediatric HCAHPS) Goal 1 Goal 2 Goal 3 Goal 4 Goal 5 Goal 6
 Goal 1. Goal 2. Goal 3. Goal 4. Goal 5. Goal 6.")
16
Strengthen Person and Family Engagement
Objective Desired Outcomes Promote patient self-management Improved application of self-management practices in our programs Improved visibility of self-management Improved support for integrated care models Increased access to understandable health information Updated and available information for use by patients Improved patient confidence in managing chronic conditions A respectful, trustworthy, transparent healthcare culture Goal 1 Goal 2 Goal 3 Goal 4 Goal 5 Goal 6

17
Promote Effective Communication and Coordination of Care
Objectives Reduce admissions and readmissions Embed best practices to manage transitions to all practice settings Enable effective health care system navigation Goal 1 Goal 2 Goal 3 Goal 4 Goal 5 Goal 6

18
Promote Effective Communication and Coordination of Care
Objective Desired Outcomes Patient self-management and activation efforts result in reduced admission and readmission rates Increased health literacy rates Survey results demonstrate measurable reduction in deficiencies related to discharge planning and care transitions Evidence based best practices that promote appropriate discharge planning and care transition are embedded in routine practice of care across the health care continuum Appropriate interventions prevent development of health conditions that require acute care Wasteful expenses from avoidable admissions and readmissions is reduced drastically All those who provide care in a particular community work in coordination to optimize patient care Reduce admissions and readmissions Goal 1 Goal 2 Goal 3 Goal 4 Goal 5 Goal 6

19
Hospital Readmissions Continue to Decline Steeply

20
Promote Effective Communication and Coordination of Care
Objective Desired Outcomes Embed best practices to manage transitions to all practice settings Integrated, patient-centric discharge tools are used across all practice settings Community-based support systems integrated with health care delivery are developed and employed Patient activation efforts and self-management training are a standard part of care Goal 1 Goal 2 Goal 3 Goal 4 Goal 5 Goal 6

21
Promote Effective Communication and Coordination of Care
Objective Desired Outcomes Enable effective health care system navigation Evidence-based best practices that enable patient activation and self-management are embedded in the routine practice of care Payer reimbursement is expanded beyond education to include chronic disease self-management education programs Cross-setting discharge planning tools that include patient and family goals and preferences are routinely employed Through focus groups and targeted communications to new duals, ensure that Medicare-Medicaid enrollees are better able to navigate their health care system Promote innovative models of integrated care across Medicare and Medicaid to streamline care Reduce misalignments across Medicare and Medicaid for Medicare-Medicaid enrollees Goal 1 Goal 2 Goal 3 Goal 4 Goal 5 Goal 6

22
Promote Effective Prevention and Treatment
Objectives Increase appropriate use of screening and prevention services Strengthen interventions to prevent heart attacks and strokes Improve quality of care for patients with multiple chronic conditions Improve behavioral health access and quality care Improve perinatal outcomes Goal 1 Goal 2 Goal 3 Goal 4 Goal 5 Goal 6

23
CMS Priorities for Measure Development
Common Adverse Events Global measure of harm? Appropriate Use of Resources Patients with Multiple Chronic Conditions Aligning measures and incentives across providers Actively monitor for unintended consequences Advance science on Patient-Reported Outcome Measures De novo e-measure development

24
Work with Communities to Promote Best Practices of Healthy Living
Objectives Partner with and support federal, state, and local public health improvement efforts Improve access within communities to best practices of healthy living Promote evidence-based community interventions to prevent and treat chronic disease Increase use of community-based social supports Goal 1 Goal 2 Goal 3 Goal 4 Goal 5 Goal 6

25
Work with Communities to Promote Best Practices of Healthy Living
Objective Desired Outcomes Partner with and support federal, state, and local public health improvement efforts Promote interoperability of health IT systems Improved population health outcomes Reduced disparities in health outcomes Reduced health care costs through better coordination across sectors Goal 1 Goal 2 Goal 3 Goal 4 Goal 5 Goal 6

26
Make Care Affordable Objectives Develop and implement payment systems that reward value over volume Use cost analysis data to inform payment policies Goal 1 Goal 2 Goal 3 Goal 4 Goal 5 Goal 6

27
Delivery system and payment transformation
Current State – Producer-Centered Volume Driven Unsustainable Fragmented Care FFS Payment Systems Future State – People-Centered Outcomes Driven Sustainable Coordinated Care New Payment Systems (and many more) Value-based purchasing ACOs, Shared Savings Episode-based payments Data Transparency PRIVATE SECTOR PUBLIC SECTOR
 Value-based purchasing. ACOs, Shared Savings. Episode-based payments. Data Transparency. PRIVATE. SECTOR. PUBLIC. SECTOR.")
28
Medicare Per Capita Spending Growth at Historic Lows
*Medicare Part D prescription drug benefit implementation, Jan 2006 27% 28% Source: CMS Office of the Actuary

29
Framework for Progression of Payment to Clinicians and Organizations in Payment Reform
Category 1: Fee for Service – No Link to Quality Category 2: Fee for Service – Link to Quality Category 3: Alternative Payment Models on Fee-for Service Architecture Category 4: Population-Based Payment Description Payments are based on volume of services and not linked to quality or efficiency At least a portion of payments vary based on the quality or efficiency of health care delivery Some payment is linked to the effective management of a population or an episode of care Payments still triggered by delivery of services, but, opportunities for shared savings or 2-sided risk Payment is not directly triggered by service delivery so volume is not linked to payment Clinicians and organizations are paid and responsible for the care of a beneficiary for a long period (eg, >1 yr) Examples Medicare Limited in Medicare fee-for-service Majority of Medicare payments now are linked to quality Hospital value-based purchasing Physician Value-Based Modifier Readmissions/Hospital Acquired Condition Reduction Program Accountable Care Organizations Medical Homes Bundled Payments Eligible Pioneer accountable care organizations in years 3 – 5 Some Medicare Advantage plan payments to clinicians and organizations Some Medicare-Medicaid (duals) plan payments to clinicians and organizations Medicaid Varies by state Primary Care Case Management Some managed care models Integrated care models under fee for service Managed fee-for-service models for Medicare-Medicaid beneficiaries Medicaid Health Homes Medicaid shared savings models Medicaid waivers for delivery reform incentive payments Episodic-based payments Some Medicaid managed care plan payments to clinicians and organizations This slide describes the framework for transition from pure FFS to population based payments and alternative payment structure Relevant for CMS and private payers Within CMS programs, category 1 is now significantly in the minority – most programs are in category 2 Our goal is to move an increasingly large share of total payments to all providers from FFS to models that explicitly reward value – quality and efficiency Will be a steep learning curve – ultimately you want to align the CQMs across public and private payers as well as the payment systems, but will need time for payers (incl. CMS) to experiment with different models to best understand “what works” in which circumstances/environments. Rajkumar R, Conway PH, Tavenner M. The CMS—Engaging Multiple Payers in Risk-Sharing Models. JAMA. Doi: /jama
 Examples. Medicare. Limited in Medicare fee-for-service. Majority of Medicare payments now are linked to quality. Hospital value-based purchasing. Physician Value-Based Modifier. Readmissions/Hospital Acquired Condition Reduction Program. Accountable Care Organizations. Medical Homes. Bundled Payments. Eligible Pioneer accountable care organizations in years 3 – 5. Some Medicare Advantage plan payments to clinicians and organizations. Some Medicare-Medicaid (duals) plan payments to clinicians and organizations. Medicaid. Varies by state. Primary Care Case Management. Some managed care models. Integrated care models under fee for service. Managed fee-for-service models for Medicare-Medicaid beneficiaries. Medicaid Health Homes. Medicaid shared savings models. Medicaid waivers for delivery reform incentive payments. Episodic-based payments. Some Medicaid managed care plan payments to clinicians and organizations. This slide describes the framework for transition from pure FFS to population based payments and alternative payment structure. Relevant for CMS and private payers. Within CMS programs, category 1 is now significantly in the minority – most programs are in category 2. Our goal is to move an increasingly large share of total payments to all providers from FFS to models that explicitly reward value – quality and efficiency. Will be a steep learning curve – ultimately you want to align the CQMs across public and private payers as well as the payment systems, but will need time for payers (incl. CMS) to experiment with different models to best understand what works in which circumstances/environments. Rajkumar R, Conway PH, Tavenner M. The CMS—Engaging Multiple Payers in Risk-Sharing Models. JAMA. Doi: /jama")
30
ACO Participation is Growing Rapidly
ACO-Assigned Beneficiaries by County 360+ ACOs have been established, including 123 new Shared Savings ACOs for 2014 5.3 million assigned beneficiaries in 47 states, plus DC and PR

31
Value-Based Purchasing
7 Value-Based Purchasing Goal is to reward providers and health systems that deliver better outcomes in health and health care at lower cost to the beneficiaries and communities they serve. Five Principles Define the end goal, not the process for achieving it All providers’ incentives must be aligned Right measure must be developed and implemented in rapid cycle CMS must actively support quality improvement Clinical community and patients must be actively engaged VanLare JM, Conway PH. Value-Based Purchasing – National Programs to Move from Volume to Value. NEJM July 26, 2012 31

32
Focusing on Outcomes Focusing on the end results of care and not the technical approaches that providers use to achieve the results Measure 30 day mortality rates, hospital-acquired infections, etc… Determine if desired clinical results are achieved (low re-admissions, weight reduction, etc…)
")
33
Challenges in Measuring Performance
Determining indicators of outcomes that reflect national priorities Recognizing that outcomes are usually influenced by multiple factors Determining thresholds for ‘good’ performance Recognizing that Process Measures don’t always predict outcomes

34
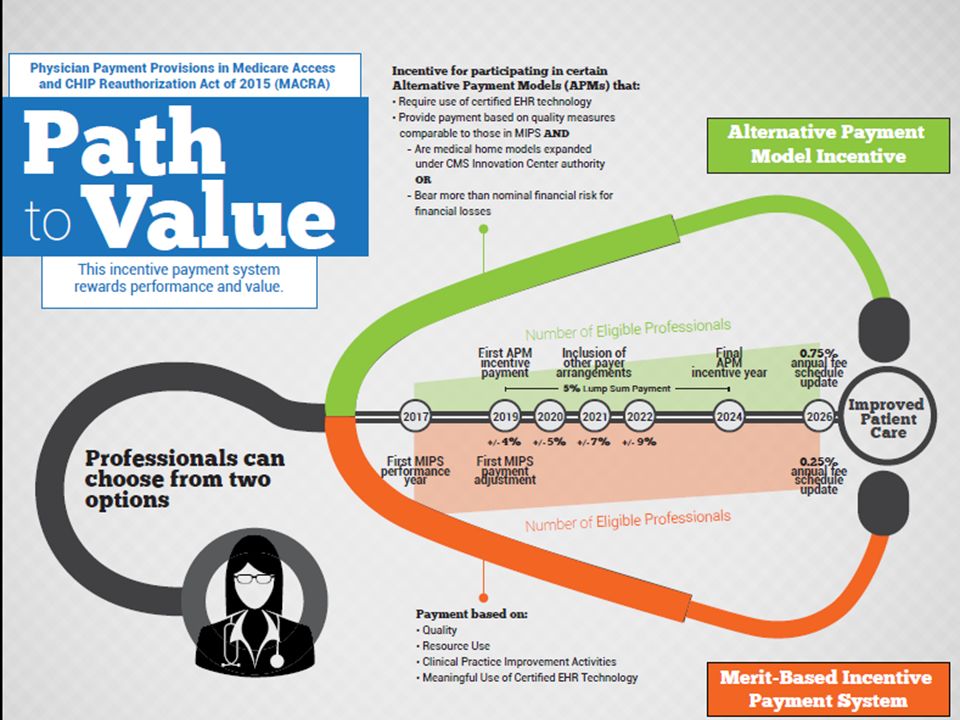
Medicare Access and CHIP Reauthorization Act of 2015 (MACRA)
Passed House 3/26/2015- Senate 4/14/2015 Signed into Law 4/16/2015 Repeals 1997 Sustainable Growth Rate Physician Fee Schedule (PFS) Update Changes Medicare PFS Payment Merit-Based Incentive Payment System (MIPS) Incentives for participation in Alternate Payment Model (APM) Jon Stewart- “only took 17 years”
 Update. Changes Medicare PFS Payment. Merit-Based Incentive Payment System (MIPS) Incentives for participation in Alternate Payment Model (APM) Jon Stewart- only took 17 years")
35
MIPS & APM Incentives Separate application of payment adjustments under PQRS, VM, and EHR-MU will sunset Dec. 31, 2018 January 1, 2019 – MIPS and APM incentive payments begin EPs can participate in MIPS or meet requirements to be qualifying APM participant MIPS – Can receive positive, negative or zero payment adjustment APM Participant – If criteria are met, can receive 5 percent incentive payment for 6 years

36
Merit-Based Incentive Payment System (MIPS)
Jan 1, MIPS payment adjustment begins Under MIPS the Secretary must develop a methodology to assess EP performance and determine a composite performance score Features of PQRS, the Value Modifier and the EHR Meaningful Use program are included in MIPS The score is used to determine and apply a MIPS payment adjustment factor for 2019 onward Adjustment Can Be Positive, Negative, or Zero

37
More on MIPS 4 Performance Categories Quality measures (30% of Score)
Resource Use measures (30% of Score) Counts for not more than 10% in 2019 and 15% in 2020; additional weight of at least 20% and 15%, respectively, are added to the Quality score in those years Clinical Improvement Activities (15% of Score) Sub-Categories- Includes Better Off-Hours Access, Care Coordination Patient Safety, Beneficiary Engagement Others as Determined by Secretary Meaningful Use of EHRs (25% of Score) On EHR- current MU statute is all or nothing. No sliding scale. Legal comment: Quality Domain amounts could be higher than 20% and 15%, depending on the percentage applied under section 1848(q)(5)(E)(i)(II)(bb). We believe the language "not more" in that section gives the Secretary discretion to specify percentages for Resource Use of less than 10% and 15% for 2019 and 2020, respectively. Thus, using 2019 as an example, if Resource Use is 8%, then Quality would be increased by 30%-8%=22%.
 Counts for not more than 10% in 2019 and 15% in 2020; additional weight of at least 20% and 15%, respectively, are added to the Quality score in those years. Clinical Improvement Activities (15% of Score) Sub-Categories- Includes Better Off-Hours Access, Care Coordination. Patient Safety, Beneficiary Engagement. Others as Determined by Secretary. Meaningful Use of EHRs (25% of Score) On EHR- current MU statute is all or nothing. No sliding scale. Legal comment: Quality Domain amounts could be higher than 20% and 15%, depending on the percentage applied under section 1848(q)(5)(E)(i)(II)(bb). We believe the language not more in that section gives the Secretary discretion to specify percentages for Resource Use of less than 10% and 15% for 2019 and 2020, respectively. Thus, using 2019 as an example, if Resource Use is 8%, then Quality would be increased by 30%-8%=22%.")
38
More on MIPS CMS will propose the initial policies for the MIPS in CY2017 PFS Rule Making - proposed rule published around June 2016 CMS must make available timely (“such as quarterly”) confidential feedback reports to each MIPS EP starting July 1, 2017 Beginning July 1, 2018, CMS must make available to each MIPS EP information about items and services furnished to the EP’s patients by other providers and suppliers for which payment is made under Medicare Information about the performance of MIPS EPs must be made available on Physician Compare
 confidential feedback reports to each MIPS EP starting July 1, Beginning July 1, 2018, CMS must make available to each MIPS EP information about items and services furnished to the EP’s patients by other providers and suppliers for which payment is made under Medicare. Information about the performance of MIPS EPs must be made available on Physician Compare.")
39
MIPS & Measures Nov 1st each year, CMS to publish measure list for MIPS Update, add, revise list for coming performance period MACRA explicitly states to emphasize outcome measures CMS may use: Inpatient hospital measures for MIPS EPs Outpatient hospital measures may be used for emergency physicians, radiologists, & anesthesiologists. Population based measures are allowed for MIPS In selecting MIPS measures and applying the MIPS formula, Secretary shall give consideration to “non-patient facing” specialties

40
MIPS – Resource Use To measure resource use, MACRA requires CMS to develop: Care episode and patient condition groups and classification codes; Patient relationship categories and codes, which include: Primary responsibility for ongoing patient care over extended periods of time Lead EP during acute care episode- including coordinating items & services by other EPs Supporting EP during acute care episode providing continuing items, & services (but not lead) EP providing occasional items & services; upon request of another EP EP providing items & services as ordered by another EP April 2016 – CMS to publish proposed codes online. Stakeholder feedback comment period (4 months) April 2017 – Final categories & codes published. Revisions allowed Nov. 1, 2018 then every Nov. 1st thereafter.
 EP providing occasional items & services; upon request of another EP. EP providing items & services as ordered by another EP. April 2016 – CMS to publish proposed codes online. Stakeholder feedback comment period (4 months) April 2017 – Final categories & codes published. Revisions allowed Nov. 1, 2018 then every Nov. 1st thereafter.")
41
MIPS - Clinical Practice Improvement Activities
Expanded Practice Access Same day appointments for urgent needs After hours clinician advice Population Management Monitoring health conditions & providing timely intervention Participation in a qualified clinical data registry Care Coordination Timely communication of test results Timely exchange of clinical information with patients AND providers Use of remote monitoring Use of telehealth Beneficiary Engagement Establishing care plans for complex patients Beneficiary self-management assessment & training Employing shared decision making Measures

42
MIPS Composite Performance Score
Performance assessment in four categories using weights established in the statute Weights may be adjusted if there are not sufficient measures and activities applicable for each type of EP, including assigning a scoring weight of 0 for a performance category. EHR weighting can be decreased and shifted to other categories if Secretary estimates the proportion of physicians who are meaningful EHR users is 75% or greater (statutory floor for EHR weight is 15%) Performance threshold will be established based on the mean or median of the composite performance scores during a prior period The composite performance score will range from 0 – 100 The score will assess achievement & improvement (when data available) Hospital report the same measures EPs don’t so not clear if how many EPs will be eligible for “improvement”
 Performance threshold will be established based on the mean or median of the composite performance scores during a prior period. The composite performance score will range from 0 – 100. The score will assess achievement & improvement (when data available) Hospital report the same measures. EPs don’t so not clear if how many EPs will be eligible for improvement")
43
Alternative Payment Model (APM) Incentive Payments
Beginning in 2019 and for 6 years 5% incentive payment for: EPs or groups of EPs who participate in certain types of APMs and who meet specified payment thresholds. Payment is made in a lump sum on an annual basis. EPs or groups of EPs meeting criteria to receive APM incentive payment are excluded from the requirements of MIPS.

44
APM Incentive Payment Requirements
Participate in a defined APM and meet additional criteria of an eligible alternative payment entity. Meet established thresholds. Definition of APM A Centers for Medicare and Medicaid Innovation (CMMI) model Medicare Shared Savings Program Accountable Care Organizations A CMS demonstration under section 1866C of the SSA; or required by Federal law
 model. Medicare Shared Savings Program Accountable Care Organizations. A CMS demonstration under section 1866C of the SSA; or required by Federal law.")
46
Questions?

Similar presentations
 requires the Secretary of the Department.>")


 Source: Centers for Medicare and.>")


